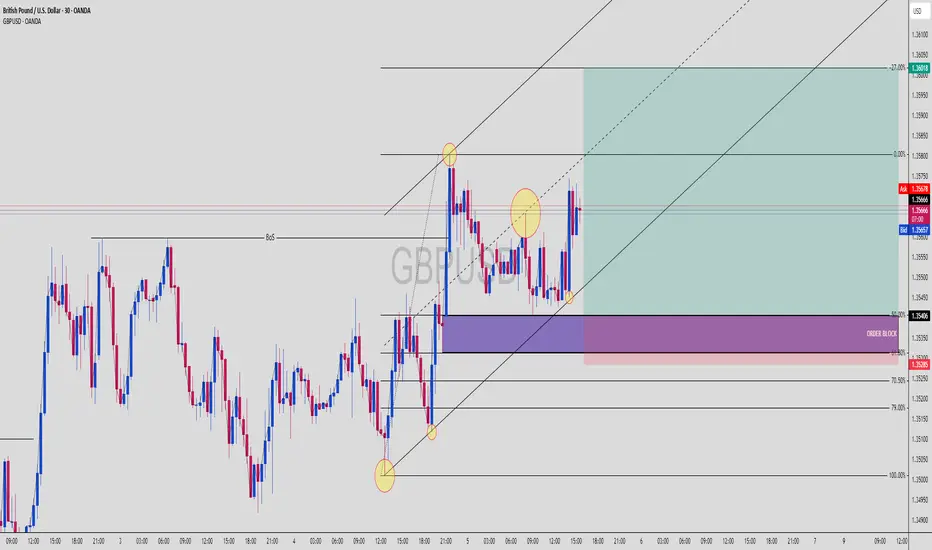
GBPUSD Buy Setup! BoS + OB + 61.8–79% Fib + Trend Channel ComboGBPUSD | 30-Min Chart – High Probability Long Setup Identified
GBPUSD is showing bullish intent after a clear Break of Structure (BoS) and now offers a high-confluence buy opportunity. This setup combines Smart Money Concepts with classical technical analysis for a sniper-grade entry.
🔍 Trade Breakdown:
📈 Break of Structure (BoS):
Price broke previous highs with strong bullish momentum.
Confirmed market intent shift from ranging to bullish.
📐 Fibonacci Confluence:
Price retraced perfectly into the 61.8% – 79% Fib zone from the latest bullish impulse.
These golden ratio levels align with an institutional Order Block (OB) and ascending trendline — high confluence entry.
🟣 Order Block Zone (OB): 1.35285 – 1.35406
The last bearish candle before bullish BoS — a clean demand zone.
OB sits within the Fib retracement zone and overlaps a mid-trendline tap.
📐 Fibonacci Levels (Swing Low to High):
61.8% = 1.35285
70.5% = ~1.35190
79% = ~1.35075
This is the institutional kill zone — OB + 61.8–79% retracement = precision buy levels.
🟡 Liquidity Sweep + Reaction:
Price swept liquidity below short-term lows and tapped the OB with a sharp bullish reaction.
Candle confirmation + lower wick shows strong rejection from Smart Money.
🧭 Projected Move:
Targeting a move toward the -27% Fib extension at 1.36018
Trendline and internal structure support bullish continuation
🔵 Projected Path:
Sweep ➝ OB/Fib confluence tap ➝ strong bullish continuation into premium territory
🧠 Chart Ninja Entry Plan:
🔹 Entry Zone: 1.35285 – 1.35406 (OB + 61.8–70.5% Fib)
🔻 SL Below: 1.35000 (beneath OB & key structure low)
📈 Target: 1.36018 (-27% Fib extension)
⚖️ RRR: 1:3+ — sniper entry with institutional precision
💬 Ninja Wisdom:
Smart Money isn’t buying breakouts — they buy retracements into OB zones with precision.
Combine OB + Fib + channel = institutional roadmap.
Let price come to you. Let retail chase. 🥷💸
📍 Save this GBPUSD setup before it hits the next impulse wave
🗣️ Drop your thoughts – are you buying this OB too?
👣 Follow @ChartNinjas88 for more institutional-grade setups daily
Fibconfluence
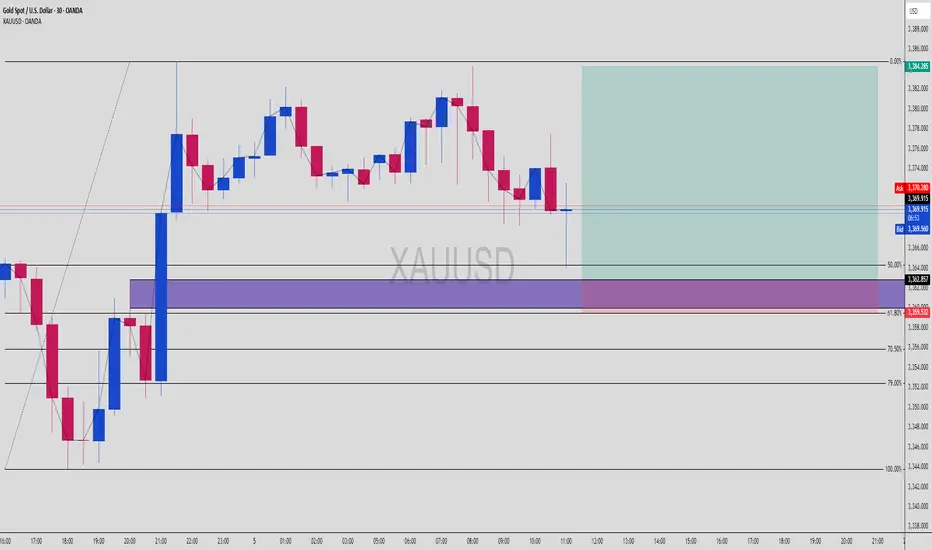
XAUUSD Reversal Zone Hit? OB + 61.8% Fib Tap In Progress!Gold (XAUUSD) | 30-Min Buy Setup – Smart Money Discount Reversal in Motion
We’ve got price doing exactly what Smart Money traders expect:
Impulse up → Pullback → Tap into OB inside discount → Launch 🚀
🔍 Breakdown:
Market Context:
Strong bullish impulse leg broke previous highs — a confirmed market structure shift
Pullback is targeting the refined Order Block + multiple fib confluences
Eyeing continuation toward 3,384.285 as main target
Key Confluences:
✅ OB Zone (purple): ~3,362.857
✅ Fib Levels:
50% = 3,364.000
61.8% = 3,359.532
70.5% = 3,356.000
79% = 3,352.000
✅ Perfect Entry Reaction: Price is starting to show a wick & stall around OB top edge (3,362)
Smart Money Entry Logic:
Price dropped from a recent high into a clean imbalance + OB area
Liquidity sweep below recent lows is setting up the reversal
Discount levels = ideal entry zone for institutional re-accumulation
Execution Plan:
Watch for M5–M15 confirmation:
Bullish engulfing or BOS inside the OB zone
Entry: Limit in OB or aggressive confirmation candle
SL: Below 3,352 (beneath 79% + OB bottom)
TP: 3,384 = last swing high
✅ RRR = 1:3+ — sniper-approved 😎
🎯 Game Plan Summary:
🔹 Entry Area 3,362.857 (OB top) → 3,356.000 (deep fib)
🔻 SL Zone Below 3,352
📈 Target 3,384.285 (premium high)
🧠 RRR Potential 1:3+ with structure & fib backing it up
💬 Pro Tip:
Let the market tap liquidity + react. No entry? No FOMO.
You don’t chase — you snipe from the OB treehouse. 🥷🎯
✅ Drop “Gold Ninja Setup” in the comments if you’re planning to catch this
📥 Save this chart — entries like this don’t show up every day
🚨 Follow @ChartNinjas88 for daily Smart Money sniper plays on XAUUSD & FX pairs
BTCUSD Rejection Brewing? OB + 79% Fib Tap Could Trigger Short!Bitcoin (BTCUSD) | 30-Min Sell Setup – Order Block + Deep Fib Confluence
This is a classic Smart Money short setup. Price swept lows, rebounded into premium pricing, and is now approaching a high-probability rejection zone — just the way institutional traders like it. 🧠💰
🔍 Breakdown:
Market Structure:
Recent move formed a lower low ➝ market structure is bearish
Current retracement is corrective, moving toward premium sell-side levels
Key Confluences:
🔴 Order Block (purple zone): ~105,200–105,300
🔴 Fib Confluence:
61.8% = 105,178
70.5% = 105,298
79% = 105,388
🔴 Price is tapping OB + 70.5–79% fib zone = sniper territory for shorts
Liquidity Perspective:
Earlier liquidity grab below 104,500 triggered this move
Now climbing back into premium pricing — potential trap before drop
Above the OB: resting liquidity + stop hunts expected
Execution Strategy:
✅ Entry confirmation: Look for M5–M15 bearish engulfing / BOS in OB zone
🎯 Entry area: 105,280–105,388 (limit or confirmation-based)
🛡 SL above 105,400 (above OB & 79%)
💰 TP zone: 104,500 (liquidity pool + fib 0%)
⚠️ Risk-to-Reward Ratio: 1:3+ potential — ideal for scalpers and intraday traders alike
🧠 Chart Ninja Notes:
You’re not chasing highs — you’re stalking where Smart Money sells to the crowd. This is premium pricing in a bearish leg, and BTC is approaching the kill zone. Patience = profit. 😤💸
📈 Game Plan Summary:
🔹 Entry Zone 105,280 – 105,388 (OB + 70.5–79% fib)
🔻 SL Zone Above 105,400
📉 Target 104,488 zone (fib 0%, equal lows)
🎯 RRR Potential 1:3+
💬 Pro Tip:
Wait for price to enter OB and stall before pulling the trigger.
The best trades happen after liquidity is swept — not before.
You’re not a retail trader. You’re a sniper. 🥷💥
📥 Save this setup & review it post-trade
🔁 Share your entry plan in the comments
⚡️ Follow @ChartNinjas88 for daily Smart Money BTC plays

USDJPY Long Setup: Triple Confluence Zone Locked InSmart money traders love one thing more than anything — confluence. This BTCUSD setup hits all the marks:
📈 Structure Breakdown:
Market breaks structure to the upside ✅
Impulsive bullish leg breaks prior high ✅
Pullback into 61.8% golden zone + OB ✅
Rejection wick = perfect entry confirmation ✅
This is a high-probability continuation setup after BTC made a clear bullish BOS (Break of Structure) on the M30 timeframe.
🟦 Order Block Zone:
OB Range:
Top: ~106,989
Bottom: ~106,759
This OB was the last down candle before the big bullish impulse that broke structure. Price returned to mitigate here, then instantly rejected = Smart Money entry confirmed 🔒
🧮 Fibonacci Levels:
61.8%: Sliced right into it
70.5% – 79%: Deeper liquidity zone just below
The entry wick taps right into the sweet OB/Fib confluence zone and launches 🚀. It’s giving sniper precision with a low drawdown entry.
🎯 Trade Parameters:
Entry: ~106,759
SL: Below the OB zone
TP: 108,022 (previous high)
That’s an RRR of around 3.5–4.0x — a clean asymmetric play, just the way smart money wants it.
🔍 Confirmation Factors:
Bullish BOS on M30
Price returns to OB zone + golden ratio
Clean rejection candle with demand absorption
No internal structure break = bullish narrative still valid
🧠 Key Lesson:
“When OB meets Fibonacci, don’t ask why. Load up — the market just told you why.”
Let setups like this come to you. No chasing, no emotions. Let the algo-driven footprints guide you to the money.
📈 Missed this one? Save it for your playbook — this is how high-probability trades are built.
Drop a 💰 if you caught the same move!

BTCUSD: 61.8% Fib + OB = Precision Long PlaySmart money traders love one thing more than anything — confluence. This BTCUSD setup hits all the marks:
📈 Structure Breakdown:
Market breaks structure to the upside ✅
Impulsive bullish leg breaks prior high ✅
Pullback into 61.8% golden zone + OB ✅
Rejection wick = perfect entry confirmation ✅
This is a high-probability continuation setup after BTC made a clear bullish BOS (Break of Structure) on the M30 timeframe.
🟦 Order Block Zone:
OB Range:
Top: ~106,989
Bottom: ~106,759
This OB was the last down candle before the big bullish impulse that broke structure. Price returned to mitigate here, then instantly rejected = Smart Money entry confirmed 🔒
🧮 Fibonacci Levels:
61.8%: Sliced right into it
70.5% – 79%: Deeper liquidity zone just below
The entry wick taps right into the sweet OB/Fib confluence zone and launches 🚀. It’s giving sniper precision with a low drawdown entry.
🎯 Trade Parameters:
Entry: ~106,759
SL: Below the OB zone
TP: 108,022 (previous high)
That’s an RRR of around 3.5–4.0x — a clean asymmetric play, just the way smart money wants it.
🔍 Confirmation Factors:
Bullish BOS on M30
Price returns to OB zone + golden ratio
Clean rejection candle with demand absorption
No internal structure break = bullish narrative still valid
🧠 Key Lesson:
“When OB meets Fibonacci, don’t ask why. Load up — the market just told you why.”
Let setups like this come to you. No chasing, no emotions. Let the algo-driven footprints guide you to the money.
📈 Missed this one? Save it for your playbook — this is how high-probability trades are built.
Drop a 💰 if you caught the same move!

BTC (Y19.P6.Video.C) Cont.Is the bottom in?Hi,
Welcome to my 3rd video which will be part of the series of the Bitcoin Macro trend.
****************************************************************************************************
Note: I posted a Macro Level chart back in July this year that is doing a good job for the current price formation.
The logic of this chart is also used as a reference but I did not have time to explain it in this video but it supports my thesis with the bottom being in.
I will include that post in the next video as well, to explain why I think the price will move a certain way.
The logic for this chart below, posted back in July is that after parabolic run, we will naturally see a sell off at the top.
and then the price will drop back to the support zone where it all started from, the parabolic run. Here there is an already established channel.
****************************************************************************************************
In this video I will be talking about the current trend and its structure and what my take is from a number of sources.
Hence this presentation is a compilation of ideas that I have taken from others and incorporated them with my ideas as well.
Unfortunately I ran out of time so I will need to continue this video to finish of with Moving Averages and the 3rd part, which is fib. channels.
This video quickly recaps the previous videos and covers the x2 Btc cycles that occurred with each cycle having 4 phases or stages.
Each stage identified with its parabolic advance which is supported by the RSI
phase 1 and phase 2 have a common support level, base trend line
so we are going to try to use this historical reference for today's chart
This video covers chart structure using fibonannci as a means to make sense of the chart, I will highlight key milestones and pivot points
with the help of pitchfork, fib fan, fib circle, fib extension levels
The last part of this video covers the MA method.
Using Ma, we get the bottom support line using the 50,100,200 weekly ma.
cross over represents a bullish momentum.
Previous Video Post
July 22 post, that is somewhat accurate for today's price structure and this post demonstrates why it works based on a no. of assumptions.


BTC (Y19.P6.Video.B) Cont.MacroOverviewHi
Yesterday i posted the 1st of many planned video's to come.
The first video covered BTC at a high level, which encompassed the life cycle of Bitcoin and the many phases that make it up, which is based on my perception
and what I see from the historical data.
This video is to continue off from where I left yesterday to cover some other components I have observed with the bitcoin cycle.
To recap from the previous video, I pointed out the following
> The life cycle x2 and how we are moving to the 3rd life cycle
and why I think we are about to complete phase 1.
Now I talk about other components that I didn't cover or just slightly touched on
These are:
>Symmetrical triangle
>Fib.pitchfork which gives us a channel overview and to understand how we change trends.
>RSI
>Common baseline \ trend line for support
>Price pullback in the phases
I didn't get to cover or demonstrate the usefullness of Fib.Circles and its relevance to today.
Especially around the pivotal point of 0.618, =7400 price range and its significance.
That will be the video after this.
Please gives a thumbs up if you agree or like it.
Regards,
S.Sari /CyptoProspa
The Charts to go with this are here"

BTC (Y19.P6.Video.A.1st.of.a.series.of.videos) Macro.OverviewHi,
Yesterday, I attempted to present a overall assessment of BTC in the single video, which turned out to be bad for a number of reasons, most of all, the voice recording, it was terrible.
So I decided to break this presentation into a series of posts, each covering BTC from a specific point of view and level in terms of TA.
This video post covers BTC from a very high level, from 2012 to the present day and future, end of 2021.
I have kept this video at a high level so I can get a few key points out.
The next video will focus on Year 2019 and were we are at.
I have also added links here for recent BTC TA, if your interested and these do fit into the next video in terms of reason and the argument as to why we are moving away from a down trend
and back to another bull run (Phase 2. watch this video to understand).
So please have a listen and I will happy to respond to any questions or points that you want me to cover in the next video.
PS> I played back this video prior to posting it and it sounded good. I switched the microphone with a quality one and deactivated the mic component on the bluetooth speaker so it just acts a speaker (BOSE speaker + also acts like a microphone).
Fingers crossed, it uploads with no quality loss.
The next video post, I will demonstrate the usefullness of Fib.Circles and its relevance to today.
Especially around the pivotal point of 0.618, =7400 price range and its significance.
Please gives a thumbs up if you agree or like it.
Regards,
S.Sari /CyptoProspa

UsdJpy Long UsdJpy putting a healthy uptrend on the 1hr with some room up to go higher. Nice fib cluster at our first resistance turn support level and a good probability setup to keep an eye on.

AUDUSD long to AB=CD, Fib confluence, then lowerAUDUSD has a few things lining up which I think makes for a good play. If we look for a 3 wave retracement to complete as AB=CD equality, it will hit bang on a long term Fib confluence level. Some further analysis on higher time frames supports the idea that it will then head lower. I might update the idea to show, if anyone is interested.

USD/CHF projected price pathThis just seems how all the fibs are measuring out wave wise. Watch that 99000 level.

BTCUSD Resistance Level - Fib ConfluenceBITFINEX:BTCUSD
The precision of the confluence between the two fib retracement levels struck me when I was plotting out resistance levels. On that basis I suggest keeping a close eye when price reaches 12,961. A break above would be very bullish but I think it is likely there will be some retracement from near the 12,961 level before the next wave up.

EURUSD: An AnalysisIn my last post (June 2017) I discussed two scenarios. The first scenario worked well.
The pair broke out of consolidation, thus crossed the first strong pressure zone Z1. It faced resistance from a minor pressure zone (labelled on the chart) and pulled back for a retest of the breakout level before resuming its uptrend towards the next major pressure zone Z2. Currently it has been facing resistance Z2.
On this larger time frame, a pullback to the earlier minor pressure Zone (potential support now) can be expected. If potential support holds then we may expect retest of Z2.
It can be seen on the chart that there will be a huge potential opportunity beyond Z2. Although a smoother journey can not be expected from Z2 to Z3 yet trading in the direction of major trend may yield good returns.
I hope this analysis would help some traders in making better trading plans for this pair.
Do hit the like button.
Regards
Bravo

RETEST PREVIOUS HIGH OR LOWPrice is at a confluence point where 50 sma and 50% fib have meet.
Price is inbetween the 100 sma and 50 sma resting at the 100 sma
Macd did cross above the 0 levelo line which indicates bul;lish bias
If price does go long exit trade if macd crosses back below 0 level line
If macd crosses below 0 level line and Red signal line bias is bearish.
Take Profits are at previous high or low.

GBPUSD - H1 - Possible counter trend move up here on CableThe overall trend is bearish but looking for a bullish opportunity here back up into some previous structure where other traders might be looking to get short again.
We have several tests of the lower levels here, and have been consolidating a bit in a rectangular channel which we seem to have recently broken out of. Would be looking for an entry reason around current levels to get long up to a potential area of Fib confluence with an equal measured move potentially completing up there as well.

USDJPY: Downtrend Harmonic Move SetupConfirmations:
4 Fib confluence
RSI overbought
AB=CD pattern
Price at 4H trend's lower high
Target:
Retest of C structure or lower (riding the trend)

AUDNZDMarket is in a downtrend, however the recent outbreak to the upside can be a potential relief rally for the market, and after i this complex pullback has completed the market is going to retest structure lows, and maybe even carry on the underlying trend, which is bearish

AUDCAD - Trend ContinuationTrend continuation trade.
Daily chart shows price moving towards price level @.03400 (uptrend).
Fib confluence @.03318.
Nice risk reward ratio.

GBPUSD : Counter trend shorting chance !Hey Guys,
Though I had drawn this much earlier I was waiting for the right moment to post it. So as I have expected GBPUSD came up to resistance area, shot over little bit. But we have ABCD pattern completion in same resistance area. If we draw couple of fib lines you can also find how well fib levels align in the resistance area. With RSI also being oversold in Hourly GBPUSD, we can initiate short positions.
Hit Likes to support the idea...Thanks for your support !
Happy Trading !

Larsen Toubro LT : Swing Entry SetupHey Guys,
Having cheerful Sunday ? Lets do some analysis on LT ?
Don't get confused why chart is loaded with Fib levels, for better understanding and explanation purposes I have marked numbers for Fibs.
Those who followed Me for sometime will be clear the principal I use - " Gaps will be always Filled "
I kept this LT in My radar from the day it gave huge gap up bcos it needs to be filled for sure. But was waiting for right time to post this. In coming 2-3 weeks it will be filled I believe.
Fib 1 : This is drawn on Larger swing and we are concentrating for Fib levels in Gap area and we got 61.8% (Golden ratio) and 50.0% passing through this area.
Fib 2: Drawn on current larger swing and 38.2% passing through our expected area (gap zone)
Fib 3 : By now you will be knowing which Fib level in our Gap area. So I am not gonna mention. Bcos I believe in mutual learning and teaching a Man to catch his own fish, not to feed fish always.
So with these Fib Confluences I will be buyer if LT comes to this zone. I hope you have learnt to catch certain type of fish today or atleast where to fish :)
Have a happy Sunday, Enjoy
