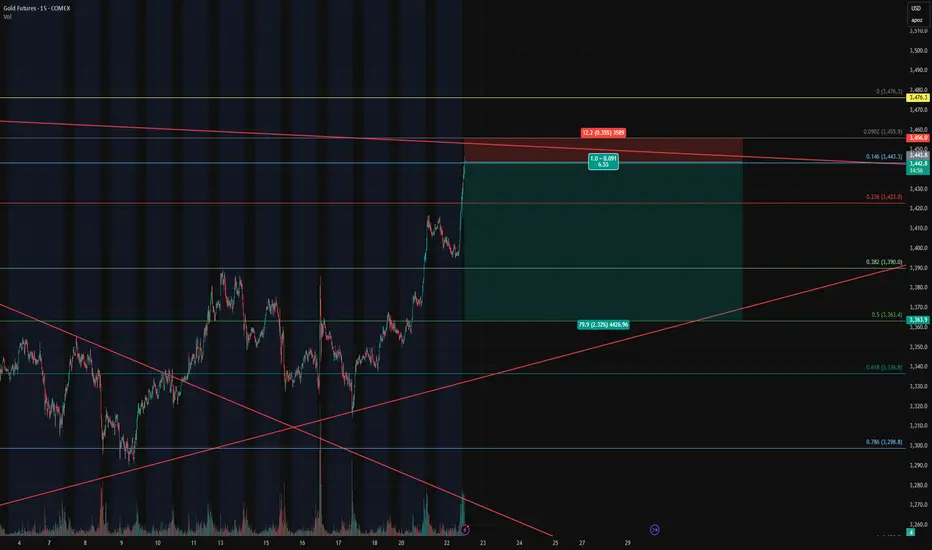
Gold Futures – Closing Longs and Flipping Short at Key Fib🔴 Gold Futures – Closing Longs and Flipping Short at Key Fib Confluence
Instrument : Gold Futures – COMEX ( COMEX:GC1! )
Timeframe : 15-Minute
New Position : Short
Entry Zone : ~3442
Target : ~3362
Stop Loss : ~3458
Risk/Reward : Approx. 6.5+
Setup Type : Reversal from Overextension / Fib Resistance
💡 Trade Recap & Strategy Shift
We’ve officially closed both our recent long entry and our larger swing long position, locking in substantial profit on this move off the 0.618 retracement.
Now, we’re flipping short based on the following:
Price reached the 0.146 Fib extension from the previous retracement leg, a level often overlooked but powerful when confluence lines up.
Trendline resistance from the upper channel has been tagged.
Momentum is showing early signs of stalling after a strong vertical push — textbook overextension.
The rally into this level lacked divergence or structural buildup, increasing the chance of a snapback.
🛠️ Short Setup Details
Entry: 3442 (after signs of exhaustion near Fib confluence)
Target: 3362 (prior structure + 0.382 retracement)
Stop Loss: 3458 (just above high / resistance zone)
Risk/Reward: 6.5:1 — excellent profile for a countertrend play.
📌 Watch For
A break below 3390 will be key confirmation of momentum shifting back down.
Failure to hold 3442 on a retest will invalidate the short and re-open the door for a squeeze higher to 3476/3480.
With trend exhaustion in sight and high confluence resistance overhead, we’re taking the opportunity to pivot short — fully aware of the volatility this region can bring.
Fiblevels
S Token Breakout Play – Fibonacci Level in FocusThe chart for S is shaping up well, especially with price action testing and now breaking above the 50% Fibonacci retracement level at $0.52. This breakout zone often acts as a pivotal shift in sentiment from consolidation to continuation.
📍 Entry:
Around $0.52 breakout confirmation
🎯 Take Profit Targets:
🥇 $0.60
🥈 $0.70
🛑 Stop Loss:
$0.49 (just below the breakout level to protect against fakeouts)

ONDO making a parabolic move here. It’s difficult to call what ondo just broke upward from a cup and handle because the handle is extremely small even on small time frames as small as the 1hr timeframe, however there is some bullish confluences that if you treat it the same way you would treat a cup and handle to ensure the breakout target, you find that the target is exactly at the 1.618 Fibonacci level which is a very common breakout level that things tend to climb two when the breakout up from a previous pattern and surpass their previous highs. Due to this confluence. Think we have enough to go by here to make a rough speculative guesstimate at least of what price target ondo may currently be heading towards. *not financial advice*

GU is Bearish Now. Looking for Entry!waiting for price to confirm it is ready to move bearish. Now we have news scheduled next session. I shall wait for news to pass and see how price reacts.

DG Daily Levels Match Up Almost Perfectly with Fibonacci LevelsDG
Replay of DG's Price Movement & Volume -13 October 2023
Dollar General (DG) gapped up and was up 9.16% on the day. DG's volume was nearly 3 x's the amount it was over the last 2.5 weeks.
Daily Levels & Fibonacci Levels
*The .38 retracement level on the daily is in confluence with the 116 daily level on the chart. The .50 fibonacci retracement level aligns with the 120 daily level. Also, the .618 (the reversal fib retracement level), is in confluence with the 124.85 daily level. I like when I see levels line up nearly perfectly with fib retracement levels 😃

CADJPY - SHORT - Price reached Fib discount levels Since price made the first leg downwards, we had a retracement of more than 50% at fib levels, which makes grade opportunity to short. Watch for rejection First TP the structure below, Second TP after securing some profits at a level below at the order block.

EURUSD - LONG TradeThe price made a break of structure made a push higher and now came back to the Fib discount levels between 50% and 61.8% touching the order block that created a big move.
TP is showing on the screen with R:R 3.

BTCUSDT first short-term fall then heavy pumpBased on Fibonacci levels and range here near the 29K$ resistance zone we can expect a short-term fall here at least to the first two Fib levels which are:
A. 0.236% Fib: 26140$
B. 0.382% Fib: 24400$
then if these Fibonacci levels hold Bitcoin will continue pumping and the bull market will lead once again.
DISCLAIMER: ((trade based on your own decision))
<>

$EXR longAs you can see on the chart - when the price re-tests the broken trendline I'll enter the market. Seeing an upside potential. Good trades, folks. ;)

Fid Levels and Bitcoin Price Predictoin🗺️ We mapped out 2 ABC patterns for BTC to complete up NYC Open Thursday morning.
🥇 The Blue pattern we feel is the more likely, and the yellow our 2nd choice🥈

GBPJPY BUYHello traders.
GBPJPY has performed a quite bullish price action. But the market makers' game is usually trapping the retailers on Mondays and reverse the trend later during week. So, I am sceptical.
The pair definitely needs corrections and that is not only an opinion of mine.
It is overbought so many big players will close their profits pretty soon. However, it remains bullish in technical analysis and GBP is bouncing from the lows while JPY keeps loosing value.
Drawing Fib levels from the Swing Low to Swing High, based of the last 4H impulse move, I consider the below Fib retracement area as a great long opportunity.
163.585 - 166.057
Note: it is at a weekly Supply level but I see the potential to break it and aim for Multiyear highs.
good luck

xauusd Update for gold.
Negative US data impacted on this chart.
Some may see it as an elliot wave theory approach in the 4H chart with waves 2 and 4 pretty small.
The fact is that the pair is now bullish. So, the three green line are in my view the key support levels for intraday trades
especially the 1730 zone which is in confluence with 0.5 Fib level.
Furthermore, the 1764 level has been a strong resistance level which has not been touched since 26th of August.
Watch price action. Big wicks etc close to this level. if price breaks above and holds it will go for the 1803 level.s
On the other hand, there an equal probability for price to sell a bit and seek for support close to the above mentioned fib levels and green line
supporting areas.

Possible short trades for ETH on hourlyI think these are nice possible short trades on hourly.
The first one I see is price pullback to around ~1356 and I set stop loss of 1.25% for this, this is a bit risky and can be tighter but I'm ok with entering with small position here. I'm looking for first TP around ~1325, which is one of the target I got from this fib.
The second one I see is possible double top forming around ~1370 and I set stop loss of 0.5% for this, it can be tighter since it is based on double top forming. This trade is much more safer and the first TP is still around ~1325 considering the strong trendline support.
I personally plan on entering with small position at ~1356 and adding some more at ~1370 with stop loss being above the possible double top scenario.
Note:
I'm only going to take these trades on these entry targets being hit and I will also be looking at the price action around these entries for confirmations.
To see clearly, zoom in.

Bitcoin Chart Levels📈 Bitcoin today has bounced off the 200 EMA on the 4-hour chart, for the third time in its most recent channel.
🏗️ We laid out the relative Fibonacci Levels, for if Bitcoin continues its trend of bouncing off the 200 EMA.
🏗️ Currently BTC is right at the 50 EMA for the 1-Day Chart. This is an important level, so for BTC to close a 4-hour candle above it, will strengthen the bounce upward.

can nifty crashes be predicted?clearly im not making this up never thought nifty was technical almost all the time so next time maybe when the new variant of corona comes up you know what tool u need to use 😁.

$HOOD Fibonacci, Bull Flag, Trend line Retouch, now we go up?This chart is similar to the chart for WISH, in my opinion. Similar, yet holds a few critical differences- primarily, the trend line placement & consolidation since March 29th. It looks to me like the price consolidated in this wedge, is being held up, formed a bull flag, came back down to touch it, & in doing so has consolidated further on the fib levels of a fibonacci pattern, & is due to move upward.
Unless, of course, there's a whole lot more sideways action.. As we see with WISH.
*Not trading advice.

Possible retracement to 0.168 fib levelIn the bigger picture we might see a retracement down to the 0.168 fib level around 15k. This would still fit in the picture of a potential falling wedge pattern, which (when breaking out) would flip us bullish again. There is also very little support between here and ~14k, so if our support around 20k (previous bullrun's top) would fail, we are likely to visit mid-10k's.

Buying Opportunity: Carvana (CVNA)This analysis is fairly straightforward. Carvana (CVNA) is nearly fully retraced. Momentum downward is slowing, multiple indicators are showing a bottoming pattern, and open interest in calls is increasing. Although the price can still fall another 10-20% to the low, it's likely that a bottom is near. This is an obvious choice for long-term investors who want to enter at the bottom to go long. Be aware that this is a monthly chart and reversals can take time. Conservative investors may wish to wait until a bullish monthly or weekly candle forms before entering to go long.
Not financial advice.

🚨Short-Term ⚠️POSSIBLE⚠️ Bottom Levels For #Bitcoin $BTC🚨After breaking the downwards trend to the upside, the $BTC price has crashed back down into the wedge, forming a small bear flag inside. IMO this is showing that the mid-term pattern that $BTC has been in will break to the downside. This will possibly be a big "fake-out" for bears and might cause some sort of a short-squeeze situation. In anticipation of that, I have charted out these possible bounce levels, ranging from ~$26K to ~$28K. I have done this, using the macro Fibonacci Retracement levels, the Fib levels of the most recent short-term wave, and 0.618 Fib levels which sit between 1 & 1.618 of each Fib Range in a "scaling down" method. (It was way too busy to leave on the chart, but imagine Russian dolls. 1 Fib range inside another, inside another, etc.)
Important "possible-bottom" levels:
$27,550
$27,071
$26,531
$26,200
$25,982
***This is my own opinion, based on chart data. Not Financial Advice!***

EURGBP LONG BEFORE SHORT.Hello everyone, in todays analysis on EURGBP, I am looking to go long once market opens with a tight SL. I am looking for price to get to 0.8300 before shorting as market is trending on an ascending channel. If price fails to push up to this zone and breaks the trend line below, I will look for a short position. Good luck and have a successful trading week.
DYOR & Just trade what you see. Let the market tell if you are right or wrong, that is the best way to learn in the forex market.
KINDLY FOLLOW AND LEAVE A COMMENT.

The Bullish Month of April [ ETH ]Crypto Traders,
Appreciate you taking the time to view my TA, which hopefully provides an alternative perspective. Please be sure to “LIKE” if you indeed find my analysis useful and/or want to share your opinion.
Analysis:
@ $3044 to $3000
Need support validation, which we have multi bullish confluence if support holds w/in region.
If support is validated, would need to see closure above $3360, in which TP would be around $3940. If
the opposite holds true and support is not conf. , next support level that would need to be validated would be around
$2875 to $2780
Entering bearish control on Money Flow Index, in conjunction w/ TSI crossover to the downside due to over-hanging resistance.
Also, TSI is falling below 25, which can be seen as a sell signal.
Cheers & Happy Trading!

NASDAQ100 in a correction - next big move UP?Nasdaq 100 is currently correcting that rallye we just saw.
Target for the correction is that green box. If we turn in that box, which is the fibonacci "golden zone" (.382 - .618 Fibonacci), the measured move of that first wave up, would exactly hit the .886 retrace from the all time highs to the bottom of the whole correction structure From there we could either sell off sharply, or we somewhat hold that level and attempt a break out to all time highs.

IOST/BTC TRADE SETUP! READY TO PUMP 200%Hello everyone, if you like the idea, do not forget to support with a like and follow.
Welcome to this IOST/BTC TRADE setup. IOST looks good here.
IOST is breaking out from a descending triangle in 2days time frame. It is holding very important support. Buying here will be very low risk and high reward.
Also according to Fib levels, there is an important support of 0.786 level. So it is worth buying here.
Buy some now and add more in dips.
Entry range:- 54-60 sats
Target1:- 82 sats
Target2:- 98 sats
Target3:- 116 sats
Target4- 130 sats
Target5:- 154 sats
Target6:- 178 sats
SL:- 50 sats
If you like this idea then do support it with like and follow.
Also, share your views in the comment section.
Thank You!
