Fibo


Demand Zone + Bullish PinbarFirst touch of demand zone, there has been a good buyer entry. If the price came back to zone, I'm looking at Buy entry at Bottom candle Low price, as the candle is Bullish Pinbar candle. And exit target is based on Fibo Musang (reverse Fibo Retracement), exit at TP2 = level 261.


Bullish Pinbar as Support ZoneThere are two Bullish Pinbar as bottom candle (support zone) which the zone doesn't overlap. I will be looking for safe buy entry starting from Low price of Bullish Pinbar #2, and looks more possibility the price will enter demand zone of Bullish Pinbar #1. If price doesn't break Fibo level 100 (1.00), i will look for next buy entry at Low price for Bullish Pinbar #1. So safer exit will be at Fibo level 100.

Support Break (LLb) + Fibo Musang Entry and TPFrom top that makes HHb (Higher High Break), then bottom that makes LLb (Lower Low Break), i'm looking at sell entry at Fibo Musang level 23, then TP at nearest level 161.


CAD/CHF SHORT SETUPfter nearly 6 months of consolidation, we saw the bottom fakeout and the begining of the rising up of the Canadian currency. At the 66.7% fibo level, we saw the beginning of the start movement and the creating formation of the HnS pattern. At the moment, we expect a retest of the neckline and another drop down. If the market does not negate the pattern, we expect further reactions in the 50-66.7% fibo zone and a correction that will probably break out the imbalances that occurred around the neckline. The continuation of the movement is expected to the 1.61% level of fibo expansion, which at the same time may complete another HnS pattern in D1 tf, which will probably start of full trend reversing
The yellow fields are the supply / demand zones. The places marked in red are the most important zones where fibo, s / d, s / r pivots clusters overlap. Note that moving avarages in chart works as support / resistance .
It is also worth taking a look at the strong reaction at the fibo levels of 55.9% and 61.8 (excluded) -66.7% fibo+Elliot Waves
Warning! Im using different settings of cloud
If you want to know more about the strength teamt and the precise direction of the trend and reaction to the zones, I recommend that you start using Heikin Ashi and Renko candles
If u have any questions ur always welcome to write amilerski@icloud.com
~~~Remember that the above analysis is only an idea :) You are responsible for your money yourself.~~~~
The market will verify! Bless!


How to use Fibo levels in trading?Hi guys, as I promised, this post is about Fibonacci Levels for YOU!🧡
Many newbies on the market, and I'm sure this post can be helpful, so must be repeated 💪
Leonardo Fibonacci is a great mathematician who lived in the XI century. The scientist deduced a number of natural numbers, which later began to bear his name.
Each number in the series was the sum of the two previous numbers: 1 + 1 = 2; 1 + 2 = 3; 2 + 3 = 5 etc.
The result is a series of numbers: 1, 2, 3, 5, 8, 13, 21, 34, 55, 89, 144, etc.
Fibonacci numbers have some properties:
📌Division of any number of the series into the subsequent tends to 0.618 (the golden ratio in ancient Greek and ancient Egyptian cultures);
📌dividing any number of the series by the next + 1 tends to 0.382;
📌dividing the subsequent number of the series by the previous one tends to 1.618;
📌division of the number of the series by the second number preceding it tends to 2.618.
Fibonacci numbers are often used not only in technical analysis , but also in physics, astronomy and other disciplines.💪🏻
Fibonacci levels are a tool that sets horizontal support and resistance levels on the price chart based on price movement.
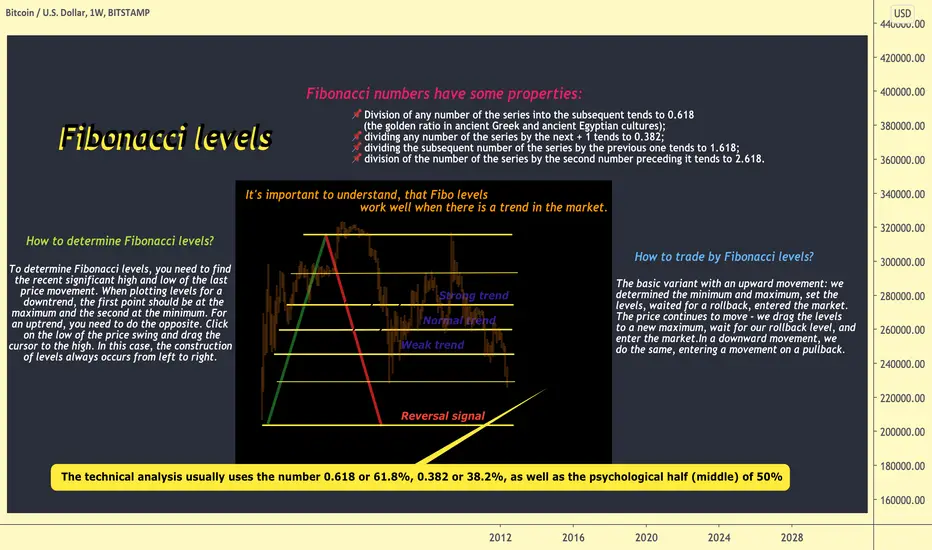
It's important to understand, that Fibo levels work well when there is a trend in the market.
How to determine Fibonacci levels?
To determine Fibonacci levels, you need to find the recent significant high and low of the last price movement. When plotting levels for a downtrend, the first point should be at the maximum and the second at the minimum. For an uptrend, you need to do the opposite. Click on the low of the price swing and drag the cursor to the high. In this case, the construction of levels always occurs from left to right.
How to trade by Fibonacci levels?
The basic variant with an upward movement: we determined the minimum and maximum, set the levels, waited for a rollback, entered the market. The price continues to move - we drag the levels to a new maximum, wait for our rollback level, and enter the market.
In a downward movement, we do the same, entering a movement on a pullback.
The technical analysis usually uses the number 0.618 or 61.8%, 0.382 or 38.2%, as well as the psychological half (middle) of 50%.
✔ Very often, based on these coefficients in the technical analysis of the market, Fibonacci lines, Fibonacci levels and Fibonacci periods are built.
Fibonacci lines are built relative to significant highs / lows and represent support or resistance lines, from which they make a purchase or sale.
Fibonacci numbers - the magic of numbers that works in trading and in everyday life .
💥You can simply draw arbitrary horizontal lines on the chart, and ... oh that's mystic... they will also be worked out both in the past and in the future.💥
We can make some conclusions:
🔵Fibonacci tool draws support and resistance lines on the chart based on price movement;
🔵the Fibonacci tool is always applied on the price chart from left to right, both in the case of long positions in an uptrend, and in the case of short positions in a downtrend;
🔵the levels marked between the beginning and the end of the price movement are correction levels, they show which levels the price is likely to return to;
🔵the most common Fibonacci retracement levels are 38.2%, 50% and 61.8%, they are often used to enter the market;
🔵there are two ways to use correction levels to enter the market: aggressive (entry at each of the levels) and passive (waiting for the price to correct in the originally observed direction);
🔵It's important to note that Fibonacci levels are not a trading system, they are an additional tool that only suggests possible correction levels; it should be used only in combination with a trading system or as part of a trading system.
I hope everything was clear for You, and You found this post as helpful🙏🏻
I really wanna be useful to you, guys!
I make every post with love and it brings me extraordinary pleasure!🙏🏻
Thank you for staying with me💋
Always sincere with You🧡
Your Rocket Bomb🚀💣
EURJPY Buy and Sell set upHello everyone
Here's the latest EURJPY analysis.As you can see, this is just price action analysis and you should be patient till get right candle stick confirmation.
good luck

#BTC #Bitcoin AnalysisBitcoin has broken the outer bullish channel that we have been following for some time, which has caused a noticeable increase in price action, reaching its new ATH above $ 28,400. The RSI indicator made a double top in the overbought zone, in 1 hour candles, while the price and volume range show great indeterminacy in the market, forming an evening star, indicating a loss of strength in the trend.
We feel that a correction to the $ 24,100 level may come, but another path would be to perform a continuation sideways move.

Short plan BTCI'm entering shorts at the 78.6 fib. And around $24100.
take profit's are open. The goal is below $10000


Fibonacci Levels - Rocket Bomb's EDU post 🔥Hi guys, as I promised, this post is about Fibonacci Levels for YOU!🧡
Leonardo Fibonacci is a great mathematician who lived in the XI century. The scientist deduced a number of natural numbers, which later began to bear his name.
Each number in the series was the sum of the two previous numbers: 1 + 1 = 2; 1 + 2 = 3; 2 + 3 = 5 etc.
The result is a series of numbers: 1, 2, 3, 5, 8, 13, 21, 34, 55, 89, 144, etc.
Fibonacci numbers have some properties:
📌Division of any number of the series into the subsequent tends to 0.618 (the golden ratio in ancient Greek and ancient Egyptian cultures);
📌dividing any number of the series by the next + 1 tends to 0.382;
📌dividing the subsequent number of the series by the previous one tends to 1.618;
📌division of the number of the series by the second number preceding it tends to 2.618.
Fibonacci numbers are often used not only in technical analysis , but also in physics, astronomy and other disciplines.💪🏻
Fibonacci levels are a tool that sets horizontal support and resistance levels on the price chart based on price movement.
It's important to understand, that Fibo levels work well when there is a trend in the market.
How to determine Fibonacci levels?
To determine Fibonacci levels, you need to find the recent significant high and low of the last price movement. When plotting levels for a downtrend, the first point should be at the maximum and the second at the minimum. For an uptrend, you need to do the opposite. Click on the low of the price swing and drag the cursor to the high. In this case, the construction of levels always occurs from left to right.
How to trade by Fibonacci levels?
The basic variant with an upward movement: we determined the minimum and maximum, set the levels, waited for a rollback, entered the market. The price continues to move - we drag the levels to a new maximum, wait for our rollback level, and enter the market.
In a downward movement, we do the same, entering a movement on a pullback.
The technical analysis usually uses the number 0.618 or 61.8%, 0.382 or 38.2%, as well as the psychological half (middle) of 50%.
✔ Very often, based on these coefficients in the technical analysis of the market, Fibonacci lines, Fibonacci levels and Fibonacci periods are built.
Fibonacci lines are built relative to significant highs / lows and represent support or resistance lines, from which they make a purchase or sale.
Fibonacci numbers - the magic of numbers that works in trading and in everyday life .
💥You can simply draw arbitrary horizontal lines on the chart, and ... oh that's mystic... they will also be worked out both in the past and in the future.💥
We can make some conclusions:
🔵Fibonacci tool draws support and resistance lines on the chart based on price movement;
🔵the Fibonacci tool is always applied on the price chart from left to right, both in the case of long positions in an uptrend, and in the case of short positions in a downtrend;
🔵the levels marked between the beginning and the end of the price movement are correction levels, they show which levels the price is likely to return to;
🔵the most common Fibonacci retracement levels are 38.2%, 50% and 61.8%, they are often used to enter the market;
🔵there are two ways to use correction levels to enter the market: aggressive (entry at each of the levels) and passive (waiting for the price to correct in the originally observed direction);
🔵It's important to note that Fibonacci levels are not a trading system, they are an additional tool that only suggests possible correction levels; it should be used only in combination with a trading system or as part of a trading system.
I hope everything was clear for You, and You found this post as helpful🙏🏻
I really wanna be useful to you, guys!
I make every post with love and it brings me extraordinary pleasure!🙏🏻
Thank you for staying with me💋
Always sincere with You🧡
Your Rocket Bomb🚀💣

Pack Your Bags For XRP Moon ShotMy Fellow Crypto Traders,
Appreciate you taking the time to view my analysis which I hope you may find beneficial. Please be sure to “LIKE” if you indeed find my analysis useful and/or find my analysis intriguing.
Cheers & Happy Trading!
--------------------------------------------------------------------------------------------------------------------------------
ANALYSIS:
Due to XRP's heavy correlation with BTC, we could see XRP have an aggressive run-up. Currently, we are seeing the 9EMA possibly getting ready to cross the 20EMA. If BTC continues to push higher into uncharted territory, XRP will surely follow.

ZIL Final Dip Before $0.05 & BeyondMy Fellow Crypto Traders,
Appreciate you taking the time to view my analysis which I hope you may find beneficial. Please be sure to “LIKE” if you indeed find my analysis useful and/or find my analysis intriguing.
Cheers & Happy Trading!
----------------------------------------------------------------------------------------------------------------------------------
ANALYSIS:
ZIL appears to have formed a channel that has been well respected since late Nov. As the RSI reflects ZIL is extremely overbought, which we could get a slight pull-back to the 50EMA, and find some support. Therefore, a 50EMA bounce would coincide with the 382 fib level, which has been a relatively strong resistance level. Would definitely keep my eye on a re-test of the 382, and if it holds as support, could be a great entry point.


Selling GOLD - after break of counter trend line and MA crossoveW - downside
D - downside
4H - pullback FIBO
2H - counter trend line break ? and MA crossover ?

fcpo still bullish after gartley pattern establishedfcpo is likely to rise after gartley bullish harmonic pattern form
target 3476
trade on your own risk
