BTCUSDT longBINANCE:BTCUSDT
I have such a feeling for Bitcoin, but I do not suggest entering the position here
Fibo

ETH/EUR Fibo 0.5/0.618as you can see in the last major correction of ETH/EUR the price came between the fibo 0.5 and the fibo 0.618, I marked the past fibo in the same way from top to bottom and marked the same values as a reference point for the future , in euro the values are 570, and 295 are absurd prices taking into account the price at which ETH arrived and the prices they are today, analyzing the LONG trend the current downward channel dashed goes in the direction of the channel bottom dashed in the long term, at any time it can reverse and the price will look for higher tops as desired but these values can come to be a reality and making a conservative analysis taking into account that ETH in addition to classic currency has immense utility in the entire ecosystem nowadays, not being so used on the previous fibo analysis date, I would say that at least at the MINIMUM the price will test the 0.318 fibo zone, in euros 948.16, the numbers point to much lower zones but due to adoption and utility an analysis more conservative may be closer to reality, I shared this data just to open the mind to the possibilities, there are those who only speculate on prices and don't use the ecosystem, and don't have a notion of the fundamentals of projects in general, to make a profit not analyzing the fundamentals but it's good to have the foundation as a variable in an analysis because whether people ignore it or not, behind each coin there is a project and its adoption and utility can also have weight in future projections, this is not a prediction, it's one more warning that something dramatic can happen without leaving the long trend and then looking for new historic tops, I remind you that corrections are inevitable and necessary for markets to grow healthily

XAUUSD week buy breaks the trendlineXAUUSD week breaks the trendline, the triangle frame goes up. Fibonancy target 1.618 .good luck

EURUSD-- 12 pip risk while bigger moves developUsing fibonacci and basic probabilities to make a small risk while monitoring price movement on EURUSD intraday timeframes. Let me know your thoughts about this idea in the comments below. Be sure to like the post and share with somebody you know who likes to trade EURUSD and other forex pairs. I have some other trade ideas and chart analysis' published, so feel free to check those out on my page. Thank you! Happy trading, and good luck!

BTC/EUR fiber retraction by 0.5if and when the BTC goes to 0.5 (28896 EUR) of retraction in fibo
it will be the beginning of a new cycle of crypto bull markets
and out of curiosity it is in the middle of two supports
34k/24K(EUR)
Pitchfork + Fibo Retraction + Supports
today these are the values but the story changes as new candles form

SOLANA Strong bullish confluence at 171Based on the more prominent parallel channels, fibo and supports, there appears to be a major confluence at 171 where you would expect a bullish bounce. This is only a prediction that may fail, please trade at your own risk.

Weber's Law and Fibonacci Numbers: An Exploratory EssayI use Fibonacci numbers rather frequently. In fact, the Fib retracement tool is the first thing I reach for when I start on a new chart. However, explanations for how Fibonacci numbers work have always sound woolly and mystical to me. They work because "man is subject to rhythmical procedure", because there is a Golden Ratio that is hidden behind all things, because Cthulhu says so?
However, when we take a close hard look at reality, and actually whip out a ruler and measure things, we find that the Fibonacci sequence is *not* found as-is throughout reality. What we do find are *approximations*. However, this is to be expected for approximations of subjects where the rate of growth is proportional to the current size. And this is to be expected because of Weber's Law.
Weber’s law is a psychological law quantifying the perception of change in a given stimulus. The law states that the change in a stimulus that will be just noticeable is a constant ratio of the original stimulus. It has been shown not to hold for extremes of stimulation. And since I will be referencing Mike Cohn's excellent essay (1), I might as well quote his explanation of how Weber's Law apply to Fibonacci numbers:
"Imagine instead being handed a 20kg weight and a 21kg weight. They are the same one kg difference as the one and two kg weights. But you would have a much harder time identifying the heavier of the two weights. The difference from one to two kilograms is 100%. You can probably distinguish the weight of items that differ by 100%. The difference between 20 and 21kg, however, is only 5%. You probably can’t tell the difference. (I know I can’t.) And if you could, it would mean you should be able to distinguish between a 1.00 kg weight and a 1.05 kg weight, as that would also be 5%. The values in the Fibonacci sequence work well because they roughly correspond to Weber’s Law. After the two (which is 100% bigger than one), each number is about 60% larger than the preceding value. According to Weber’s Law, if we can distinguish a 60% difference in effort between two estimates, we can distinguish that same percentage difference between other estimates. So, the Fibonacci values work well because they increase by about the same proportion each time."
So, given that how we think is affected by how we perceive (2), if Weber's Law applies, the Fibonacci retracement tool works for some of us because it allows us to focus our *imagination by visualising discernible and distinct possibilities within a limited range*. This is why the common criticisms of TA, including Fibs, are valid: 1) it is an uncertain business; 2) one cannot consistently identify where levels should be placed and forecasts are prone to revision; 3) its narrative story-telling power may be stronger than its forecasting power; and 4) levels cannot be verified till they have been tested (ie passed). Let's be humble and accept the general validity of these criticisms; for if TA can be an exact science, let he produce an algorithm which could make anyone rich!
That being said, if Weber's Law apply thusly, it simply reaffirms what experience traders often exhort: that it is hard for algorithms to replace (3) the imagination and instincts of an experienced trader!
Having said that, if Weber's Law apply thusly, we ought to 1) pay attention to how other industries, eg Mike Cohn's, have adapted Fibonacci numbers to great success and ask ourselves if our approach to Fibs can be adapted accordingly; and 2) maybe more importantly, reconsider our values, assumptions, beliefs and expectations of those tools we use that are based on Fibs.
(1) www.mountaingoatsoftware.com
(2) www.frontiersin.org
(3) "Replace", not "aid".

GBPUSD wave Analaysis and price prediction(fibo levels)I think one of these routs will work properly.the short trade is more possible.
the prices are spotted on the chart.

Bitcoin - ABC correction -> Target 64kBitcoin - ABC Correction -> Target 64k
We are with 56k strong support. After these declines, we need a rebound and it seems that this is a good time to return to the 64k zone. There is also a CME gap there.

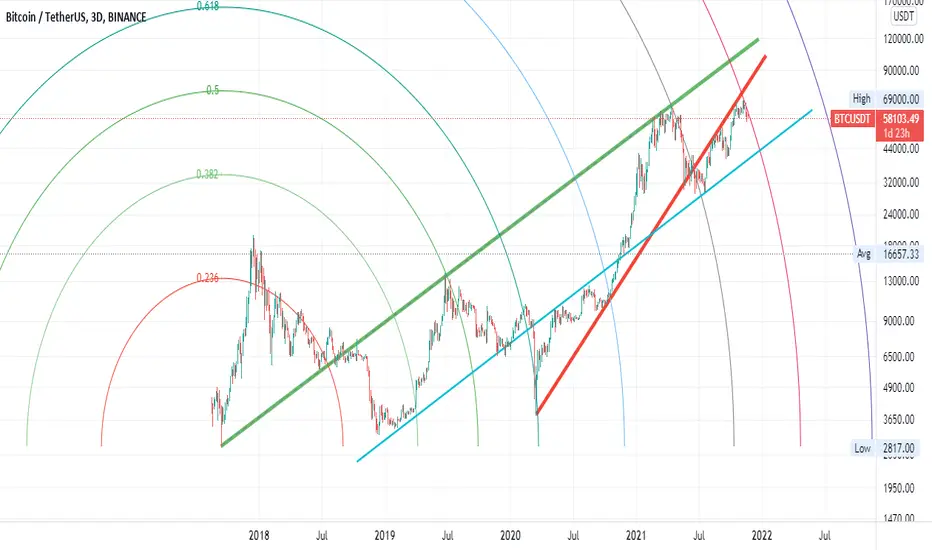
The math of BTCUSD exposed, make it popular to save positionsHi, every one, as you see, BTC is doing its accurate math work, fibo can easily show how the history of BTC is deciding for its current price. You can also see three main trend line of the BTCUSDT, please look deeply to critical points- enjoy your safe trade
BNB - head and shoulder pattern "Head and shoulder" pattern , price can go up to near the blue line ( resistance line ) .
I think it can go up, but check for yourself .

EURUSD Daily Price prediction and best entrances points(BUYSELL)There are 2 most possible setups for EURUSD trade in daily timeframe according to fibo levels.
first scenario is sell after falling under the oriented trendline after valid descending engulfing(or your favourite signal),
and the second scenario is buy trade if the price breaks up the fibo level(0.236) plus valid ascending engulfing (or your favourite signal),
the TPs are spotted on the chart and SLs must be according to your strategy(like previous swing high/low).
welltrade friends!!!


shibainu/usd possible targetsThe most possibility belongs to uptrend so soon and next to the upper level of fibo then a pullback to the lower level and in the final step it will fly to the same distance as the previous uptrend line.the prices are spotted on the chart.

$IMX $immutable x 1Hour #imx$imx $immutable x 1hour
#imx #immutable x
OKEX:IMXUSDT
HUOBI:IMXUSDT
FTX:IMXUSD
UNISWAP:IMXWETH
POLONIEX:IMXUSDT
PANGOLIN:WAVAXIMX.A

Hathor Network $HATHOR $HTR DAILY$HATHOR $HTR DAILY
Two months ago and at 0.5$ the best time to buy $HTR but do not worry again is a great opportunity for better growth of this fundamental coin
@HathorNetwork
Hathor Network - Blockchain Made Easy. about our renewable energy initiative for #Bitcoin mining at Hathor.Green ⛏#HathorNetwork $HTR
hathor.network

Can the tesla fall and by how much???Let's try to see where Tesla's price can drop to. Now the important point is that if there are no more buyers and the price goes over a thousand, then the nearest pivot point according to Fibo, will be 918.5.
For now, we stay out of the market and watch. If you short, then very carefully.
It is better to put a limit order)
❤️ If you find this helpful and want more FREE forecasts in TradingView
. . . . . Please show your support back,
. . . . . . . . Hit the 👍 LIKE button,
. . . . . . . . . . . Drop some feedback below in the comment!
❤️ Your Support is very much 🙏 appreciated!❤️
💎 Want us to help you become a better Stock trader?
Now, It's your turn!
Be sure to leave a comment let us know how do you see this opportunity and forecast.

ethusdt can go upper than 4300$Due to the drawn lines and Fibonacci, eth can move towards the target after breaking the Fibonacci zero line.
The Fibonacci Zero Line is priced at 4002 $.
This analysis is a long-term analysis .
in daily time form .

ETH goes to 4300 for next impulse wave Based on chart, the first low-level impulse wave has done around 3630.
ETH is retracing at 3450 then rally
Wait and see

XLMUSDT Daily AnalyseAs we can see, price stocked in a triangle. We should wait and see what side of triangle will break. I just think we have another corrective wave as WXY (5-3-5) yet. W and X
waves completed and we may have a Y wave. I may be wrong. In case of continuous correction wave, I specified PRZs based on projection and retracement fibonacci for supports. In case of break the top of the triangle we have a resistance PRZ that we should wait for it till its broke and then we can enter a Long Position.
**This is a personal analysis and should not be the basis of your trading.**

XLMUSD Daily AnalyseAs we can see, price stocked in a triangle. We should wait and see what side of triangle will break. I just think we have another corrective wave as WXY (5-3-5) yet. W and X
waves completed and we may have a Y wave. I may be wrong. In case of continuous correction wave, I specified PRZs based on projection and retracement fibonacci for supports. In case of break the top of the triangle we have a resistance PRZ that we should wait for it till its broke and then we can enter a Long Position.
**This is a personal analysis and should not be the basis of your trading.**

NAS100 ANALYSISNasdaq retracing before NY open as expected. Could be seeing the end of Septembers correction this week.

