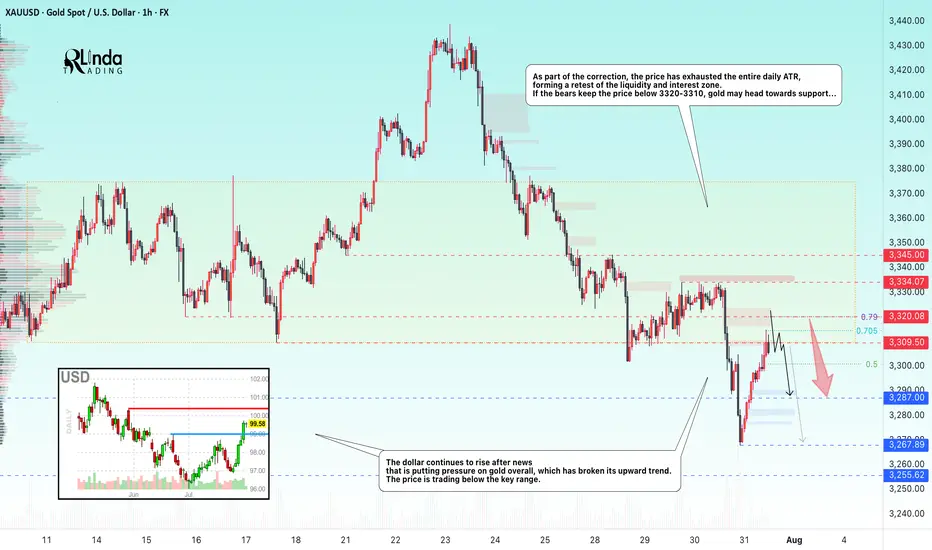
GOLD → Retest of resistance within a bearish runFX:XAUUSD breaks through the upward trend support amid a rallying dollar. Since the opening of the session, the price has been testing the zone of interest, but bears are quite aggressive...
Gold is partially recovering after falling to $3,268, a monthly low caused by the Fed's hawkish tone. The Central Bank kept its rate at 4.25–4.5% (9 votes to 2), highlighting uncertainty due to Trump's tariffs. Markets now estimate the probability of the rate remaining unchanged in September at 58% (previously 35%). The dollar's rise slowed amid concerns about the extension of the US-China trade truce and profit-taking ahead of key US employment data (after strong ADP and GDP reports). The nearest drivers are labor market statistics and trade news, while the technical picture for gold remains bearish.
Technically, on D1, the price is breaking key support zones, including the trend line, which overall only increases selling pressure on the metals market...
Resistance levels: 3310, 3320, 3334
Support levels: 3287, 3267, 3255
As part of the correction, the price has exhausted the entire daily ATR, forming a retest of the liquidity and interest zone. If the bears keep the price below 3320-3310, gold may head towards support...
Best regards, R. Linda!
Fibonacci
GOLD → The market is waiting for NFP. What could happen?FX:XAUUSD is bouncing off resistance at 3310, confirming the upper limit of the new trading range. The dollar continues to rally, but the market as a whole is stagnating ahead of upcoming news—NFP is coming up!
Gold is consolidating at monthly lows around $3268, awaiting key US labor market data (NFP). Trump's new tariffs (10% globally, 35% for Canada, 39% for Switzerland) have boosted demand for the dollar, putting pressure on gold. Markets are waiting for NFP: forecast +110K jobs, unemployment 4.2%. Weak data (<100K) → gold may rise to $3400. Strong (>150K) → the dollar will strengthen, gold will continue to fall. The probability of a Fed rate cut in September is <50%.
Based on yesterday's data, I would cautiously suggest that NFP will be in the range of 125K–145K, slightly above the consensus (110K). This will play into Trump's hands (I think you understand what I mean...).
Resistance levels: 3300, 3310, 3320
Support levels: 3287, 3268, 3255
The news has a negative nuance — unpredictability. Be careful.
Technically, based on the data we have at the moment, I would assume that the market may test resistance at 3300-3310 before a possible pullback to the specified support. BUT! Unpredictable data could turn the game around, and in that case, if the dollar falls, gold could start to rise.
Best regards, R. Linda!

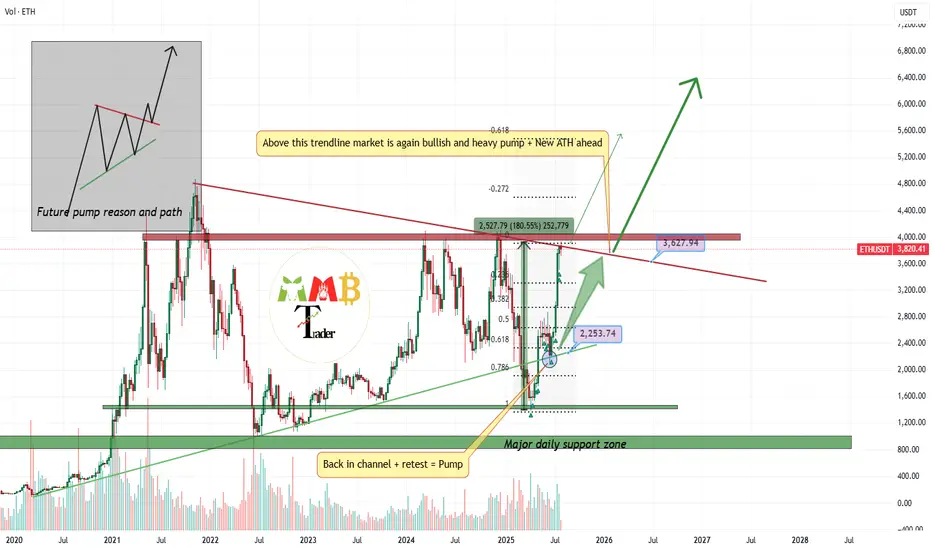
4000$ is last resistance left Ready for breakout and pump?market is still bullish and i am looking for breakout here to the upside for sure But we should consider this factor that major resistance now is touching and we may have first short-term fall.
so for now we may have correction and dump to the targets like 3300$ which is first support of 0.23 Fibonacci level.
and after this healthy correction or without it we can expect more pump and breakout of 4K$ and heavy pump to the targets like 7K$.
DISCLAIMER: ((trade based on your own decision))
<<press like👍 if you enjoy💚
XRPUSDT → Range formation. Retest of resistanceBINANCE:XRPUSDT.P , after a false breakout of the daily resistance level of 3.352 and the elimination of traders, has entered a correction phase. The trading range shown below has been formed, with an emphasis on resistance...
XRP previously formed a false breakout of the daily resistance level of 3.352, as indicated in the idea above. After changing its market character, the price entered a correction phase. Focus on the range of 3.00 - 3.264. A retest of resistance (zone of interest and liquidity) is possible before falling to 3.161, 3.05 or to the liquidity zone of 3.00. There are no technical or fundamental reasons for exiting the consolidation; most likely, a retest of the zone of interest may end in manipulation and a pullback to support...
Resistance levels: 3.1609, 3.264, 3.352
Support levels: 3.05, 3.00
I do not rule out the fact that a retest of the 3.264 resistance level may have a breakout structure and the price will continue to rise, but based on the price behavior pattern on D1, the market structure, and market stagnation, I conclude that at the moment, the chances of seeing a correction from resistance are higher. Further developments will need to be considered after the retest of key zones on the chart...
Best regards, R. Linda!

ZORA 5-Wave Completion — 30% Crash Incoming?After exploding +1150% in just 20 days and completing all 5 waves, ZORA is now consolidating — trading sideways just under the $0.10 psychological level for the past 4 days.
📉 Current Market Structure
The current structure shows signs of a developing Head & Shoulders pattern, with price:
Trading below the daily open (dOpen) and weekly open (wOpen) → Bearish signs
Hovering near the prior daily open (pdOpen) → a breakdown here would confirm bearish continuation
🔴 Short Setup - Bearish Scenario
If ZORA breaks below pdOpen, we’re likely heading for:
0.618 Fib retracement at $0.06137 of the final wave 5
Confluence with 1.272 Trend-Based Fib Extension (TBFE) at $0.06148
This zone marks the next high-probability reaction point and a potential long opportunity if price shows a bounce or reversal.
📉 Overall Short Trade Target
The full retracement target sits between $0.0529 and $0.0514, offering multiple layers of confluence:
0.5 Fib retracement of the full 1150% move
0.786 Fib retracement of the final wave 5
Aligned with an old trading range and daily level
This makes it an ideal demand zone for patient bulls but only once price confirms.
💡 Educational Insight
This setup highlights an example of Elliott Wave Theory in action — after a strong 5-wave impulse move, markets often enter a corrective phase. The completion of wave 5, especially near key psychological levels like $0.10, often marks a local top, where price corrects toward key Fibonacci retracement zones.
Combining wave structure with confluence factors like Fib levels, VWAP, and prior trading ranges helps traders identify high-probability reversal zones — allowing for better timing, risk management, and trade planning. Always wait for confirmation before jumping into any trades.
Summary
Bearish continuation confirmed on pdOpen breakdown
First support zone: $0.0613–$0.0614
Final downside target: $0.0529–$0.0514
Look for long opportunities only on reaction + confirmation
_________________________________
💬 If you found this helpful, drop a like and comment!
Want breakdowns of other charts? Leave your requests below.

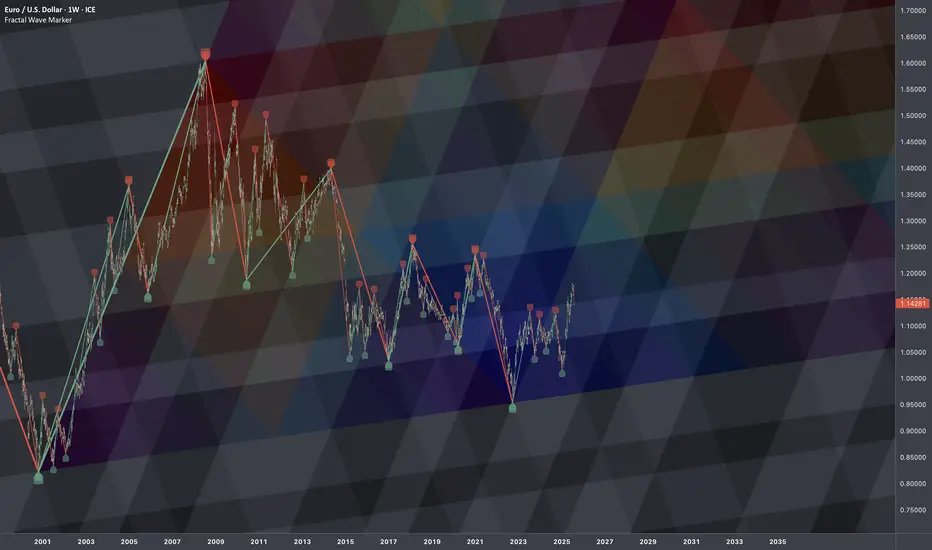
€/$: Fractal Geometry (Cycle 2000-2022)🏛️ Research Notes
Research on order in chaos using scaling laws and math sequences found in nature.
Sierpinski triangle will be used as basic heatmap layer - orienteer for next buildups.
Cross-cycle interconnection 3 cycle knot
Considering the fact that structurally current price is in a new cycle, the core structure which is previous cycle can be extended with another layer that emphasizes phase of the cycle in its angle.
Extended Fibonacci Sierpinski Triangle should look like this:
AUD/JPY LONG AUD/JPY LONG " break of a resistance area and retest it + 38.2% fib retracement + 50 and 200 ema dynamic support + risk on environment "

Those daily +20% to +30% candles soon will appear!!Those Fibonacci levels which are last supports for healthy & #Bullish market are all touching i mean the 0.218$(0.5 #Fibonacci) & 0.202(0.61 #Fibonacci) and i think these supports are strong enough to stop the correction and soon again it will pump and even can break daily high near 0.42$ and hit targets like 0.5$ and 0.75$.
DISCLAIMER: ((trade based on your own decision))
<<press like👍 if you enjoy💚

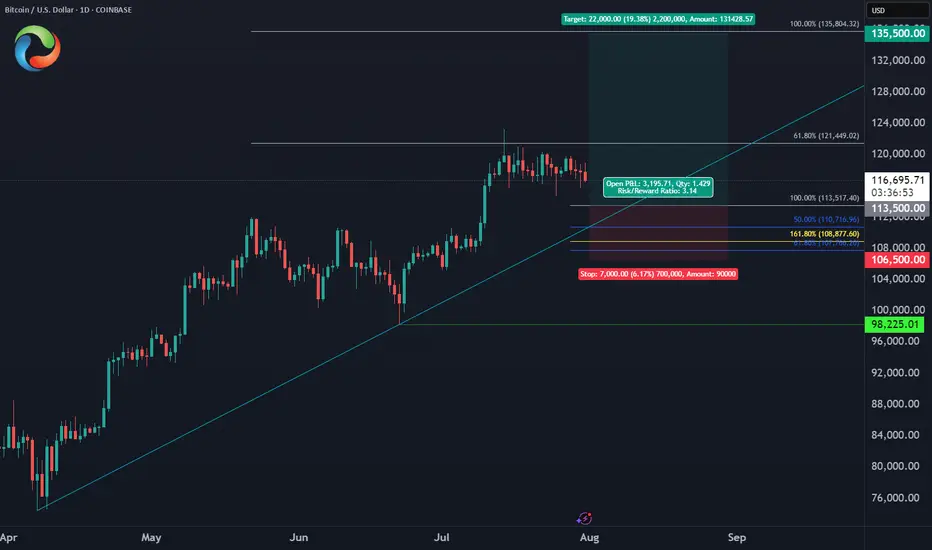
Bitcoin August Trade PlanBINANCE:BTCUSD
✅Entry Zone: $113,500 - $110,700
⛔️Stop: $106,500 (below June low)
🎯Target: $135,500 (ATH liquidity)
🔖Risk/Reward: 1:3
First Monthly Analysis – USDJPYThe USDJPY pair ends the month of July with a strong bullish impulse reaching 150.6, a price area that may signal the exhaustion of the uptrend that has dominated throughout the month.
An ongoing ABC harmonic structure is taking shape, with wave A likely completing between 151.36 and 152.00, which aligns with the 0.618 CD retracement — a confluence that reinforces the zone as a key resistance area.
From there, a potential bearish correction (wave B) may develop, targeting the 145.89 region. If this structure plays out correctly, a final bullish expansion (wave C) could aim for the 157.05 area.
Key Zones for the Week:
Projected exhaustion zone (wave A): 151.36 – 152.00
Expected pullback (wave B): 145.89
Final bullish target (wave C): 157.05
⚠️ Disclaimer
The correction of July’s bullish trend may begin before reaching the expected zone (151.36–152.00) due to liquidity buildup beneath current levels. A premature reversal is possible if institutional players decide to hunt that liquidity before continuing the larger move.
💬 “Sometimes it’s not about if it will get there, but when they let you in. If the party’s heating up above, check if they’re locking the door from below.”
Order Setup (Speculative Idea)
Sell Limit Order
Entry (Open): 151.362
Stop Loss (SL): 152.403
Take Profit (TP): 146.210
Risk–Reward Ratio : 4.79
Use this as a reference setup. Always manage your risk and adapt based on evolving price action

$NVDA: Cycle-Wired Levels🏛️ Research Notes
The fact that the angle of linear connection between 3rd degree points (fractal hierarchy) acted multiple amout of times as support and eventually resistance from which tariff drop happened establishing bottom and expanding from there.
That means if we were to justify the texture of ongoing wave from that bottom, we would geometrically quantify the area of that triangle to project considering historic data to remain objective approach (and NOT what levels we subjectively want to see whether we are bullish or bearish). There is mean reversion rule also going on which will be structurally addressed.
No matter where your actual target is at, there are always structural boundaries that price must break through first in order to get there. And because markets tend to move in proportion to their own scale — often aligning with exponents of the golden ratio, we treat phi as a constant within this probabilistic space.

Today’s Opportunity: Stay Sharp on GBPJPY!Hey friends,
Here's my latest analysis on GBPJPY.
📌 Buy Entry Zone: 197.590 - 197.336
🎯 Target Level: 198.642
📅 Today, major economic data will be released from the U.S.
Make sure to factor this into your fundamental analysis.
📊 It’s not just about the charts—fundamentals matter too.
Technical + Fundamental = Powerful outcomes ✅
💬 Every like and bit of support keeps me going.
Thanks so much to everyone backing this journey! 🙌

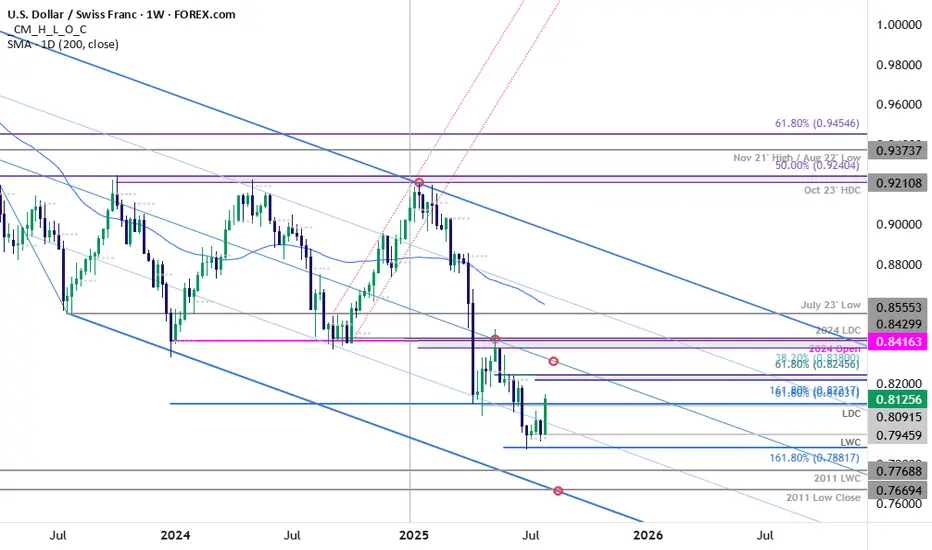
USD/CHF Rally Threatens ReversalThe July opening range broke to the topside on the heels of yesterday’s FOMC rate decision and takes USD/CHF back above the 25% parallel- a weekly close back above the April lows at 8040 tomorrow would suggest a more significant low is in place / a larger reversal is underway. Look for initial support near 8103 today for guidance.
Initial topside resistance objectives eyed at the 1.618% extension of the monthly advance and the 61.8% retracement of the May decline at 8222/46 backed by the median line, currently near the 83-handle. Key lateral resistance stands at 8380-8416- a region defined by the 38.2% retracement of the yearly range, the 2024 low-close, the 2023 low-week close (LWC) and the 2024 yearly open (an area of interest for possible topside exhaustion / price inflection IF reached).
Support rests at the yearly LWC at 7946 with a break / close below 7881 needed to mark resumption of the broader multi-year downtrend. Subsequent support objectives seen at the 2011 LWC at 7769 and the 2011 low-close at 7669.
Bottom line: USD/CHF is threatening a larger reversal within the broader downtrend. From a trading standpoint, losses would need to be limited to 8040 IF price is heading higher on this stretch with weekly close above 8103 on Friday needed to keep the immediate advance viable into the August open.
-MB
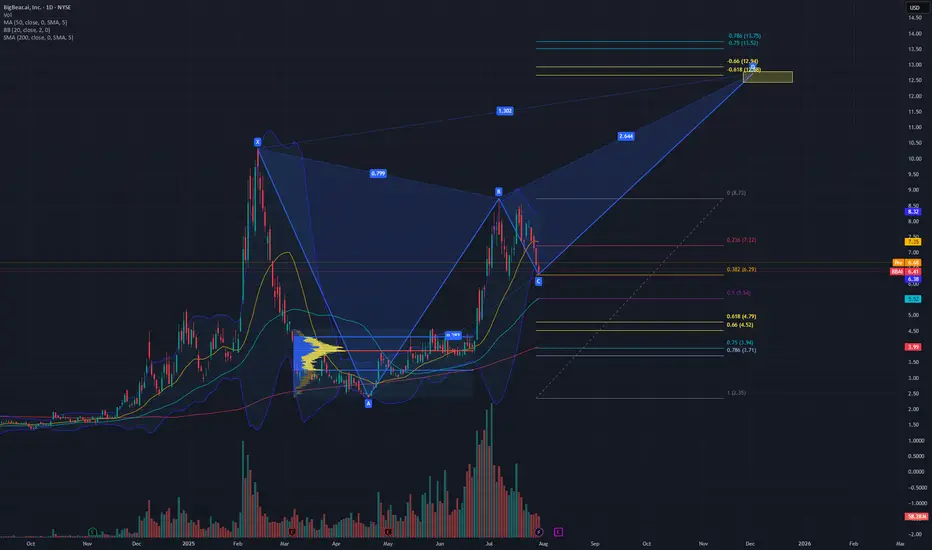
XABCD pattern playing out $12 targetBBAI is looking like it will play out the XABCD butterfly pattern if it continues to rally from the .382 of the pull back from previous $2.35 lows and 8.73 highs.
Breaking down and close below the $6.06 daily candle will potentially expose the previous consolidation POC at $3.87, which is a .75 pull back.
Using Fib time, I am expecting a $12 range around this year in December.
Will look to open a 7/12 bull call spread at Jan 2027 exp.
SP500 → Countertrend correction before growthFX:SPX500 is correcting against an upward trend. In the second half of the week, the market received fairly positive fundamentals during the reporting period.
S&P 500 futures found support after strong reports from Meta and Microsoft, which exceeded earnings expectations and forecasts thanks to AI. The rise in futures supported demand for the “Magnificent Seven” despite Powell's hawkish comments. The focus is on Apple and Amazon reports in the evening, which could strengthen the tech rally. On Friday, we are seeing a countertrend correction in which the market is testing the 6288 zone of interest.
Support levels: 6288.4, 6262.6
Resistance levels: 6342, 6371
Most likely, the market will form a false breakout of support during the correction. If the bulls keep the index above the key level, we can expect continued growth in the short and medium term.
Best regards, R. Linda!

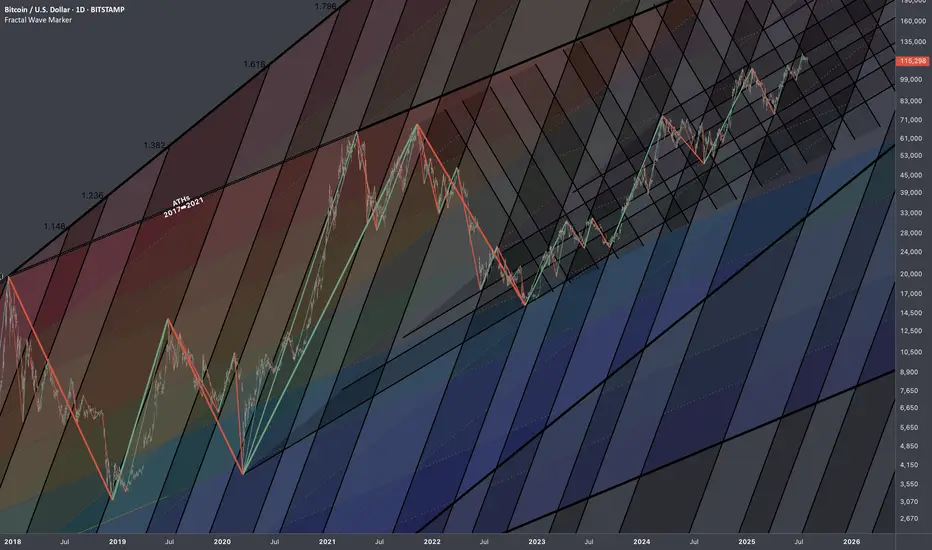
Bitcoin: Interconnections Rewired🏛️ Research Notes
Keeping fib channel of the rising trend angles as they've number of times covered well that aspect of cycle texture.
The other frame of reference would be with fib channel that covers drop from 2021 ATH to late 2022 bottom.
Last bit would be integrating fib channel discovered while ago that connects covid & late 2022 bottoms
Together they create a framework that addresses the complexity and makes even the most chaotic price movements seem to be a part of structural narrative.
ZRX to $1 ZRX is consolidation at the very bottom price, and with alt-season hopefully get a rally to $1

Bitcoin BTC price analysis by the end of 2025🕯 July is coming to an end, with 3 weeks of OKX:BTCUSDT consolidation between $117k–121k.
Tomorrow begins the last month of summer — and it promises to be "hot" as, according to our earlier published calendar Trump's administration plans to send letters with new, increased tariffs to "all countries" on 01.08.
💰 Also, take a look at Bitcoin Monthly Returns. In our view, 2025 resembles 2020 the most.
What do you think?
👉 According to this dynamic, the real "hot" may come not in summer, but late autumn.
💰 We've also tried to find a price fractal for #BTCUSD that fits the current structure — and for now, it looks plausible:
◆ In the coming days, CRYPTOCAP:BTC should not rise above $121k.
◆ A low of correction might hit mid-September around $93k.
◆ A cycle top for #BTC could arrive to the end of 2025, near $147k.
📄 Now that you've seen our version — share your forecasts on future #BTCUSDC price action in the comments 👇
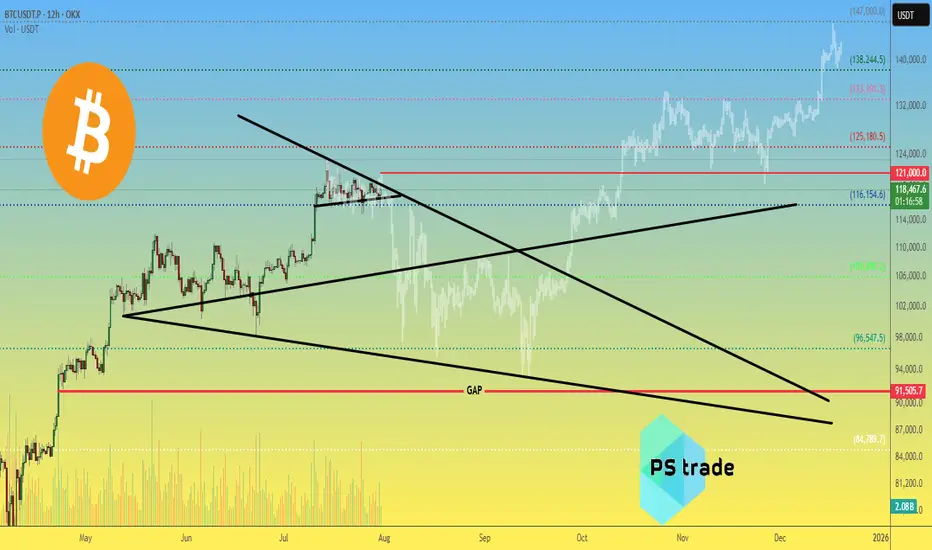
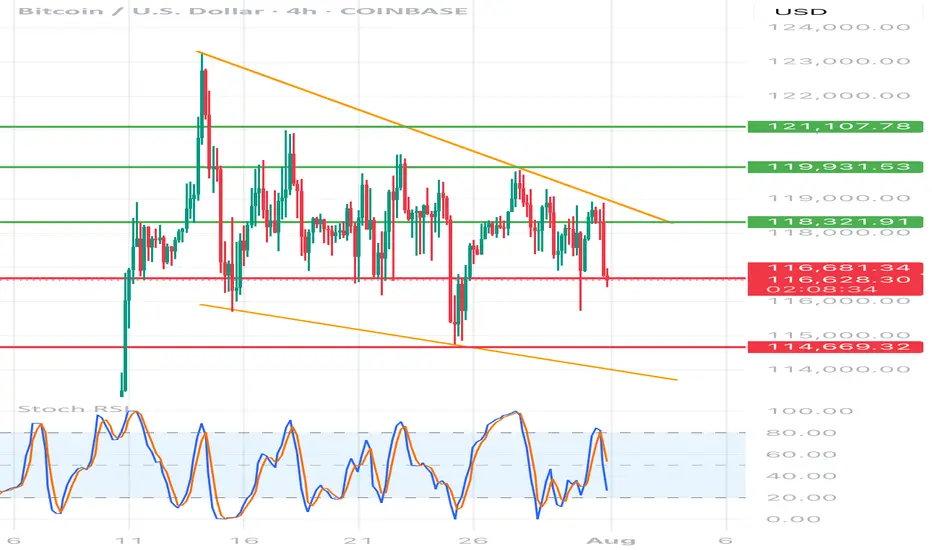
BTC/USD 4h chart🔸 Formation: Triangle descending (descending)
• Upper trend line (orange) - inheritance, connects lower and lower peaks.
• Lower support line (red) - approx. 116,700 USD - key support, tested many times.
🔻 Support
USD 116,700
Tested several times, currently threatened
🔻 Another support
USD 114,669
Target level when struck with a triangle
🔼 Resistance
USD 118,321
The nearest resistance - the former level of support
🔼 Resistance
USD 119,931
Local peak
🔼 Strong resistance
USD 121,107
Upper level of structure
📉 STOCHASTIC RSI (lower indicator)
• Line cutting and a decrease in the purchase area (> 80) towards the center.
• No extreme sales signal, but the trend begins to be negative.
⸻
📌 Applications and possible scenarios:
🔻 Bearish script (more technically likely):
• If BTC breaks below USD 116,700 with a 4H candle closure, possible:
• a decrease around USD 114,669 (lower limit of the triangle)
• Even lower - around 113,500-112,000 USD with an increased volume
🔼 Bullly script (less likely but possible):
• needed quick breaking above USD 118,300 and maintaining above this level
• Then the goal will be USD 119,931, and then possible traffic up to USD 121.107
⸻
📍 Summary:
• We see classic triangle descending-pro-draft formation.
• Support 116,700 USD very close to breaking - if it falls, down movement can be dynamic.
• Stochastic RSI coincides with the deterioration of the moment.
• The inheritance scenario seems dominant, unless there is a strong demand and over 118,300 USD.
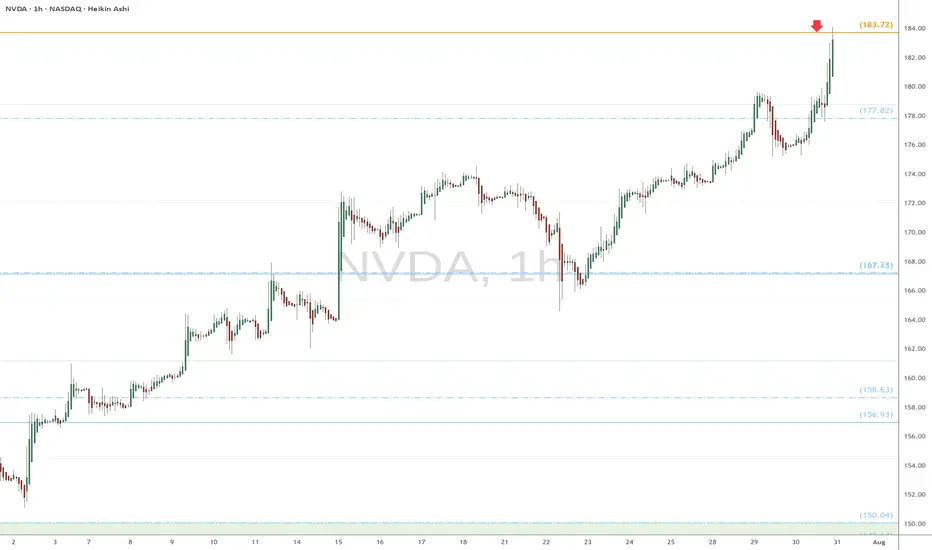
NVDA heads up at $183.72: Golden Genesis fib to mark a TOP?Chips have been flying high since the April lows.
NVDA has just hit a Golden Genesis fib at $183.72
This is a "very high gravity" fib so expect a reaction.
It is PROBABLE that we "orbit" this fib a few times.
It is POSSIBLE that we reject to form a major top.
It is PLAUSIBLE that we Break-n -Retest to continue.\
.
See "Related Publications" for previous EXACT plots ------>>>>>>>>
Such as this post at the last Golden Genesis:
Hit the BOOST and FOLLOW for more such PRECISE and TIMELY charts
============================================================
.
Nasdaq Short: multiple reasonsOver here, I present to you the Nasdaq short idea again. For my previous idea, it was stopped out at 23500. This time, I changed the wave counts again, mainly merging the previous wave 5 into wave 3, allowing for the new high to be a wave 5.
On top of that, here are the few other reasons for the short:
1. Fibonacci extension levels: Wave 5 is slightly more than Wave 1.
2. RSI overbought for the 3rd time on the hourly timeframe.
3. Rising wedge false breakout.
4. Head-and-shoulders on the 1-min timeframe.
As usual, the stop for this idea is slightly above the recent high, around 23700.
Thank you.

AUD/USD Rejected at Resistance-Fed on TapYesterday’s Fed-induced sell-off broke through the monthly opening-range lows / 52-week moving average with the bears now poised to mark a sixth-consecutive daily decline.
It's worth noting that weekly momentum peaked at 60 on the April advance with RSI now poised to close back below 50. The observation suggests the broader downtrend remains intact and a pivot / break below slope support could mark trend resumption.
Initial weekly support is eyed with the February high at 6408 and is backed by the 38.2% retracement of the yearly range / February high-week close (HWC) at 6354/57. A break / daily close below this region would be required to suggest that a more significant high is in place, potentially signaling a larger reversal underway. In such a scenario, the next downside objectives would be the yearly low-week close and 2023 low-close at 6291/96, followed by the 61.8% retracement and 2022 low-close at 6186–6201. Both of these zones are key areas of interest for potential downside exhaustion / price inflection IF reached.
Look for initial resistance back at the 52-week moving average (currently ~6460) with key resistance now seen back at the 61.8% retracement / yearly high-close at 6550/77. Note that the upper parallel converges on this threshold over the next few weeks and further highlights the technical significance of this zone. Ultimately a breach / weekly close above the 2021 trendline (red) would be needed to validate a breakout of the multi-year downtrend in Aussie.
Bottom line: A reversal off downtrend resistance is now approaching initial support- risk for trend resumption heading into August. From a trading standpoint, the immediate focus is on the weekly close with respect to 6400- rallies should be limited to the 52-week moving average IF Aussie is heading lower on this stretch with a close below needed to keep the immediate short-bias viable heading into the monthly cross.
Keep in mind we get the release of key US employment data tomorrow with Non-Farm Payrolls on tap. Stay nimble into the release and watch the weekly close / August opening-range for guidance for guidance.
-MB
EURUSD - correction ahead of timeWell, well - EUR used the NFP data to start the correction ahead of time. It used the FR 161.8 of the recent correction as support. And it did it in a impressive time...
Now we are heading into Resistance cluster created by the April High and July Low (as wee and FR 38.8 of the whole movement form the July High. Yet the upper level of the cluster is created by the FR 61.8 of the recent impulse, and 1:1 with the recent correction and June High. The second one seems to me as stronger and more probably. However, price may be in hurry again and complete the correction ahead of time... Again.
Just my humble opinion...
