MRVL watch $64.40/43: proven Double Fib holding up the recovery MRVL trying to recover with the chip sector.
Up against a proven Double Fib at $64.40/43.
Look for a Dip-to-Fib or Break-n-Retest entry.
Fibonacci

XAU/USD (GOLD) – Potential Bullish Continuation After ConvergenOn the 1H chart, we are currently observing a potential bullish continuation setup forming on XAU/USD. Here’s a detailed breakdown:
🔍 1. AO Bullish Convergence
The Awesome Oscillator (AO) shows a clear bullish convergence, suggesting momentum is building in favor of the bulls. This typically signals a potential continuation of the uptrend, especially when paired with structural confirmations.
🌀 2. Elliott Wave Count
Wave 1, 2, and 3 are already established on the chart.
Price is currently retracing, potentially forming Wave 4, with Wave 5 yet to be completed.
The retracement aligns with classic Fibonacci levels, with a potential bounce zone forming at the 1.618 fib extension near 3330–3327, which also acts as a strong SNR zone (support now after previous resistance).
📊 3. Break of Structure (BOS)
A clear Break of Structure (3351) confirms bullish intent after wave 3.
Price retracement toward the 1.618 zone could present a buying opportunity, as long as this level holds.
🧭 4. Entry Strategy
✅ Buy Bias:
Watching for price to enter 3330–3327 zone (1.618 fib + SNR zone).
Confirmation needed: Look for another BOS within this zone before entering long.
If BOS forms inside this area, we can anticipate a continuation into Wave 5 toward the 3,375 and beyond.
❌ Invalidation:
Setup will be considered invalid if price breaks and closes below the 1.618 zone (3327).
This would invalidate Wave 4 support and could signal a deeper correction or trend reversal.
🎯 Target Projection:
If the setup holds, potential Wave 5 target is projected toward the top zone near 3,410–3,420, based on fib extension and previous price action.
📌 Conclusion:
This is a classic bullish Elliott Wave continuation setup backed by AO convergence and structural confluences. Patience is key—wait for BOS confirmation at the 1.618 zone before entering. Always manage risk, especially near fib extension zones.
📅 Published on: July 14, 2025
📍 Timeframe: 1H
💬 Feel free to share your thoughts or setups below. Trade safe!

MOB eyes on $3.57: Break should POP and run OR Double TopMOB with a nice recovery from much needed retrace.
Once again testing the proven Golden Genesis fib at $3.57
If/when it breaks it should be a quick pop and then some.

Bitcoin hits second target MacroBitcoin just hits second target, Volume is getting smaller, could indicate that buyers are weakening. We should keep an eye, maybe a corection is soon to be seen.
GOLD BULLISH IDEAClearly, market did a breakout in bullish flag pattern. So we can wait for retracement 3296 at leftshoulder of the structure to entry long if any breakout happens.. Target 3418 as you can see FIBO level 4.236

NASDAQ Potential DownsidesHey Traders, in today's trading we are monitoring NAS100 for a selling opportunity around 22,800 zone, NASDAQ is trading in a downtrend and currently is in a correction phase in which it is approaching the trend at 22,800 support and resistance area.
Trade safe, Joe.

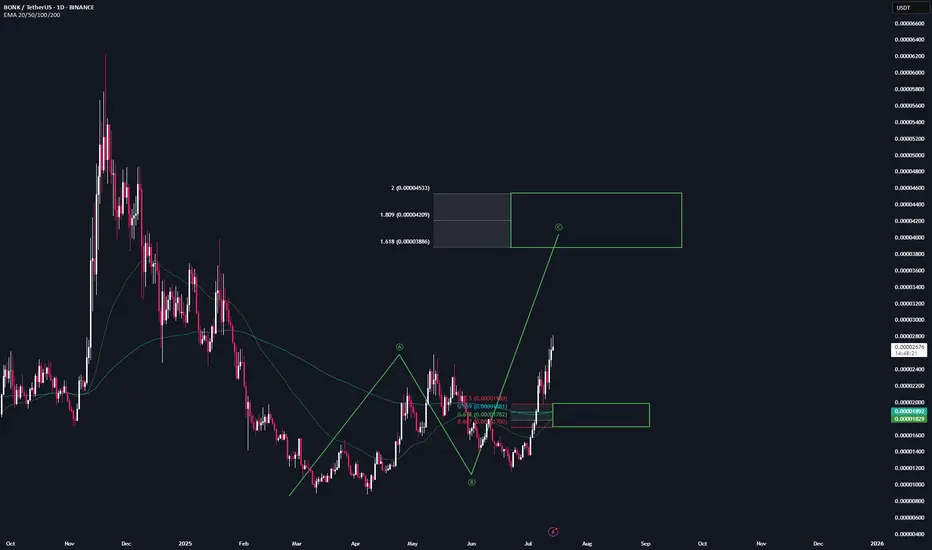
BONK | Trade Setup📌 After the breakout from the last high, a bullish sequence (green) has now been activated.
📊 These setups typically occur no more than twice per year on any given altcoin, so I’ll be aggressively buying each level at the B-C retracement area.
Trademanagement:
- I'm placing long orders at each level. ((If the price continues climbing, I’ll adjust the trend reversal level (green) accordingly and update my limit orders.)
- Once the trade reaches a 2 R/R, I’ll move the stop-loss to break-even.
- From a 3 R/R onward, I’ll start locking in profits.
✅ I welcome every correction from here on —
but I won’t enter any new positions at these top levels.
Stay safe & lets make money
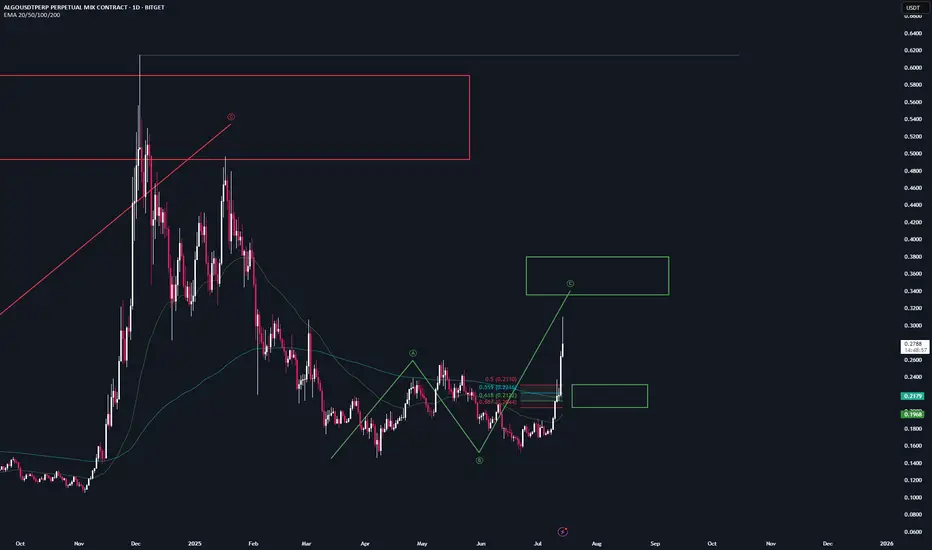
Algo |Trade Setup📌 After the breakout from the last high at $0.26, a bullish sequence (green) has now been activated.
📊 These setups typically occur no more than twice per year on any given altcoin, so I’ll be aggressively buying each level at the B-C retracement area.
Trademanagement:
- I'm placing long orders at each level. ((If the price continues climbing, I’ll adjust the trend reversal level (green) accordingly and update my limit orders.)
- Once the trade reaches a 2 R/R, I’ll move the stop-loss to break-even.
- From a 3 R/R onward, I’ll start locking in profits.
✅ I welcome every correction from here on —
but I won’t enter any new positions at these top levels.
Stay safe & lets make money
Hbar |Trade Setup📌 After the breakout from the last high at $0.23, a bullish sequence (green) has now been activated.
📊 These setups typically occur no more than twice per year on any given altcoin, so I’ll be aggressively buying each level at the B-C retracement area.
Trademanagement:
- I'm placing long orders at each level. ((If the price continues climbing, I’ll adjust the trend reversal level (green) accordingly and update my limit orders.)
- Once the trade reaches a 2 R/R, I’ll move the stop-loss to break-even.
- From a 3 R/R onward, I’ll start locking in profits.
✅ I welcome every correction from here on —
but I won’t enter any new positions at these top levels.
Stay safe & lets make money

XRP | Trade Setup📌 After the breakout from the last high at 2.6, a bullish sequence (green) has now been activated.
📊 These setups typically occur no more than twice per year on any given altcoin, so I’ll be aggressively buying each level at the B-C retracement area.
Trademanagement:
- I'm placing long orders at each level. ((If the price continues climbing, I’ll adjust the trend reversal level (green) accordingly and update my limit orders.)
- Once the trade reaches a 2 R/R, I’ll move the stop-loss to break-even.
- From a 3 R/R onward, I’ll start locking in profits.
✅ I welcome every correction from here on —
but I won’t enter any new positions at these top levels.
Stay safe & lets make money

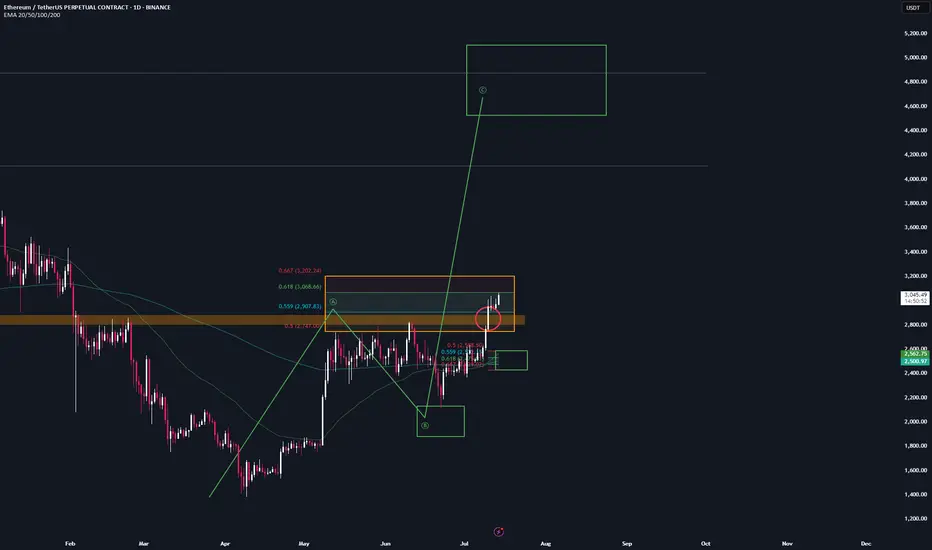
ETH - Trade setup📌 After the breakout from the last high at 2.9k, a bullish sequence (green) has now been activated.
📊 These setups typically occur no more than twice per year on any given altcoin, so I’ll be aggressively buying each level at the B-C retracement area.
Trademanagement:
- I'm placing long orders at each level. ((If the price continues climbing, I’ll adjust the trend reversal level (green) accordingly and update my limit orders.)
- Once the trade reaches a 2 R/R, I’ll move the stop-loss to break-even.
- From a 3 R/R onward, I’ll start locking in profits.
✅ I welcome every correction from here on —
but I won’t enter any new positions at these top levels.
Stay safe & lets make money
GBPUSD → Correction amid a global bullish trend...FX:GBPUSD is testing the 1.345 - 1.35 area as part of a correction. The price is closing the imbalance zone and testing support, which may trigger a reaction. Further developments will largely depend on the dollar, which is testing resistance.
The daily market structure is quite strong. The correction against the backdrop of a strong trend is within acceptable limits, and bulls should fight to keep the price away from risk zones. GBPUSD, as part of the correction, closes the imbalance zone of 1.34 - 1.35 (0.7 - 0.79f) and forms a false breakdown of the intermediate support level of 1.3476. If buyers hold their ground in the 1.347-1.35 zone, the currency pair will be able to return to the global trend.
Support levels: 1.3476, 1.345, 1.3382
Resistance levels: 1.3511, 1.359, 1.375
Price consolidation above 1.349 - 1.350 will confirm the market's intentions. In this case, we can expect growth to 1.36 - 1.374.
Best regards, R. Linda!

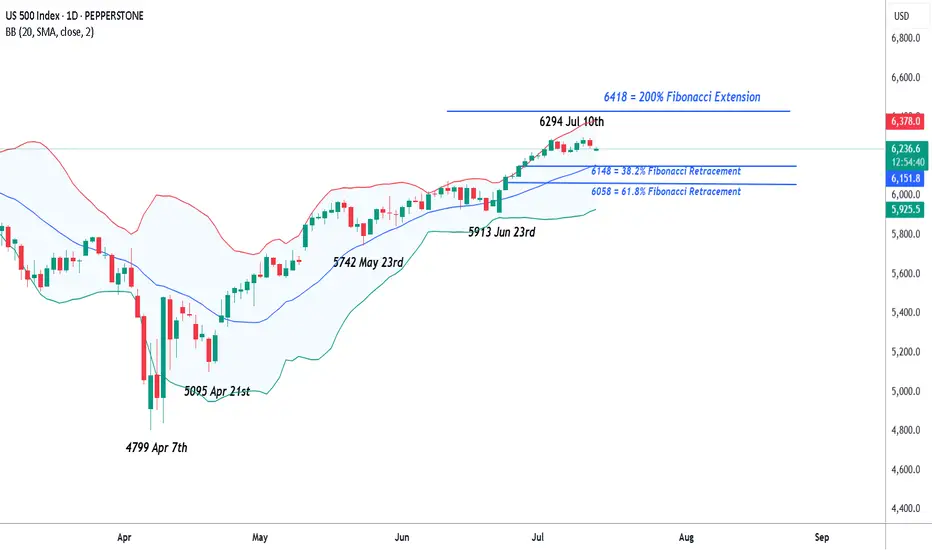
US 500 – A New Record Peak or Reversal in the Week AheadSo far in July, the US 500 has recorded multiple all-time highs on its way to an eventual peak of 6294 on Thursday (July 10th), from which it finally succumbed to some profit taking into the weekend, leading to a small Friday sell off to close at 6255 (-0.4%).
Along the way traders have ignored mixed US economic data, and more importantly they have, for the most part, shrugged off President Trump’s increasingly aggressive approach to tariffs, choosing instead to focus on economic resilience, renewed AI optimism and an improving outlook for the Q2 corporate earnings season that kicks fully into gear in the coming days.
In terms of tariffs, the fact that there is now a new August 1st deadline to concentrate on may be taking away some of the immediate urgency for the announcement of trade deals, although these issues still remain important and on-going, highlighted by President Trump's weekend social media announcement of 30% tariffs on the EU and Mexico, if a better deal cant be reached in the next 3 weeks.
With regard to corporate earnings, the major US banks like JP Morgan (Tuesday before the open) and Bank of America (Wednesday before the open) report this week. Both company’s share prices have seen strong gains since the April lows, so traders will be eagerly awaiting their actual numbers. They will also be keen to hear the thoughts of the bank CEOs on future earnings, bad debt provisions and the potential impact of Trump’s tariffs on the US economy moving forward. Only last week, Jamie Dimon, CEO of JP Morgan, warned market complacency towards potential tariff risks.
In terms of scheduled economic data. Tuesday’s US CPI (1330 BST) and Wednesday’s PPI release (1330 BST) stand out. Traders are sensitive to US inflation updates and have been watching over the last several months for signs that tariffs are pushing up prices. So far this hasn’t been the case but these new releases may tell a different story.
All of these issues could impact risk sentiment and the direction of the US 500 index in the next 5 trading days. Certainly, the early open has been impacted by President Trump's weekend tariff announcement, with the US 500 currently down 0.46% at 6227 (0800 BST).
The technical outlook could also be an important factor in determining price moves.
Technical Update: Assessing the Move to A New Record High
Last week appears to have seen a slowing in the speed of the recent price strength, but a new all-time high was still posted at 6294 on Thursday. It could be argued that this activity maintains what is still a more constructive pattern of higher price highs and higher price lows that have materialised since the April 7th downside extreme of 4799.
However, there is no guarantee this price activity will continue to see new all-time highs posted, so we need to be aware of potential support and resistance levels that may influence price activity.
Possible Support Levels:
If last week’s possible slowing in upside price momentum develops into a new phase of price weakness, a support level that traders might now be watching could be 6148.
This 6148 level is equal to both the 38.2% Fibonacci retracement of June 23rd to July 10th strength and the current level of the rising Bollinger mid-average. Closes below 6148 might suggest a more extended phase of weakness back to 6058, the lower 61.8% Fibonacci retracement, possibly further if this in turn gives way.
Possible Resistance Levels:
Having been capped by the 6294 all-time high last week, sellers may continue to be found at this level, so this might prove to be the first potential resistance if fresh attempts at price strength over the coming week develop.
Closing defence of 6294 may need to be watched if challenged, as successful breaks above this level might suggest an extension of the uptrend pattern currently evident in price activity. Such closing breaks higher may well suggest price strength towards 6418, the 200% Fibonacci extension level of the recent price decline.
The material provided here has not been prepared accordance with legal requirements designed to promote the independence of investment research and as such is considered to be a marketing communication. Whilst it is not subject to any prohibition on dealing ahead of the dissemination of investment research, we will not seek to take any advantage before providing it to our clients.
Pepperstone doesn’t represent that the material provided here is accurate, current or complete, and therefore shouldn’t be relied upon as such. The information, whether from a third party or not, isn’t to be considered as a recommendation; or an offer to buy or sell; or the solicitation of an offer to buy or sell any security, financial product or instrument; or to participate in any particular trading strategy. It does not take into account readers’ financial situation or investment objectives. We advise any readers of this content to seek their own advice. Without the approval of Pepperstone, reproduction or redistribution of this information isn’t permitted.
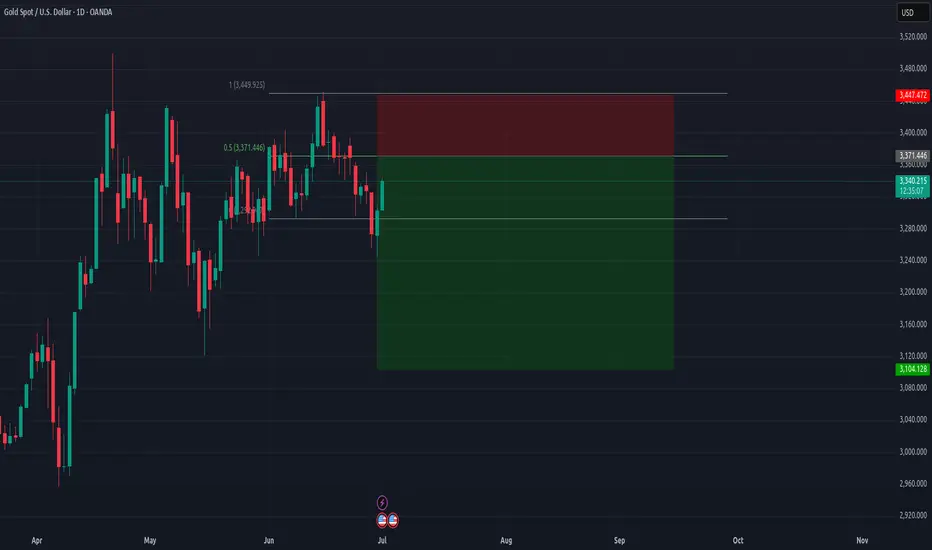
GOLD LONG TERMGold made a good push from 3250 and back up over 1000 pips.
Additionally, a break above 3340 failed, making a lower low below, opening up opportunity for further drops.
Also a perfect equal lows at 3250. Let's see if price sets up retracement sells from 3360-70 zone.
Volatile Times for GBPJPY: What’s Going On Behind the Moves?Good morning, Guys,
I’m anticipating a new short opportunity on GBPJPY once the pair reaches my sell zone level. From there, my target is set at 197.934.
Every like from you is what truly motivates me to keep sharing these insights.
Massive thanks to everyone who shows love and support!

LONG - GBP/USDPrice has already reached my third reversal line and this is where I can expect to price to close above the reversal line to hint a possible change in the direction of the trend.
Currently right now I am waiting for the price to show me a bullish reversal candle for the price to give me confluence to possible change of trend.
I am still bias with the trend moving upwards base on the market structure given by the price action.
However I will not consider the 4th Key Point Market Structure as HL if it breaks the previous structure.
Entry - 1.34683
Stop Loss - 1.33704
Take Profit - 1.36002

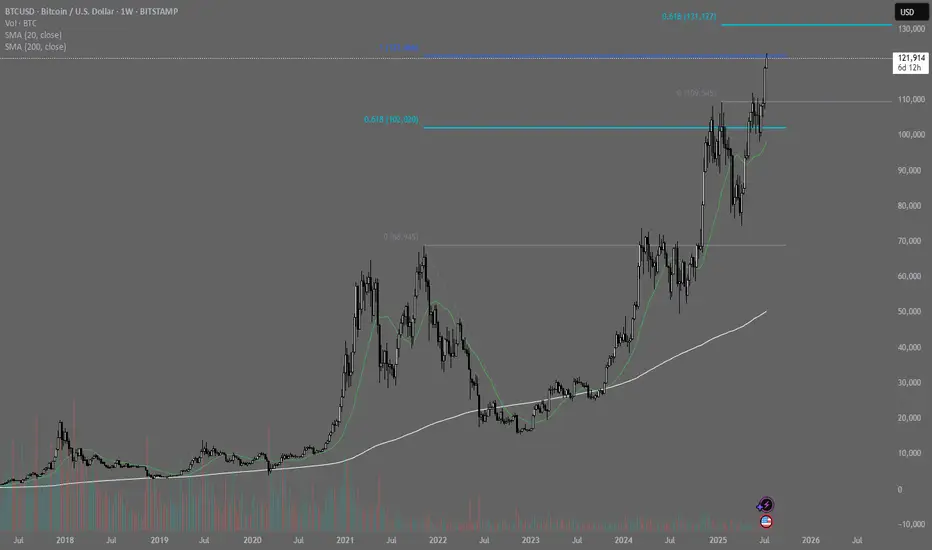
BITCOIN → Stopping after the rally? What next? 125K or 110K?BINANCE:BTCUSDT rose and updated its historical maximum to a new record of 118K with “kopecks” (different prices on different exchanges). Now the price has supposedly stopped and entered a consolidation phase, but it is too early to draw any conclusions based on this alone...
Fundamentally, Bitcoin rose following the SP500 and NQ100 indices. The reasons are clearly geopolitical. The correlation level is not high, but the flagship is following the stock indices, which are also updating their historical highs.
Technically, Bitcoin has emerged from a two-month consolidation and entered a realization phase. So what's next? Continuation of the phase or correction? Let's take a look.
On the daily chart, I would highlight two zones. The risk and sell zone is below 117,500. If the price closes below this zone today/tomorrow, we will most likely be able to look for signals for a possible correction. As part of the correction, we can expect a decline to 115,500, 114,300, or even to the old ATH of 112K.
The second zone is the buying zone. A closing price above 118,400–118,900 and consolidation with the gradual formation of a breakout of structure may hint at a possible continuation of growth toward psychological targets.
Resistance levels: 118,400, 118900
Support levels: 117100, 116700, 115500
In the chart above, I have highlighted the situations, levels, and zones that interest me more precisely.
Now I am waiting for Bitcoin to retest resistance or support and confirm certain levels, based on which decisions can be made. I think that in the near future, Bitcoin will show us where it is headed. Updates will be published as something interesting emerges...
Best regards, R. Linda!

BTC Breakout is Real Flag Playing Out with Wave 3 MomentumBitcoin is looking really clean here. After weeks of sideways grind inside what looked like a consolidation trap, the structure has finally matured into something meaningful, a classic bullish flag breakout layered inside a broader Elliott Wave count.
What really stands out is how the flag structure (B → C) formed a smooth pullback after the strong A → B impulse. That was the pole. Now we’ve broken out of the flag, and momentum is picking up again, likely heading into wave (3) of the new leg pointing towards D.
This isn’t just about a flag the entire move is developing inside a wide ascending channel, and price is following it almost perfectly. The bullish momentum coming off the breakout zone is clean, no choppiness just strong candles and impulsive drive.
We might get a short-term breather (sub-wave 4 of current wave 3), but structure suggests more upside is likely as long as price holds above that $113K–$115K zone.
What I'm Watching Right now:
Support zone: $113K – $115K
Short-term target: $123-$127K
Final projection (if channel holds): $140K–$145K
Measured move from the flag and wave count both point up there, so I’ll be watching for minor pullbacks as entry opportunities.
Personal Take
I like when patterns align naturally not forced. This one’s got that nice blend of momentum, structure, and price behavior. I’m not rushing entries here, but will scale into dips if price holds support and volume confirms.
Have you spotted this setup on your end too? Drop your view in the comments always keen to see how others are reading this.
Follow for clean, no hype market breakdowns.

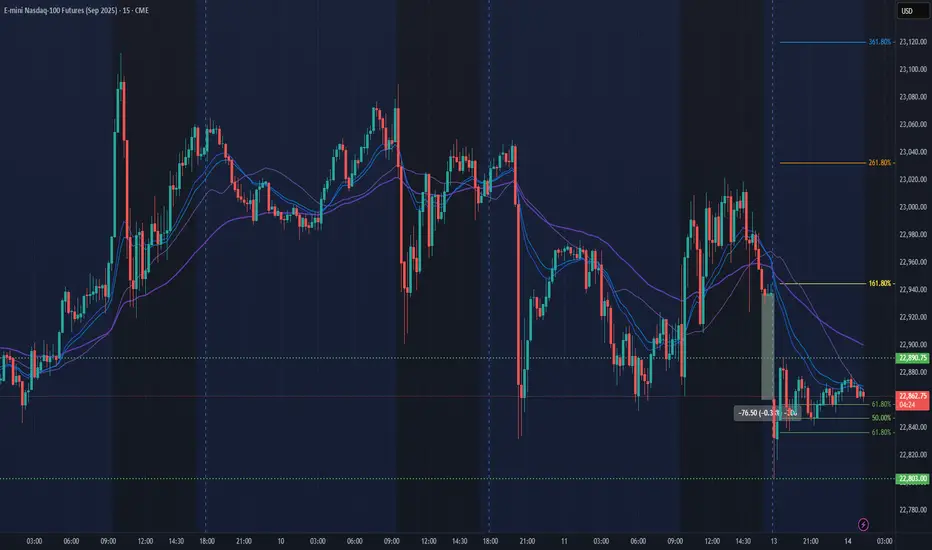
NQ Power Range Report with FIB Ext - 7/14/2025 SessionCME_MINI:NQU2025
- PR High: 22890.50
- PR Low: 22803.00
- NZ Spread: 195.0
No key scheduled economic events
0.33% weekend gap to previous week low, unfilled
Session Open Stats (As of 1:15 AM 7/14)
- Session Open ATR: 289.88
- Volume: 36K
- Open Int: 270K
- Trend Grade: Neutral
- From BA ATH: -1.0% (Rounded)
Key Levels (Rounded - Think of these as ranges)
- Long: 23239
- Mid: 21525
- Short: 20383
Keep in mind this is not speculation or a prediction. Only a report of the Power Range with Fib extensions for target hunting. Do your DD! You determine your risk tolerance. You are fully capable of making your own decisions.
BA: Back Adjusted
BuZ/BeZ: Bull Zone / Bear Zone
NZ: Neutral Zone
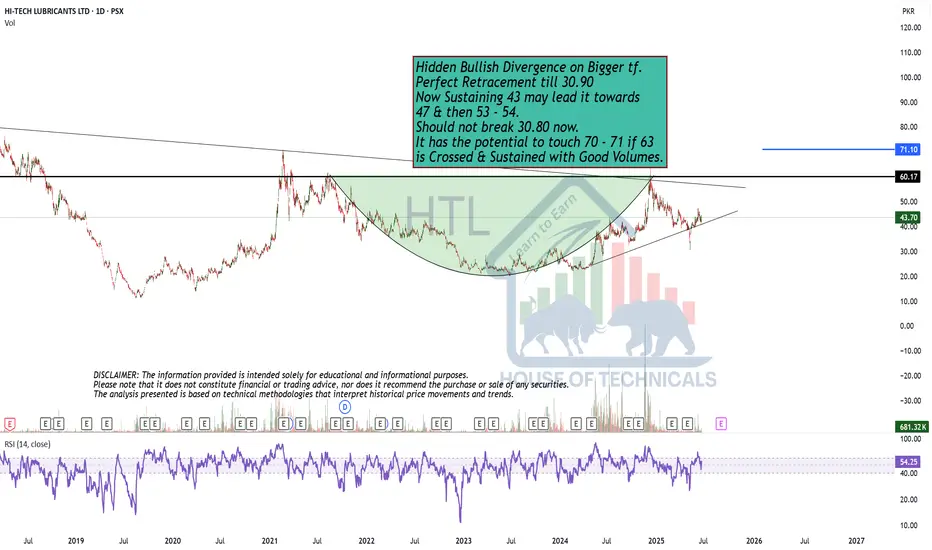
Perfect Retracement till 30.90Hidden Bullish Divergence on Bigger tf.
Perfect Retracement till 30.90
Now Sustaining 43 may lead it towards
47 & then 53 - 54.
Should not break 30.80 now.
It has the potential to touch 70 - 71 if 63
is Crossed & Sustained with Good Volumes.
GBPUSD SELL After seeing the previous weekly candle close bearish and the daily trading below the moving average and 4hr structure pointing to the down side we could see a continuation of the move to the downside into next areas of weekly support

MMM eyes on $140: Key Support that bulls MUST hold for next leg MMM trying to recover and last Earnings were good.
Currently testing a proven zone at $140.06-140.37
Bounce here would Target zone at $147.90-148.35

EAT eyes on $134: Earnings Dump fell into a key support to buy?EAT earnings report was apparently pretty bad.
Fell through several supports but trying to hold.
Watch critical and proven zone at $134.06-134.77
