SEIUSDT on the Brink of a Major Explosion… or Total Breakdown?Yello Paradisers! Are you prepared to act with precision—or will you get trapped like the rest before the real move begins? #SEI has entered a highly reactive price zone where one wrong candle could invalidate the entire bullish structure. The market is whispering its next move, but only those who understand structure and timing will be ready to capitalize.
💎#SEIUSDT has completed a significant transition from a bearish trend structure to a more bullish one. Earlier, the price formed consecutive Lower Lows (LL) and Lower Highs (LH), confirming bearish momentum. However, that trend shifted once the market printed a Market Structure Break (MSB) around the 0.2121–0.2253 range. This area—previously acting as resistance—has now flipped into a confirmed support zone, marking a critical bullish development.
💎The structure strengthened further when SEI broke above the prior Higher High (HH) and created a Break of Structure (BOS). That move catapulted price into the red resistance zone between 0.2929 and 0.3152, just beneath the last major swing high at 0.3471. This zone is now acting as a ceiling, containing bullish pressure—but the underlying structure remains intact unless we see an invalidation close below key levels.
💎High probability, SEI i retracing back into the 0.618 Fibonacci level at 0.2269, which aligns precisely with the flipped support zone. This is a textbook bullish retest, and as long as the price holds above 0.2121, the probability for continuation remains high. The coming candles will be decisive: they will either confirm strength and fuel continuation—or fail and lead to a complete structure breakdown.
💎If buyers manage to hold the key support zone between 0.2269 and 0.2121, the probability of a bullish continuation increases significantly. The first major target on the upside is 0.3471, which marks the previous swing high and is likely to act as the initial area of resistance. A clean break above that level could open the path toward 0.3812, followed by 0.4086, both of which align with higher timeframe supply zones and represent strong historical resistance. These levels are expected to attract profit-taking and short-term volatility, making them critical decision points for continuation or rejection in the next phase of SEI’s move.
💎However, traders must be alert: any candle close below 0.1554 will serve as a hard invalidation level for this bullish thesis. If that happens, the structure flips bearish, and we would anticipate a deeper correction toward 0.1361 or even lower. That’s the line we are not willing to ignore—structure and discipline come first.
This is not the time to trade emotionally, Paradisers . Retail traders will act impulsively—either FOMOing at the highs or panic-selling at the lows. The smart move here is to observe how price reacts and only execute if there’s clear confirmation and structure support. No guessing. No gambling.
MyCryptoParadise
iFeel the success🌴
Fibonacci

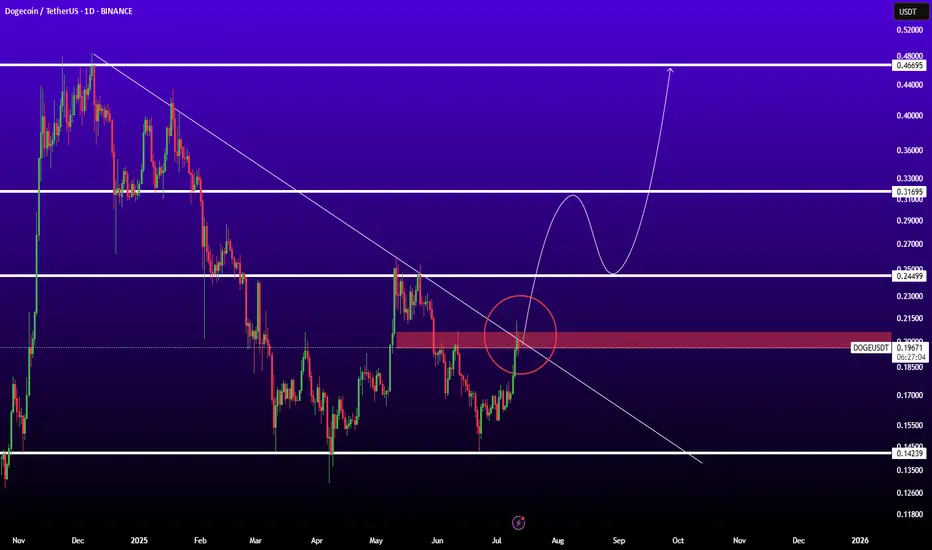
DOGEUSDTBINANCE:DOGEUSDT is in good level for pump because if breaked trendline and resistance 0.200$ ready for sharp movement to next levels.
Resistances: 0.25 - 0.32 - 0.45
Support: 0.15
How "Whales" Manipulate Markets: A Trader's Guide to SucceedEvery chart tells a story of institutional footprints. For most, it's chaotic noise. But when you understand the market's true engine — the constant need of "Smart Money" to capture vast amounts of liquidity to fill their orders — that noise turns into a clear map.
This guide will teach you to read that map. We will break down the main types of manipulation and show you how to use them to identify high-probability zones for potential entries.
So, why exactly is liquidity the fuel for these "Smart Money" players, which for simplicity, we'll call "Whales"? It's because a Whale holds the largest volume of funds in a specific asset and, unlike retail traders like us, it cannot open its huge position at any given moment simply because there aren't enough buy or sell offers on the market.
To fill its orders, the Whale constantly carries out manipulations to capture additional liquidity. This isn't about deception or anything negative—it's how the market constantly forms its movements, how whales achieve their goals by moving from one liquidity pool to another, much like whales in the ocean hunt for plankton to get vital energy for long journeys from one feeding ground to another.
Why will these principles of price movement through manipulation, which worked decades ago, continue to work forever? Because human nature doesn't change over time. The crowd is always driven by greed and fear, making it easy to manipulate. Therefore, manipulation is often the motive for the birth of a future move and is a key element in market mechanics. If you understand these mechanics, you will be able to see the footprints of whales on any chart and not only minimize your chances of becoming their food but also join their next move to get your share of the profit in the boundless ocean of market opportunities.
Let's take a closer look at how whales carry out their manipulations and classify their types.
The Whale is constantly in hedged positions. To fill its large-sum orders without impacting the price, it uses the principles of Sell to Buy (STB) and Buy to Sell (BTS) .
The STB manipulation is used to accumulate long positions. To do this, the Whale opens an opposing short position, activating stop orders and liquidations of buyers, purchasing their positions at a favorable price. It also encourages other retail participants, especially breakout traders, to open short positions. Continuing to accumulate long positions, the Whale sharply moves the price up, liquidating short participants and absorbing their positions. After the price has moved up, the Whale is left with an open losing position from its short manipulation. To close it at breakeven or a small loss, the Whale needs to return the price back to the zone of its manipulation. This return is called mitigation .
In the opposite case, when the Whale needs to drive an asset's price down, it uses the BTS manipulation . To fill its short positions, the Whale opens a long position, activating stop-losses and forced liquidations of sellers, and encouraging retail breakout traders to also open long positions. Continuing to accumulate short positions, the Whale aggressively moves the price down, absorbing and liquidating the positions of impatient longs. After the downward impulse is complete, the Whale is left with an open losing long position. Just as in the first case, to close it at zero or a small loss, the Whale needs to return the price to the manipulation zone, after which another markdown of the asset occurs, and the cycle can be repeated as many times as necessary.
Thus, through manipulation, the Whale achieves two goals at once:
It gets the most favorable price.
It eliminates most of its competitors by liquidating their positions with an opposing move.
Most of the time, the price movement between manipulations is unpredictable. Entering during this movement, for example, in the middle or end of an impulse or within a range, increases the chances that you will become a victim of the next manipulation and liquidity for the Whale. However, if you wait for the price to arrive at the manipulation zone, also known as a Point of Interest (POI) , and ensure that the Whale acknowledges this area (i.e., it has stopped there and is beginning a reversal), the probability of choosing the correct direction for a trade will be on your side.
To help you recognize manipulation zones, let's look at their different types.
🔹 Order Block (OB) - A down candle (sometimes 2, rarely 3 candles) before an impulsive move up (in the case of a bullish OB), or an up candle (sometimes 2, rarely 3 candles) before an impulsive move down (in the case of a bearish OB). In most cases, this short, sharp move should sweep some form of significant liquidity. An additional confirmation of an Order Block is the immediate imbalance or Fair Value Gap (FVG) that follows it, because the Whale's intensive position accumulation and the associated impulse move don't allow enough time for all market participants' orders to be filled.
🔹 Demand/Supply Zones are similar in principle to Order Blocks but differ in that they have a more prolonged action, which can consist of many up or down candles, making these zones often significantly wider than OBs.
Demand Zone - The last downward move before an intensive rally.
Supply Zone - The last upward move before an intensive drop.
Often, an Order Block can be found inside a Demand/Supply zone.
🔹 Range - Also a manipulation zone and essentially an Order Block, but unlike an OB, this manipulation can last for a very long time when the Whale lacks sufficient liquidity from a quick manipulation and accumulates its large position by collecting internal and external liquidity through the range. Ranges, just like Order Blocks and Demand/Supply zones, are points of interest for the Whale to close its losing hedged positions and continue moving towards its goals.
Conditions for Applying and Validity of Manipulation Zones
An important condition for applying manipulation zones is that they can only be used once . That is, if the price has come to a zone and reacted to it, upon a second arrival, that zone is no longer valid. For convenience in marking used zones, I shorten them to the point of the first touch so as not to consider them anymore, but to understand which way the order flow is directed—a very important concept that, unlike structure, shows the true direction of the Whale's movement. Order flow is manifested by the price reacting to manipulation zones from below in an uptrend and from above in a downtrend.
It is also very important to understand that it makes sense to identify and use manipulation zones as one of a trade's entry conditions only from below for an uptrend and from above for a downtrend . Any counter-trend zones formed in the path of a trend are highly likely to be broken and serve as liquidity.
In ranges, manipulations formed after deviations can be used for entries from both sides.
Only manipulations that were formed at the beginning of an impulsive price move can be considered valid for entry. That is, they must be the manipulations that directly triggered the start of the move; in Smart Money terminology, they are often called the "origin" . Any manipulation in the middle or end of a move will most likely serve as liquidity on the way back to mitigate the origin zone.
How long does a manipulation zone remain relevant? It remains relevant until a new structural element (a higher high or a lower low) is formed , especially if the price has already come close to the manipulation zone, for example, into the FVG before the zone. This most likely means the Whale has already finished its business there and closed one of its losing hedged positions at a small loss. When the trend changes, such a zone will act as liquidity, not a POI. So, a manipulation zone will not always be mitigated; often, a reversal occurs from the FVG before it. However, entering from an FVG is much less reliable than from an Order Block, Demand/Supply zone, or Range. I personally skip such entries and wait for a new manipulation zone to form and be mitigated; they happen on the market constantly.
A good bonus that further strengthens the probability of a setup working out during the mitigation of manipulation zones is a liquidity sweep upon reaching them.
Consider the context and supplementary conditions. Although manipulation zones are the strongest areas for price reversals, they should always be used in conjunction with other supplementary conditions and tools, for example, with Fibonacci retracement levels or liquidity sweeps. "Context" implies any other conditions that can either confirm or contradict the likely direction of price movement. For example: in which phase of correction is the price? For a long, safe entries can only be considered from the discount zone (below the 50% Fib level); for shorts, only from the premium zone (above the 50% Fib level). Is there significant, un-swept liquidity nearby, such as previous daily, weekly, or monthly highs/lows, or an untouched Asian session high/low? What upcoming news could affect the asset and hit the stop before the setup plays out? At what time of day did the price mitigate the manipulation? Taking context into account is a crucial and integral part of analysis in the search for entry points.
Due to the fractal nature of market charts, manipulations can be seen on any timeframe. On weekly and daily timeframes, manipulation zones can be used for swing trading or investment purchases. 4-hour and 1-hour timeframes will show potential entries from manipulations for intraday trading or holding positions for several days. 5-minute and 1-minute timeframes will show manipulations in the form of order flow for final entry confirmation.
Whatever type of analysis you use for your trading, understanding the nature of market manipulations and practicing their recognition will allow you to be one step ahead of most market participants and open your trades with an understanding of which way institutional capital is most likely to move next.
~~~~~~~~~~~~~~~~~~~~~~~~~~~~~~~~~~~~~~~~~~~~~~~~~~~~~~~~~~~~~~~~~
If you found this guide helpful, support it with a Boost! 🚀
Have a question or a "lightbulb moment" from this article? Share it in the comments! I read every single one. 💬
► Follow me on TradingView for more educational content like this and to not miss my next detailed trade idea .
~~~~~~~~~~~~~~~~~~~~~~~~~~~~~~~~~~~~~~~~~~~~~~~~~~~~~~~~~~~~~~~~~

SOL Sell / Short SetupSell at cmp 163.49, 2nd entry mentioned and tp also mentioned, Must keep SL, best of luck.

$AAPL: Breaking Down Broader Cycle via FibsPublishing separately a specific interconnection type mentioned in idea below:
Testing this particular way of mapping the multi-scale cycles:

SOLUSDT → Countertrend correction and hunt for liquidityBINANCE:SOLUSDT looks quite promising on the bullish side. The price is testing one of the key resistance levels within the local trend rally. A correction is forming. Is it beneficial for us?
On the higher timeframe, we see a change in character, a breakout of the trend resistance, and the formation of an upward trend support line. Bitcoin is still bullish (locally) at this time, but it is consolidating, which generally provokes a correction in SOL as well. Focus on the 150-149 area. If the bulls are able to keep the price above this zone after the retest, followed by the formation of momentum, this can be considered a positive medium-term sign.
Locally, the price within the trading range of 149.36 - 158 is heading towards the area of interest and liquidity (eql) at 149.36. The current sell-off is most likely triggered by a large player seeking a more favorable entry into the market.
Resistance levels: 154.75, 156.8
Support levels: 149.36, 147.93
In the current situation, it makes the most sense to consider an intraday trading strategy. A countertrend correction and a retest of support could attract buyers...
Best regards, R. Linda!

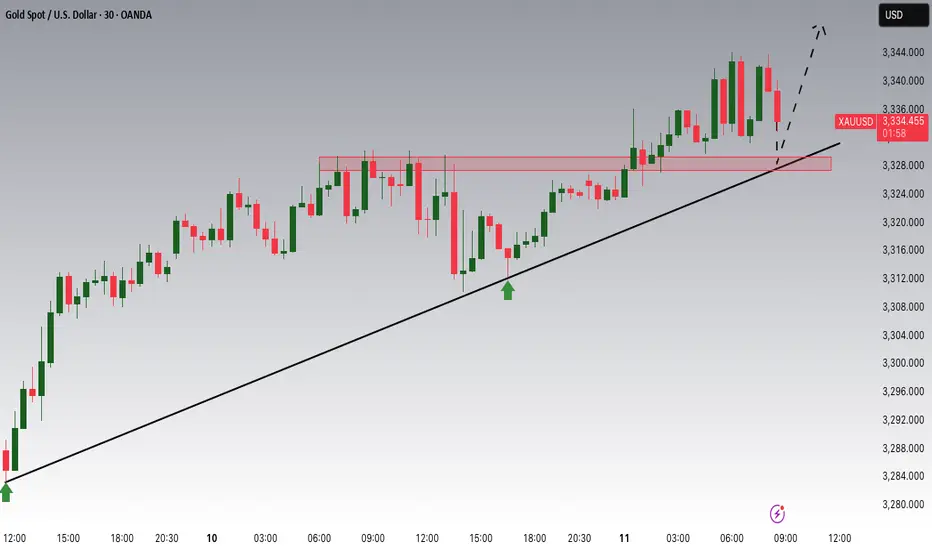
GOLD → Retest of consolidation resistance. Breakout?FX:XAUUSD is consolidating in a symmetrical triangle pattern. The price is stabilizing amid a falling dollar and uncertainty...
Gold is recovering after falling to $3,283 thanks to a weaker dollar and lower bond yields amid concerns over Trump's new tariff threats. The announced tariffs against seven countries, including Brazil and the Philippines, have heightened tensions, partially offsetting the Fed's hawkish signals. Markets are now awaiting new data from the US and speeches by Fed officials, which could influence the further dynamics of gold.
Technically, gold is squeezed between the resistance and support of a symmetrical triangle. The price is being aggressively pushed away from support within a bullish trend, but at the same time, gold is testing resistance for the fifth time, which only increases the chances of a breakout.
Resistance levels: 3330, 3345, 3358
Support levels: 3308, 3295
If gold continues to storm the local resistance at 3330 and the triangle resistance during consolidation, we will have a good chance of catching the breakout and growth. An additional scenario could be growth after a shake-up of the triangle support and the global trend.
Best regards, R. Linda!

Altseason 2025 - Wave 3Bitcoin is approaching its next destination between $125K and $250K, and that means its time to shift focus to altcoins. We’re not in full-blown altseason yet, but the foundations are forming. BTC dominance needs to drop fast, that’s the key trigger. Once it does, the rotation into alts could accelerate quickly.
Favorites so far this cycle:
🥑 POLONIEX:GUACUSDT 🧱 MEXC:YBRUSDT ⛏️ MEXC:KLSUSDT
🌐 HTX:SYNTUSDT 🧪 MEXC:DEAIUSDT *⃣ MEXC:SAIUSDT
🔗 POLONIEX:LLUSDT 🎮 KUCOIN:MYRIAUSDT 🤖 COINEX:ENQAIUSDT

Altseason 2025 - Wave 3Bitcoin is approaching its next destination between $125K and $250K, and that means its time to shift focus to altcoins. We’re not in full-blown altseason yet, but the foundations are forming. BTC dominance needs to drop fast, that’s the key trigger. Once it does, the rotation into alts could accelerate quickly.
Favorites so far this cycle:
🥑 GUACUSDT 🧱 YBRUSDT ⛏️ KLSUSDT
🌐 SYNTUSDT 🧪 DEAIUSDT *⃣ SAIUSDT
🔗 LLUSDT 🎮 MYRIAUSDT 🤖 ENQAIUSDT

Altseason 2025 - Wave 3Bitcoin is approaching its next destination between $125K and $250K, and that means its time to shift focus to altcoins. We’re not in full-blown altseason yet, but the foundations are forming. BTC dominance needs to drop fast, that’s the key trigger. Once it does, the rotation into alts could accelerate quickly.
Favorites so far this cycle:
🥑 GUAC/USDT 🧱 YBR/USDT ⛏️ KLS/USDT
🌐 SYNT/USDT 🧪 DEAI/USDT *⃣ SAI/USDT
🔗 LL/USDT 🎮 MYRIA/USDT 🤖 ENQAI/USDT

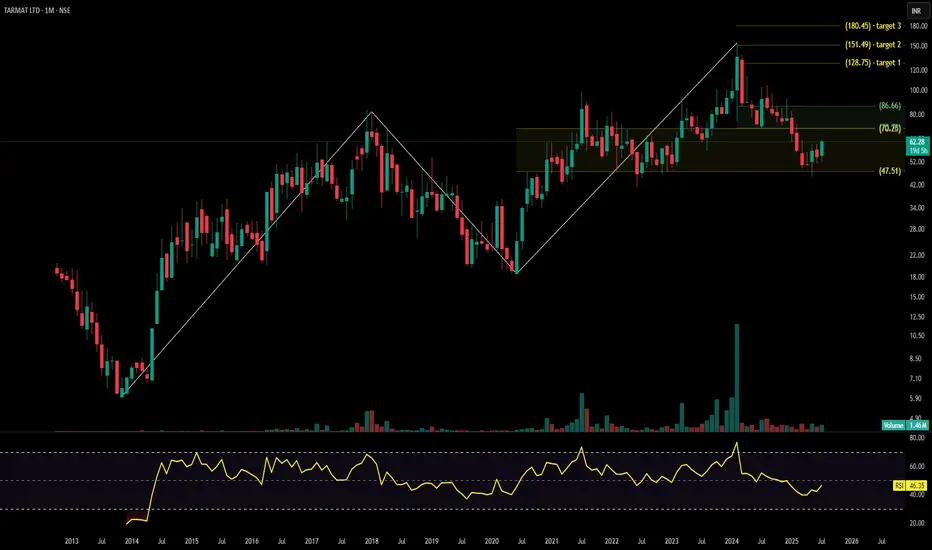
TARMAT LTDTarmat Ltd. is a mid-cap infrastructure development company specializing in engineering, procurement, and construction (EPC) of roads, highways, bridges, and airports. Operating across multiple Indian states, it works with government agencies and defense sector clients. The stock is currently trading at ₹62.28, showing signs of base formation with volume expansion and a well-defined Fibonacci breakout structure.
Tarmat Ltd. – FY22–FY25 Snapshot
Sales – ₹150 Cr → ₹178 Cr → ₹195 Cr → ₹215 Cr – Gradual revenue growth with stable order execution
Net Profit – ₹6.2 Cr → ₹7.5 Cr → ₹9.0 Cr → ₹10.6 Cr – Margin visibility improving with better project mix Company Order Book – Moderate → Moderate → Strong → Strong – Increasing inflow from central and state contracts Dividend Yield (%) – 0.00% → 0.00% → 0.00% → 0.00% – No payouts, reinvestment-focused approach
Operating Performance – Weak → Moderate → Moderate → Moderate – Cost efficiency gains visible
Equity Capital – ₹15.52 Cr (constant) – Stable ownership structure
Total Debt – ₹42 Cr → ₹40 Cr → ₹37 Cr → ₹34 Cr – Deleveraging in progress Total Liabilities – ₹89 Cr → ₹96 Cr → ₹103 Cr → ₹109 Cr – Aligned with order book expansion
Fixed Assets – ₹33 Cr → ₹35 Cr → ₹38 Cr → ₹41 Cr – Controlled capex, capacity-based investments
Latest Highlights FY25 net profit rose 17.7% YoY to ₹10.6 Cr; revenue increased 10.3% to ₹215 Cr EPS: ₹6.83 | EBITDA Margin: 14.6% | Net Margin: 4.93% Return on Equity: 13.52% | Return on Assets: 7.64% Promoter holding: 55.18% | Dividend Yield: 0.00% Recent order wins in Maharashtra, Karnataka, and airport runway expansion projects Improved cost controls and execution pace supporting profit momentum
Institutional Interest & Ownership Trends Promoter holding has remained stable at 55.18%, showing confidence in long-term strategy. Institutional interest is picking up post Q4 FY25 results, with DIIs adding 0.8% stake in April 2025. No signs of dilution or pledging activity observed. Overall ownership structure remains lean, and recent delivery volumes suggest selective accumulation by mid-cap trackers.
Business Growth Verdict Yes, Tarmat is showing promising signs of infrastructure-driven growth Margins and asset turnover improving steadily Debt profile is conservative and manageable Capex strategy is paced with execution capabilities
Company Guidance Management expects moderate revenue growth in FY26 with stable margins, supported by a healthy project pipeline. No major capex planned beyond routine equipment upgrades.
Final Investment Verdict Tarmat Ltd. offers a value-focused opportunity in India’s infra build-out cycle. The company’s small but stable base, growing order book, and improving margins suggest credible bottom-line visibility. While topline growth remains moderate and dividend payouts are absent, the low equity dilution, rising contract inflow, and renewed institutional interest make it an attractive candidate for staggered accumulation by investors seeking infra exposure in the mid-cap segment.
ISL LongCurrently Fib 0.5 of its all-time high and its last peak - both are showing resistance.
Once it breaks the level, the trendline will act as resistance (~114).
After that it may speed-up towards its next targets of 121, 146 and previous all-time high.

EngroH Bounce expectedEngroH is going to form an M pattern for which it has to take a bounce and then will fall back.
Bounce can be expected to Fib-0.618 (212) or Fib-0.786 level (245).
RSI and Stoch are in recovery phase. MACD still bearish.
Playing on levels should be prioritized with trailing stoploss once it reaches 212.
Exit should be planned near 245. Staying long can be fatal.
This is my personal opinion, not a buy / sell call.

$UNI - $10 from here?Hi guys! 👋🏻
🔔I'll be trying this setup for Uniswap
🔔 We have bounced from the strong support at $4.80, which we retested in April 25 and May 7 forming a pattern impersonating a double bottom
🔔 With the current chart pattern and levels, I'll be expecting a jump with a target on $10.
🔔 Might drop to $5.70 before another move upwards.
✊🏻 Good luck with your trades! ✊🏻
If you like the idea hit the 👍🏻 button, follow me for more ideas.

Gold Potential UpsidesHey Traders, in today's trading session we are monitoring XAUUSD for a buying opportunity around 3,330 zone, Gold is trading in an uptrend and currently is in a correction phase in which it is approaching the trend at 3,330 support and resistance area.
Trade safe, Joe.
GOOGL Short Term Trading IdeaEntered at $173.55 on 07/08.
Expecting earnings to be reported on 07/23 and beat expectations by a huge margin.
