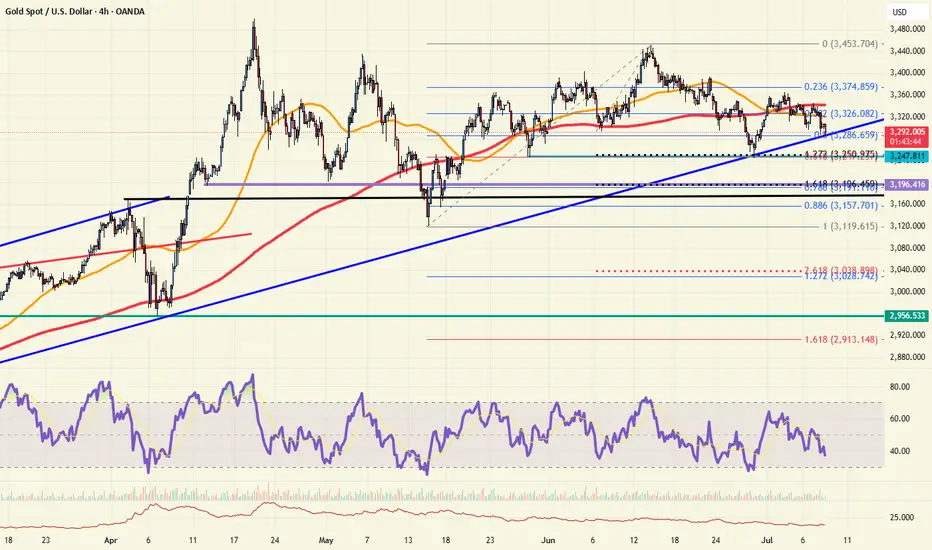
Gold is at critical support for bullsGold is at a key trend line of support. Most of the world is watching the 3285 level near term, and a break of this level would put the 61.8% Fibonacci retracement at 3248 back in view. A break of this level would target the 3120 level once again. Bulls are nervous, but this key support will be watched carefully into the next trading session.
Fibonacci
$AAPL: Multi-Cycles At PlayResearch Notes
Documenting New Interconnections
Wave properties:
3rd frame of reference
Multi-Cycles
Fibs of broader cycle
Using coordinates of the recent established cycles for predictive/guiding properties:

Gold Setup for longs and shorts This video covers gold on the local range whereby I expect price to eventually complete the move to the downside and clear the equal lows from MAy and June as well as take care of the poor lows and fill Quart Pivots .
I talk also about the Tradingview session volume profile chart and how this feature can really be a simple yet powerful guide for taking scalp trades off of specific levels and I show a couple of examples of the respect PA has for hitting those daily POC .
I Welcome any questions you may have

NASDAQ 100 – Is Upside Momentum Still Evident?Tough talk on tariffs at the back end of last week and over the weekend from President Trump ahead of his 90 day pause deadline, which is due to end tomorrow (July 9th), helped to put a small dent in trader sentiment, slightly undermining the recent strong upside momentum seen in the US 100 index.
This led to a sell off from fresh all time highs of 22908 registered on July 3rd to a low of 22600 yesterday evening, as the letters sent by the US administration outlining import tariffs of 25% sent to Japan, South Korea and another 12 nations were unveiled.
However, the moves have been relatively muted since then as traders remain optimistic that there is still time for negotiation to agree trade deals given that the new tariffs won’t go into effect until August 1st, providing a potential further 3 weeks to move things along.
Looking forward, in a relatively quiet week for data and central bank speakers, the next moves in the US 100 index towards the Friday close may be dictated by updates on trade deals between the US and EU, and the US and India, both of which have been reported as moving closer to agreement. Technical trends could also be an important factor.
Technical Update: Is Upside Momentum Still Evident?
Future tariff news has the potential to continue to be a very important sentiment driver for global equities, particularly within the tech sector, which the US 100 index reflects within its constituents.
As a result, it can be useful to assess potential support and resistance levels within the US 100 index that traders may be focusing on to gauge the next possible direction for prices.
Possible Resistance Levels:
Since posting the April 2025 low at 16290, the US 100 index has rallied by over 40% in only a 13-week period. While this has reflected positive sentiment during this time, traders may well now be questioning if this upside momentum can continue, or if it might stall, even leading to price weakness.
As such, being aware of potential resistance levels against which to judge current price strength that might be able to hold and possibly reverse this latest activity back to the downside, may prove important.
Having previously been strong enough to hold recent price strength, the 22908 July 3rd all-time high, may now represent an area where sellers can be found again, and as such, this marks a potential first resistance focus.
However, closing breaks above 22908 might suggest a more extended phase of price strength, with traders then possibly looking to 23429, the upper weekly Bollinger band and on breaks above this, even towards 24482, which is equal to the 38.2% Fibonacci extension of the February to April 2025 price decline, as the next resistance levels.
Possible Support Levels:
Of course, just because a 40% advance in prices has been seen, doesn’t guarantee it will continue and traders may be trying to focus on support levels that if broken on a closing basis over the coming days, might suggest risks of a more extended decline in price.
Looking at the daily chart above, it might be suggested that the first support is currently represented by 22201, the level of the rising Bollinger mid-average. Closing breaks below 22201 could in turn lead to further price declines to test 22053, the 38.2% Fibonacci retracement of May 23rd to July 3rd price strength, even 21787, the deeper 50% retracement.
The material provided here has not been prepared accordance with legal requirements designed to promote the independence of investment research and as such is considered to be a marketing communication. Whilst it is not subject to any prohibition on dealing ahead of the dissemination of investment research, we will not seek to take any advantage before providing it to our clients.
Pepperstone doesn’t represent that the material provided here is accurate, current or complete, and therefore shouldn’t be relied upon as such. The information, whether from a third party or not, isn’t to be considered as a recommendation; or an offer to buy or sell; or the solicitation of an offer to buy or sell any security, financial product or instrument; or to participate in any particular trading strategy. It does not take into account readers’ financial situation or investment objectives. We advise any readers of this content to seek their own advice. Without the approval of Pepperstone, reproduction or redistribution of this information isn’t permitted.

Disney Wave Analysis – 8 July 2025- Disney reversed from multi-month resistance level 123.60
- Likely to fall to support level 114.90
Disney recently reversed from the strong multi-month resistance level 123.60 (which is the upper border of the sideways price range inside which the price has been trading from 2022) standing near the upper weekly Bollinger Band.
The resistance level 123.60 was further strengthened by the 38.2% Fibonacci correction of the sharp weekly downtrend from the start of 2021.
Disney can be expected to fall to the next support level 114.90 (former low of the primary correction 2 from May).

WTI crude oil Wave Analysis – 8 July 2025- WTI crude oil reversed from the support zone
- Likely to rise to resistance level 70.00
WTI crude oil recently reversed up from the support zone located between the key support level 64.55 (former resistance from the end of April), the lower daily Bollinger Band and the 61.8% Fibonacci correction of the upward impulse from May.
The upward reversal from this support zone started the active medium-term ABC correction (2).
WTI crude oil can be expected to rise to the next round resistance level 70.00 (target price for the completion of the active impulse wave i).

ETH/USDT 1W Chart📊 Trend structure (Price Action)
Downtrend (historical):
A series of Lower Highs (LH) and Lower Lows (LL) — a classic downtrend.
Confirmed by the orange downtrend line.
A change in structure — a possible beginning of an uptrend:
A Higher Low (HL) has recently been formed after a Lower Low (LL).
Suggests a possible end to the downtrend and an attempt to break out upwards.
Currently:
The price is testing the upper downtrend line.
A breakout above the orange line may confirm a trend change.
🟢 Key Resistance Levels (Green Lines):
Level Meaning
3.058 USDT Potential target after a breakout from consolidation
2.767 USDT Nearest strong resistance - currently being tested
3.427 USDT Deep resistance level from the previous high (HH)
🔴 Key Support Levels (Red Lines):
Level Meaning
2.234 USDT Nearest support - previous breakout
1.883 USDT Early 2023 support
1.507 USDT Local bottom
1.204 USDT Historical support - LL extreme
📉 Stochastic RSI (Momentum Indicator):
Currently in the overbought zone.
This may suggest a short-term correction before an actual breakout.
However, in a strong uptrend, the indicator may "hang out" in the overbought zone for a long time.
📈 Potential scenario:
If the breakout above 2.767 and the orange trendline holds:
A possible move to 3.058 USDT as the first target.
Extended target: 3.427 USDT (HH).
If the breakout fails:
Correction to 2.234 USDT or lower.
There is a risk of returning to a downtrend.
✅ Bullish signals:
Higher Low (HL) formation after Lower Low (LL).
Testing the upper downtrend line with an attempt to breakout.
Volume is increasing (based on candles).
⚠️ Bearish threats:
Stochastic RSI in the overbought zone.
Breakout not confirmed by 100% (needs a weekly closing candle above 2.767).
Resistance at 3,058 could halt the move.
📌 Conclusion:
Ethereum (ETH) could be on the cusp of a new uptrend, but a breakout above 2,767 USDT is needed for confirmation. If it does, a move to 3,058 and then 3,427 is possible. However, the current overbought level on the Stochastic RSI could signal a short-term correction before the trend gains strength.

30M Insight: EURUSD Buy Limit ReadyGood Mornıng Traders;☀️
Based on a 30-minute analysis, I’ve identified a shift in EURUSD market structure. I’ll be waiting for price to reach my level with a buy limit order.
📥 BUY LIMIT ORDER: 1.17180
🛑 STOP LOSS: 1.16946
🎯 TP1: 1.17275
🎯 TP2: 1.17412
🎯 TP3: 1.17649
📊 Risk / Reward Ratio: 2.00
Patience meets precision. Let the market come to you.
🧠 Master your mindset with iron discipline.
Never fear the trade—let the trade fear you.
Keep your motivation high and your focus sharper than ever.
-----
Your likes and support are what keep me motivated to share these analyses consistently.
Huge thanks to everyone who shows love and appreciation! 🙏

$30 easy by 2026I'm holding the 1/16/26 25C those are the highest and furthest out options you can get on hood. Bought at 1.55 on 7/2 now worth 3.30 good entries if eth pulls back would be 12 and 10 best case. I see this running quick I will sell atleast half at 30. They hold and are staking over 500M worth of eth largest amount for any publicly traded company, yeild will be great for them but they are obviously selling shares to purchase eth so there's plenty of risk company only has 5 employees according to hood still under 1B last time I checked. 50ma is around 16 should be a clear path to 30 maybe psychological resistance at 20.
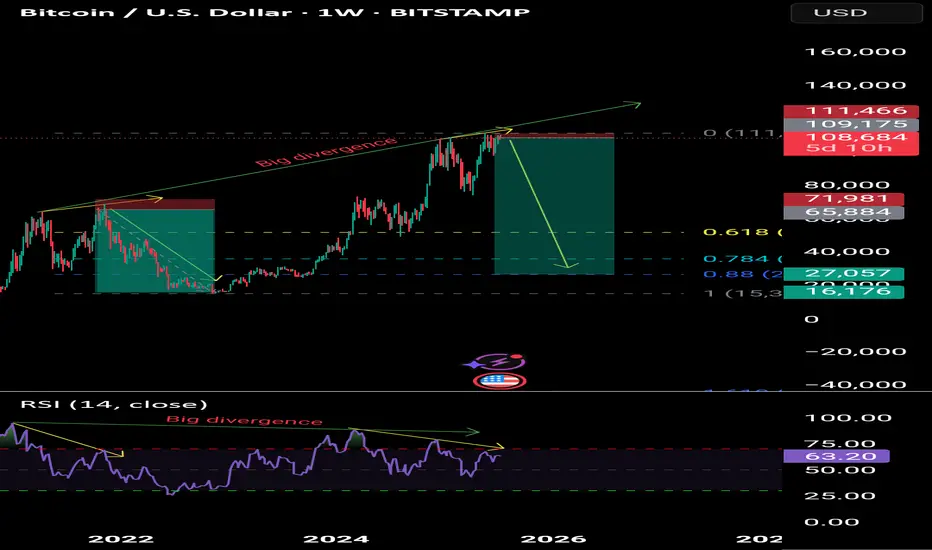
Bitcoin to the 30,000 levelBitcoin to the 30,000 level
On the weekly time frame, there is a negative divergence of Masoud and the winner is the one who keeps her sell trade below 30,000.

Gold Long: the video explanationHere I discussed how I came out with the completion of the correction for Gold and explain why it may be a good idea to set the stop loss slightly lower.

AEHR watch $15.99-16.27: Major Resistance may give a Dip BuyAEHR has been flying high with the general market.
Approaching a significant resistance into $16 round.
$15.99-16.27 is the exact zone of concern up here.
.
Previous analysis that caught the BreakOut:
===============================================
.

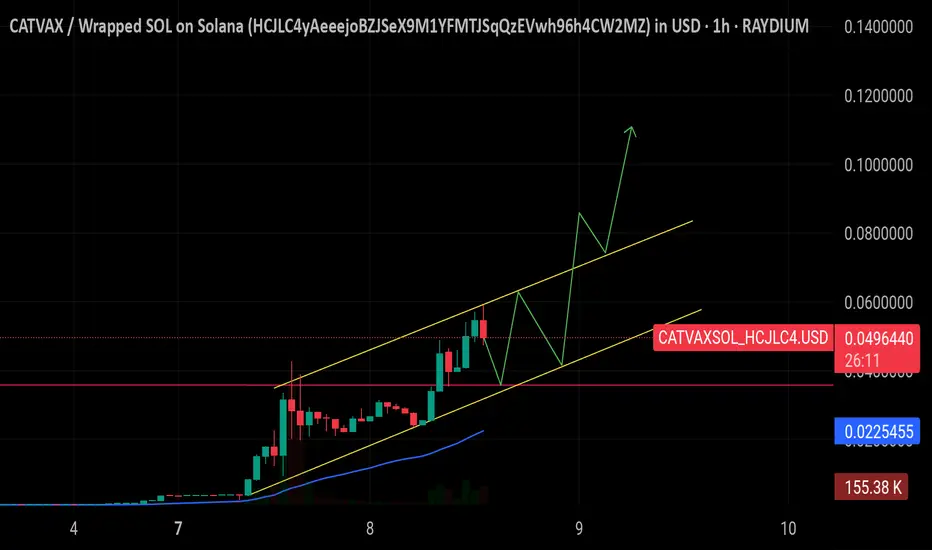
$CATVAX – The Unstoppable Meme Monster! 🚨
Against all odds and without a single active dev, $CATVAX has exploded +6000% in just two weekly candles, powered purely by its insanely bullish community. 📈 With no dev wallets, there’s zero rug risk, making it one of the purest community-driven pumps we’ve seen in the Solana ecosystem. 🔥
Currently riding a perfect ascending channel with strong bullish continuation signs, this is now the hottest meme pair on DEXTools — and price action suggests there’s still more upside to come. As long as it respects the lower trendline, the rocket’s still fueled. 🚀
This isn’t just a pump — it’s a movement. $CATVAX is the meme coin to watch right now. 💥
🔗 Live Chart : dexscreener.com
📜 Token CA: EVDoPXkWNRMc7fQirg7emNdc17KNqsCyzVi4mWPmDvni
🚨🚨DYOR and buy at your own risk. ⚠️🚀

Bitcoin: Integration of Major BottomsUpdating former discovered connection from closeup.
Covid Low - 2022 Bottom
Using direction for fib channels

GBPCHF - Looking To Sell Pullbacks In The Short TermM15 - Strong bearish move.
No opposite signs.
Currently it looks like a pullback is happening.
Expecting bearish continuation until the two Fibonacci resistance zones hold.
If you enjoy this idea, don’t forget to LIKE 👍, FOLLOW ✅, SHARE 🙌, and COMMENT ✍! Drop your thoughts and charts below to keep the discussion going. Your support helps keep this content free and reach more people! 🚀
--------------------------------------------------------------------------------------------------------------------

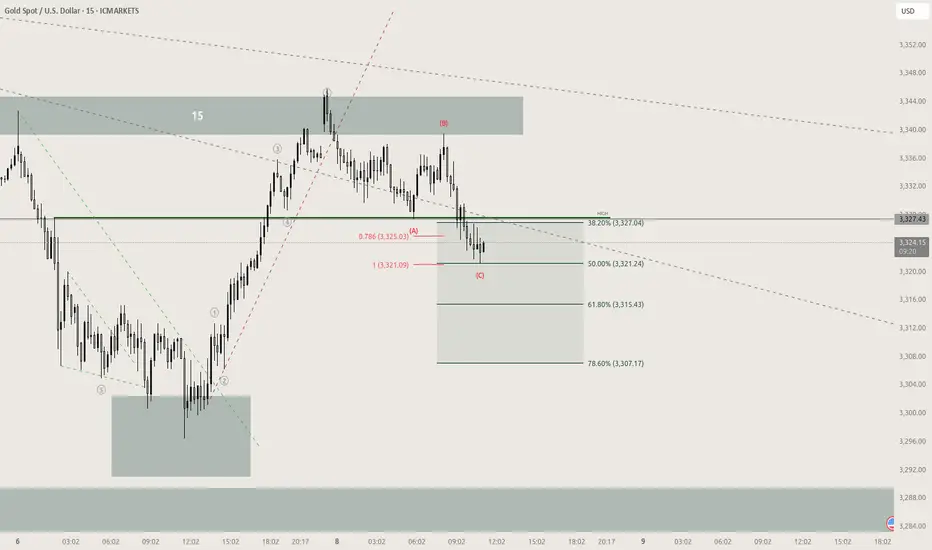
GOLD continuation setupGold reached the 100% extension for a C wave correction after a 5 wave move to the upside, additionally 50% retracement of that 5 wave move 2 very good confluences for a continuation buy
Bulls buyNB: Overall trend is still sells as we have a resistance line for sell area. Currently we ride the buys as its forming a flag. Any break bellow the flag resistance line indicate end of the flag hence we enter sells.
Trade cautiously

Like the previous cycles!Our basis is the Fibonacci retracement with 78%. The 78% level should be aligned with the previous peak.

GBP/USD – Bearish Shift Confirmed | Structure Breakout + AO DiveThe market just gave us a textbook setup on GBP/USD!
🔍 Analysis Overview:
A clear bearish divergence has formed between price and the AO (Awesome Oscillator), signaling potential trend exhaustion at the top.
We saw a rising wedge break to the downside, with a structure breakout confirming a shift in momentum.
Price decisively broke below the 1.36109 support level, indicating bearish control.
📊 Technical Confluence:
AO shows bearish divergence, confirming weakening bullish momentum.
Structure breakout from the wedge pattern aligns with AO signals.
Fibonacci retracement and extension levels give a clear target zone:
🎯 TP1 area: 1.35805 – 1.35895 (Fib 1.618–1.786 extensions)
⏳ What I'm Watching:
I'm now waiting for a pullback to retest the broken structure (possibly around the 0.382–0.618 Fib levels: 1.36242–1.36323). A bearish reaction here could provide a high-probability reentry opportunity.
💡Trade Idea Summary:
Bias: Bearish
Signal: Divergence + Structure Break
TP Zone: 1.35805 – 1.35895
Watch for: Pullback to retest broken structure before continuation
📈 Stay alert and manage your risk wisely!
