NQ Power Range Report with FIB Ext - 7/8/2025 SessionCME_MINI:NQU2025
- PR High: 22853.50
- PR Low: 22808.50
- NZ Spread: 100.5
No key scheduled economic events
Session Open Stats (As of 12:25 AM 7/8)
- Session Open ATR: 318.85
- Volume: 24K
- Open Int: 269K
- Trend Grade: Neutral
- From BA ATH: -0.8% (Rounded)
Key Levels (Rounded - Think of these as ranges)
- Long: 23239
- Mid: 21525
- Short: 20383
Keep in mind this is not speculation or a prediction. Only a report of the Power Range with Fib extensions for target hunting. Do your DD! You determine your risk tolerance. You are fully capable of making your own decisions.
BA: Back Adjusted
BuZ/BeZ: Bull Zone / Bear Zone
NZ: Neutral Zone
Fibonacci

SPY July 7th 2025SPY July 7th 2025
Day 1 of journaling my day trades on SPY. I am going to start journaling my ideas every night if possible in order to fine tune my setup and to analyze my wins and losses. I will be using Renko (Traditional, 2 box size, 1m) as my main chart, Range Bars (50R, 100R, 200R, or 500R), and candle sticks (various timeframes) to identify supply/demand, price ranges, and trends - placing a high emphasis on volume as it applies to the Wyckoff Method. I will also occasionally refer to real time options charts and VIX, however I will primarily use those for my entries during the day.
Each day I will provide setups for a bullish and bearish bias, which should help minimize instances where the price moves against me - with slow reactions leading to holding losing trades and hesitating to enter a trade on the side of the new trend. I’ll try to come up with a consistent format as time goes on. For today, I will go down the list of my indicators and provide notes that fit the bias of each trading strategy.
+++++++++++++++++++++++++++
Bullish Analysis
Renko: Strong breakout from ascending channel on June 30. Fisher Transform is signaling continuation. A retest of the top of the channel would take the price back to ~$618.
100R ($1) Chart: Price is in an uptrend being supported by high volume. 34VWMA (purple) is above 200MA (green). The bounce on July 2nd (around $616) was supported by a high volume node, indicating genuine interest pushing the price higher.
30m Chart: Price closed on July 3rd at the top of an ascending channel inside of a larger ascending channel. Since the larger ascending channel is one of strength, it can be assumed that the smaller one is a sign of strength as well. A break too far below the lower end of this smaller channel would be a sign of weakness, which does not seem to fit the current market structure after last week’s breakouts, but it is still possible that the trend fails. Fisher transform is forming a “hook” pattern that can signal continuation.
+++++++++++++++++++++++++++
Bearish Analysis
On a smaller scale, the price appears due for a pullback, which can fit both the bullish and bearish trading ideas depending on where the market opens.
Renko: The price closed at the top of an ascending channel on July 2nd and will find more buyers upon a test of the lower band and the anchored VWAP.
50R (50¢) Chart: If the price pulls back to the bottom of the channel (around $620) this would coincide with a retracement of 0.618 - which is a key fib level. A break below the 1.00 extension ($616) could signal a break of the uptrend - a $9+ drop if an entry can be found near the top of the channel, not too bad.
5m Chart: The price left a gap down to $620 on July 3rd. Filling this gap could provide important liquidity to propel the price higher. Additionally, The high volume at the start and end of Thursday’s flat trading day (with low volume in between) could be a sign of accumulation or lack of sellers.
1DTE ATM Put, 2m: If a more prolonged (and profitable) downward move is expected from smart money, we should see volume increase for ATM puts during the session. Depending on where things open, we could see a potential spring/false bearish breakout (below $2.20), or a true bullish breakout (above $2.80). Using an options calculator, $623.75 on AMEX:SPY would set up the Spring and a drop below $622.50 could confirm the put breakout.
+++++++++++++++++++++++++++
Targets
Calls: Enter $618-$620, Target $625-$628, Stop Loss $617.75
Puts: Enter $623-$625, Target $620, Stop Loss $626.25
To conclude, overnight action on CME_MINI:ES1! and the gap up on TVC:VIX shows that the price is already retracing. The top of the wedge for VIX would be just above $20 - a key level to watch for a reversal. Unless the upper part of the channel on SPY is tested and rejected again after the open, I will sit out and wait to hit the bullish targets. We are still in a strong uptrend after last week’s breakouts, so going short is the riskier bet anyway, as buyers could step in at any time.
Looking at ATM calls and puts side by side (bottom two charts), it is clear that calls were not heading into today with a good setup. It would be worth taking a chance on puts if a Spring forms (below $2.20), which, again, would correlate with AMEX:SPY hitting $623.75 during the session - and not much higher.
My main idea for the start of this week is to look for a good pullback for calls, so I will be patient and will try not to force anything. If smart money has a bullish sentiment, there will still need to be a short accumulation phase for calls so I will watch to see what the chart is doing for ATM calls around $620.

NVIDIA (NVDA)-Trade PlanNVDA, After an explosive run powered by GenAI infrastructure and bullish earnings, the chart is setting up for either a bullish continuation or a healthy pullback.
With volatility tightening and volume compressing, this is a great moment to prepare for either breakout or breakdown scenarios.
🎯 Trade Plan – Tiered Long Setup
📌 Entry Zones (Tiered Buying):
🔹 $150
🔸 $140
🔻 $120
📈 Profit Targets:
TP1: $160
TP2: $175
TP3: $200+ – Long-term continuation play if AI macro momentum persists
📌 DISCLAIMER: This idea is for educational purposes only. Always use proper risk management and assess your own strategy

TSLA: Triangle PatternResearching the market through structural lens, particularly the topology of trapped liquidity buildup and compression of volatility, that leads to a proportionally heavier move once a breakout occurs.
Raw compression area derived from waves of higher degrees (2nd, 3rd)
The longer price consolidates within boundaries of a triangular formation, the more significant the breakout tends to be.

From daveteaches 001Waited 9am - 10am
Give a 9am 1 hr candle zone with Fibonacci level.
Slight pullback from 0.3 and all the way down.

EURUSD OUTLOOK 8 - 11 JULYNFP and unemployment rate came out bullish for the dollar which caused that big push to the down side. The job market is still holding well thus we are less likely to see the FED cut rates.
Other economic data is still showing that the dollar is weaker against the euro so I'm not going to change my direction bias just yet. Technical analysis also clearly shows that we are still bullish on EURUSD.
We don't have much fundamental data coming out this week so I'm anticipating price to continue lower to give a deeper pullback off of last weeks data, Then next week depending how CPI, PPI and Retails sales go we will get a clearer picture on how to trade the pair.
Last week's 4H outlook is still valid and is more useful when looking to execute trades. This daily Analysis just gives the bigger picture for more of a swing setup analysis

GOLD Analysis – Weekly Outlook GOLD Analysis – Weekly Outlook 🟡📈
Price has just tapped into our Daily PD Array, precisely the Fair Value Gap (FVG), which was clearly marked. It also entered the discount zone, aligning with our bullish bias.
Additionally, we’ve seen a liquidity sweep, followed by a strong bullish reaction — a classic sign of smart money accumulation.
📍 Key Targets:
First Target 🎯: 3396
Second Target 🎯: 3451
As long as price holds above this zone, we expect the bullish move to continue. Let’s see how it unfolds over the coming sessions.
🔔 Follow for more weekly insights.
📊 See you next time!
#Gold #XAUUSD #TradingView #SmartMoneyConcepts #FVG #LiquiditySweep #PriceAction #MarketAnalysis

Outbreak RetracedA 9 months bottom building was followed by a stormy rise and almost tripled prices.
This rise was to fast and could not digested by the market, i.e. it was followed by an also fast retracement down.
Now the market may be in an equilibrium and we can have a closer look to the long term picture.
Since 2014 the stock has lost over 97 % of its value. From a respectable stock it has turned into a penny stock.
This may open chances for buyers. Of course Idon't see an upward correction of the 11 year long loss but even if we only can test the November 2024 level and reach the Ichimoku cloud this would be a gain of far over 100 %. By the way this would also be the previous bottom of 2022 and a natural resistance.

GOLD → Buyers are hesitant due to new tariffsFX:XAUUSD continues its correction phase after updating local highs and breaking through trend resistance. The dollar is making traders nervous...
After rising 2% last week, gold started Monday with a decline to $3,300 amid a stronger dollar due to the risk of new tariffs from Trump, who sent letters to 12 countries threatening to impose duties of up to 70% if no agreements are reached by July 9. This boosted demand for the dollar as a safe-haven asset.
Gold is also under pressure from strong US employment data, which has dampened expectations of a rate cut. The market is focused on news on tariffs and the publication of the Fed minutes on Wednesday, which may clarify the outlook for monetary policy.
Technically, the correction may end in the 0.7 Fibonacci zone, in the range of 3295-3300. After the formation of a reversal pattern, the market may strengthen to 3350-3360.
Resistance levels: 3315, 3344, 3358
Support levels: 3300, 3295
Locally, the price is trying to consolidate below the range, which could lead to a decline to 3300-3295. If, during the correction from support, the market manages to consolidate above 3315, we can expect growth. Otherwise, a weak reaction at 3295 could lead to a retest of 3275 and consolidation in the selling zone, which could lead to a further decline to 3245 .
BUT! We are closely monitoring the position of the US and Trump on tariffs, as he is once again issuing ultimatums to countries, to which the markets are reacting...
Best regards, R. Linda!

GBPUSD → Correction before the bullish trend continuesFX:GBPUSD is forming a trading range for consolidation of potential ahead of a possible continuation of growth as part of a countertrend correction.
The dollar is trying to recover from its decline due to a local change in the fundamental background, but the global trend for the DXY is bearish. This could provide support for the GBP to continue growing, provided that the bulls hold their defense above the 0.5 Fibonacci zone of the main impulse movement.
The market is holding GBPUSD within the trading range of 1.359 - 1.3675. The trend is bullish, and within the correction, liquidity may be captured from 1.359 before further growth.
Resistance levels: 1.3675, 1.3764
Support levels: 1.359, 1.3511
If the reaction to the subsequent retest of support at 1.359 is weak, we can consider a continuation of the correction to the 0.7-0.79 Fibonacci zone, which would be the most favorable entry point for us (focus on 1.3511 — a false breakout will increase interest in buying). In the current situation, the focus is on 1.359.
Best regards, R. Linda!

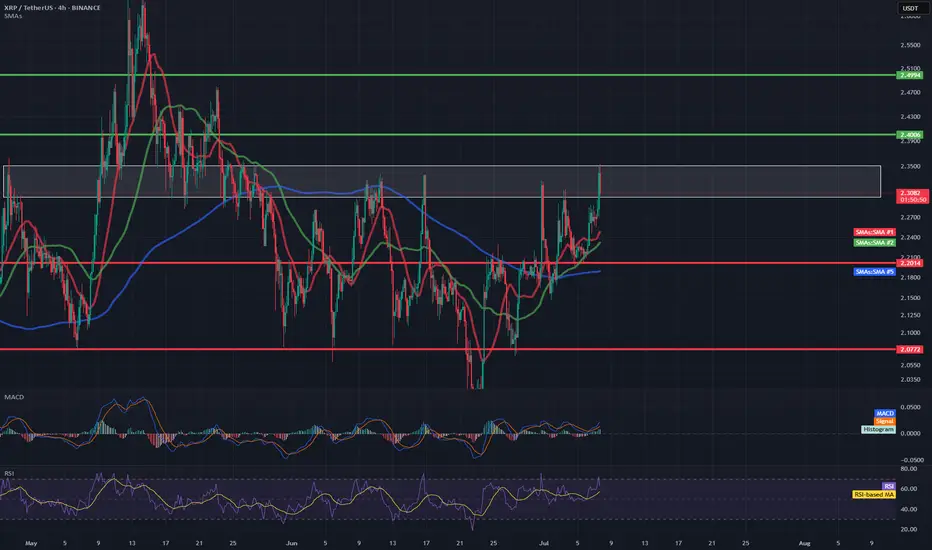
XRP/USDT 4H📊 1. Trend and moving averages
Red line (SMA 10) – short-term, currently rising, which suggests upward momentum.
Green line (SMA 20) – also in the upward trend and below the price – dynamic support.
Blue line (SMA 50/200) – probably SMA 50 or 200 – the price has broken through it from below and is currently above it – this is a pro-growth signal.
📌 Conclusion: In the short and medium term, a reversal of the trend to growth is visible.
📈 2. MACD (Moving Average Convergence Divergence)
The MACD line has crossed the signal line from below, which is a buy signal.
The MACD histogram is rising and is above zero – further confirmation of the upward trend.
📌 Conclusion: The upward momentum is increasing.
💪 3. RSI (Relative Strength Index)
RSI is currently at ~62, which means that:
We are still ahead of the overbought zone (70).
RSI is rising – it suggests bullish buyer pressure.
📌 Conclusion: There is still room for further growth before the market is overbought.
🔍 4. Market structure and resistance/support
The price is in the 2.30–2.35 USDT zone, which previously acted as resistance.
The closest resistance is around 2.38–2.40 USDT – the level from May, where the decline occurred.
The closest support is around 2.20 USDT (in line with the green SMA) and stronger at 2.05–2.10 USDT (earlier consolidations).
📌 Conclusion: Breaking 2.40 opens the way to a test of 2.50 and above.
🧠 Technical Summary
Aspect Rating
Trend (SMA) ✅ Up
MACD ✅ Buy
RSI ⚠️ Near overbought
Resistance/Support ⚠️ Resistance at 2.38–2.40
Movement Potential ✅ To 2.50 or higher
📌 Potential scenarios:
✅ Bullish (uptrend scenario)
A hold above 2.30 and a breakout of 2.40 could give an impulse for further gains towards 2.50–2.60.
Strong confirmation would be an increase in volume.
⚠️ Bearish (correction scenario)
A rejection from 2.38 and a drop below 2.20 could initiate a retest of support at 2.05 or even 1.95.
AFRM eyes on $50.66: Semi-Major Genesis fib for High Support AFRM has been showing considerable strength.
Hit a Geneiss fib above and fell back to sister fib.
Strong Bull trend would hold this fib into new highs.
$50.66 is the immediate floor to hold
$49.17 is a minor fib for a speed brake.
$47.60 is Bulls' Last Stand to hold uptrend.
=============================================
.

US30: Market in Rally Mode – Prepare for the Next OpportunityWelcome back! Let me know your thoughts in the comments!
** US30 Analysis !
We recommend that you keep this pair on your watchlist and enter when the entry criteria of your strategy is met.
Please support this idea with a LIKE and COMMENT if you find it useful and Click "Follow" on our profile if you'd like these trade ideas delivered straight to your email in the future.
Thanks for your continued support! Welcome back! Let me know your thoughts in the comments!

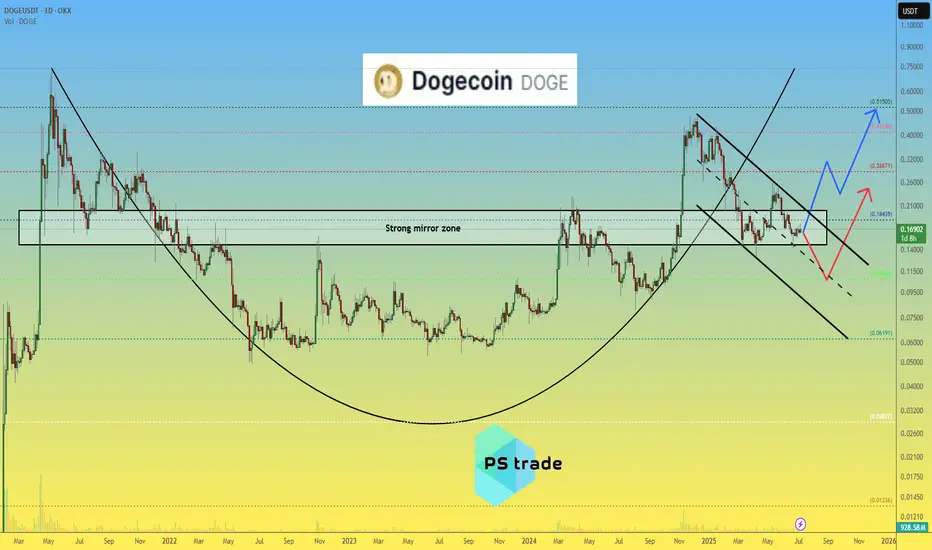
Dogecoin DOGE price analysisCRYPTOCAP:DOGE price is now in the middle of a strong mirror zone of $0.15-0.20
📈 It looks like the position is now accumulating, forming a "double bottom" and then, only a way for growth, to the highs in the region of $0.45-0.50
🐻 On the other hand, the scenario of another "leg" down fits perfectly into the TA canons. That is, it is very likely that if the price of OKX:DOGEUSDT drops below $0.15, then it is already fall to $0.10)
P.S.:
#Doge is an interesting asset, it is worth watching with one eye, and with the other eye, watch how the "battle" between Trump and Musk (who is the main influencer and "pumper" of #Dogecoin) will end.
💡 And then put the two pieces of information together and make a trading decision - "easy money" !)
_____________________
Did you like our analysis? Leave a comment, like, and follow to get more
UDPL LongUDPL has very strong fundamentals (P/E: 2.3, EPS: ~30)
Its a dividend paying stock as well.
It is building cup and handle formation with the channel top line working as major resistance.
It took a correction from Fib 0.786 level of previous all-time high.
Once 80 (Channel top line) is broken, we can see it moving towards 91 which is its previous all-time high.
Ultimate targets are shown in the chart.
Monthly RSI is ~70 and ADX in 30s, showing a building momentum.
Its not a buy / sell call, just my personal opinion.

USDJPY Price Accumulated|Time For Bullish Distribution|Setupsfx|The price has accumulated nicely and is now distributing. We have three targets in mind, but set your own based on your analysis. Our approach is purely technical, but also includes a basic fundamental approach. This analysis concludes over 1500 pips and is a swing move. Please use this analysis as educational purposes only, as it does not guarantee that price will move exactly as predicted.
If you like our idea, please consider liking and commenting on it.
Good luck and trade safely!
Team Setupsfx_

AUDUSD - RBA Rate Cut and Tariff Deadline in FocusIn a week that is light on economic data and events, with a heavy emphasis towards what happens next once President Trump’s 90-day tariff pause ends on Wednesday (July 9th), the AUDUSD currency pair has more than most for traders to focus on.
This is due to the fact the RBA, the Australian central bank, decides early Tuesday morning (0530 BST) whether to cut interest rates for the third time in a row from 3.85% to 3.6%, as is widely expected by markets, given that inflation has eased in recent months back into the RBA’s 2-3% target range. This announcement is closely followed by the RBA press conference (0630 BST), which could also be an important influence on the direction of AUDUSD depending on the comments Governor Bullock makes regarding future rate moves, economic growth and tariffs.
In terms of trade tariffs, President Trump last week suggested that he is unlikely to extend the 90 day pause, although he has changed his mind before. He also indicated that letters are being sent to trading partners outlining tariffs of between 10-70% on imports depending on whether he believes the country has been negotiating in good faith or not. These new tariffs are due to go into force on August 1st, so there is potentially still time for more twists and turns in this story and AUDUSD volatility may well increase across the trading week ahead as it plays out.
AUDUSD touched an 8 month high at 0.6590 last Tuesday (July 1st) before running into a wall of profit taking and eventually closing the week at 0.6550. Given the risk events facing traders that were just outlined above, this type of price action may not be that surprising.
Looking at how this week has started for AUDUSD, early trading in Asia has seen fresh selling to potential support around 0.6500 (see technical update below), which at the time of writing (0730 BST), is still holding, although bounces have so far been limited.
Technical Update: Preparing For The Week Ahead
With potential for a rate cut in Australia and concerns over tariff news this week, it perhaps isn’t too much of a surprise AUDUSD price corrections are materialising as a reaction to recent strength. While this decline may continue over the short term, traders are perhaps more focused on the potentially positive pattern of higher price highs and higher price lows that have materialised since April 9th 2025, which the chart below shows.
Of course, there is no guarantee this pattern will continue over coming sessions but being aware of support and resistance levels that may hold or exaggerate future price moves may be useful to know in advance.
Potential Support Levels:
After price strength, especially if new recovery highs within an uptrend pattern have been posted, it may prove to be Fibonacci retracement levels that act as support to any future price weakness. Calculating these on the period of price strength seen between May 12th up to the July 1st high, the 38.2% retracement level stands at 0.6501.
With the current setback now moving towards 0.6501 this morning, traders may be watching how this potential support level performs on a closing basis, as confirmed breaks lower might lead to a more extended phase of weakness that could prompt tests of 0.6473, the 50% retracement, even 0.6446, the deeper 62% retracement level.
Potential Resistance Levels:
Having seen new highs recently posted, which was the highest AUDUSD trade since mid-November 2024 (see the chart below), we can look at the weekly perspective to establish the next possible resistance levels.
As the chart shows, the latest AUDUSD activity has recently tested weekly resistance at 0.6550, which is equal to the 61.8% Fibonacci retracement of September 2024 to April 2025 weakness. It should be noted, in a similar way to last week, that it is possible AUDUSD may see trading activity above this 0.6550 resistance, but as we are using a weekly timeframe, it is this upcoming Friday's weekly close above this level that is required to suggest possibilities of a successful upside closing break.
Much will depend on future market sentiment and price trends, but weekly closes above 0.6550 if seen, may lead to further price strength towards 0.6688, the November 2024 high.
The material provided here has not been prepared accordance with legal requirements designed to promote the independence of investment research and as such is considered to be a marketing communication. Whilst it is not subject to any prohibition on dealing ahead of the dissemination of investment research, we will not seek to take any advantage before providing it to our clients.
Pepperstone doesn’t represent that the material provided here is accurate, current or complete, and therefore shouldn’t be relied upon as such. The information, whether from a third party or not, isn’t to be considered as a recommendation; or an offer to buy or sell; or the solicitation of an offer to buy or sell any security, financial product or instrument; or to participate in any particular trading strategy. It does not take into account readers’ financial situation or investment objectives. We advise any readers of this content to seek their own advice. Without the approval of Pepperstone, reproduction or redistribution of this information isn’t permitted.

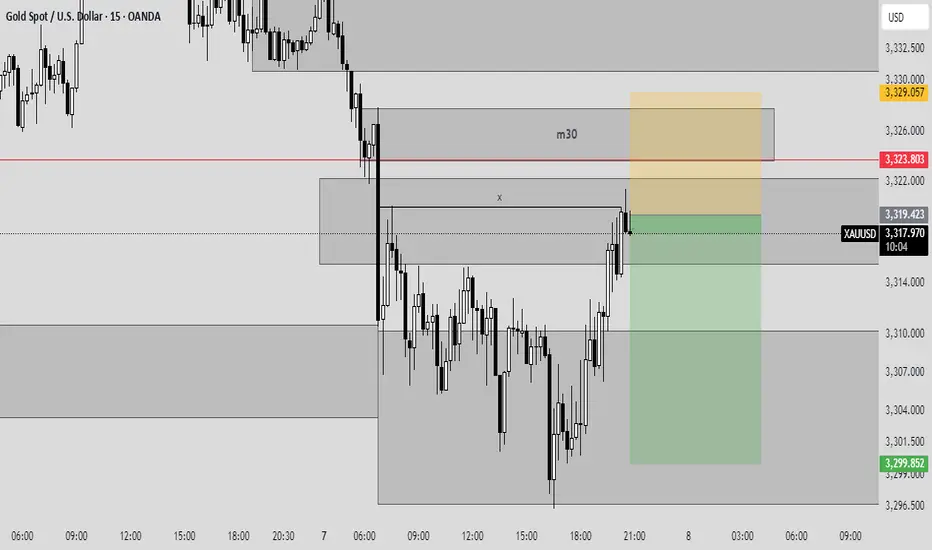
XAUUSD SEllhere the price retested our zone at 3319-3321 so we enter sell .
Please do risk and money management and your own analysis before entry.
Please follow to support me .
BTC — Weekend Pump Fades.. All Eyes on the Gartley Reversal ZoneBitcoin has been consolidating in a tight range between $110K and $105K over the past two weeks. This weekend’s attempted breakout stalled out quickly! BTC was rejected at the Point of Control (POC) of the previous range and came close to the 0.786 retracement of the recent drop.
🧠 Reminder: Weekend pumps are notorious for being unreliable, especially without strong volume.
Now, the charts point toward something much more structured — a potential Gartley harmonic pattern forming, with multiple levels of confluence suggesting the next key decision zone is just around the corner.
🧩 Gartley Completion Zone: $106,290–$106,400
This price zone is loaded with confluence:
✅ 0.786 Fib retracement of the XA leg sits at $106,290
✅ 1.0 trend-based Fib extension of the BC leg is at $106,370
✅ Anchored VWAP from all-time high aligns precisely at $106,370
✅ VAL (Value Area Low) sits at the same level
✅ Imbalance (Fair Value Gap) from earlier price inefficiency lies in this exact region
All of this stacks up into a high-probability reaction zone.
🎓 Educational Insight: How to Trade a Gartley Harmonic
The Gartley pattern is one of the most powerful harmonic setups — a structured form of retracement and extension that captures exhaustion before reversals. Here's how it works:
🔹 XA: Impulse leg
🔹 AB: Retracement of 61.8% of XA
🔹 BC: Retraces 38.2%–88.6% of AB
🔹 CD: Extends to 78.6% retracement of XA and aligns with a 1.0–1.272 Fib extension of BC
🟢 Point D is the entry zone — your reversal opportunity.
📉 Stop-loss sits just below invalidation (Point X).
💰 Targets usually lie at 0.382 and 0.618 of the CD leg.
🔎 Why It Works: It traps late traders and captures price exhaustion at natural Fibonacci ratios. Combined with other tools — like VWAP, liquidity zones, and order flow — it becomes a high-conviction strategy. These patterns are most effective on higher timeframes like 4H or daily.
_________________________________
💬 If you found this helpful, drop a like and comment!
Want breakdowns of other charts? Leave your requests below.

#GBPUSD: A strong bullish move incoming, comment your views The price has shown a possible price divergence, which could lead to a long-term move to 1.37. We expect the US dollar to weaken, which will likely push the price of GBPUSD to our target. Key economic data will be released later today and tomorrow, which could shape the price pattern.
Good luck and trade safely!
Team Setupsfx_

DOGEUSDT Buy Long SetupWait for entry, if the tp hits first, then ignore the trade, I will share new entry.

Doge Buy / Long SetupDoge has some Bullish Momentum, Invalidation if 4hrs closes below the mentioned point, then close on entry, otherwise wick doesn't matter. If tp achieved first then Cancel the trade.

Gold intraday waiting to buyGold waiting to buy at 3290-32295, and 32753280 with target 3340 and 3360.
