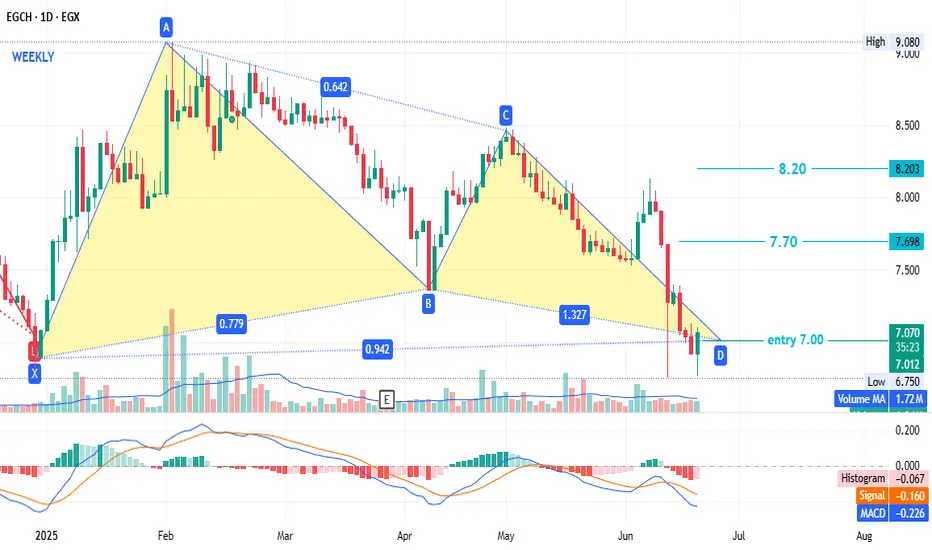
EGCH - old enemy - low riskConsider a long position with the following parameters:
Entry: 7.00
Stop loss: 6.80
Targets: 7.70 (T1), 8.20 (T2)
This is not investment advice but my analysis based on chart data. Consult your account manager before investing. Good luck.
Fibonacci
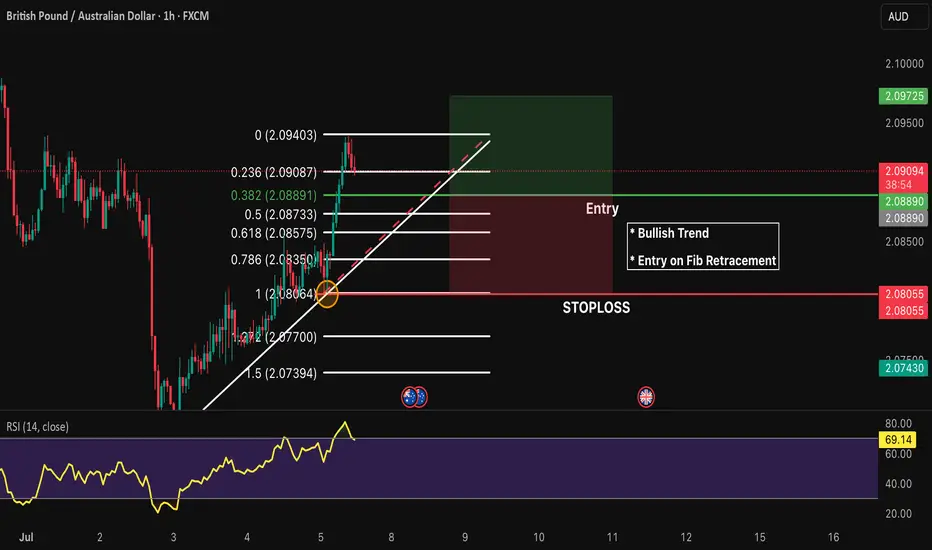
AUD/JPY LONGAUD/JPY LONG "break of a resistance area and retest + 61.8% fib retracement + 50 ema dynamic support "

Bitcoin Bullish Continuation in Progress🔵 Bitcoin Weekly structure confirms higher highs & higher lows, reinforcing the bullish trend.
📈 As long as CRYPTO:BTCUSD holds above key support near $106K, the next leg could target $127K–$143K within the coming 2 months.

AVN can become volcanic anytime...AVN can become volcanic anytime...
Currently, it is in a rising channel, being accumulated slowly in a rising channel.

NQ Power Range Report with FIB Ext - 7/7/2025 SessionCME_MINI:NQU2025
- PR High: 23028.50
- PR Low: 22943.00
- NZ Spread: 191.25
No key scheduled economic events
First full trading day following long holiday weekend
Session Open Stats (As of 12:45 AM 7/7)
- Session Open ATR: 323.71
- Volume: 33K
- Open Int: 271K
- Trend Grade: Neutral
- From BA ATH: -0.6% (Rounded)
Key Levels (Rounded - Think of these as ranges)
- Long: 23239
- Mid: 21525
- Short: 20383
Keep in mind this is not speculation or a prediction. Only a report of the Power Range with Fib extensions for target hunting. Do your DD! You determine your risk tolerance. You are fully capable of making your own decisions.
BA: Back Adjusted
BuZ/BeZ: Bull Zone / Bear Zone
NZ: Neutral Zone

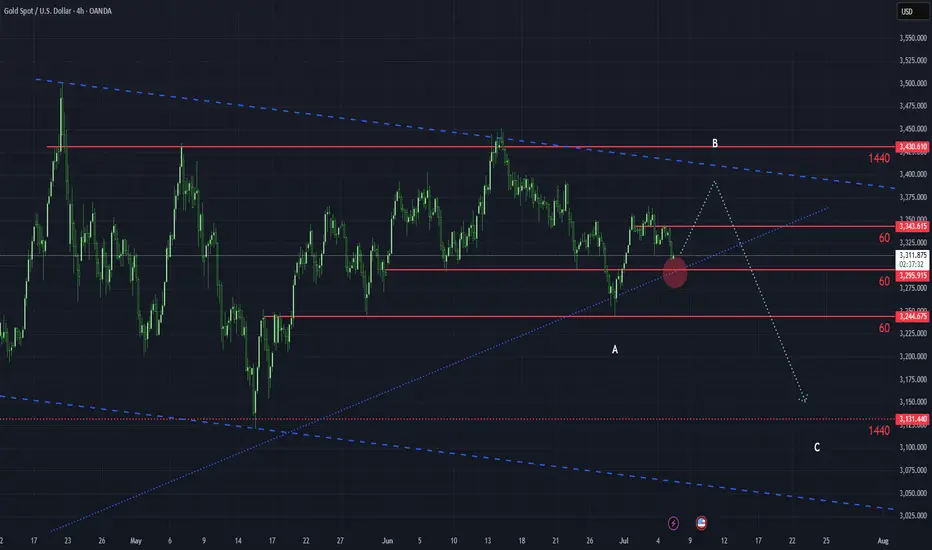
20250707-XAUUSD IdeaAn upward movement is expected at the price level of 3295, followed by a downward continuation after reaching the 0.618 retracement of wave A, completing the ABC wave pattern.
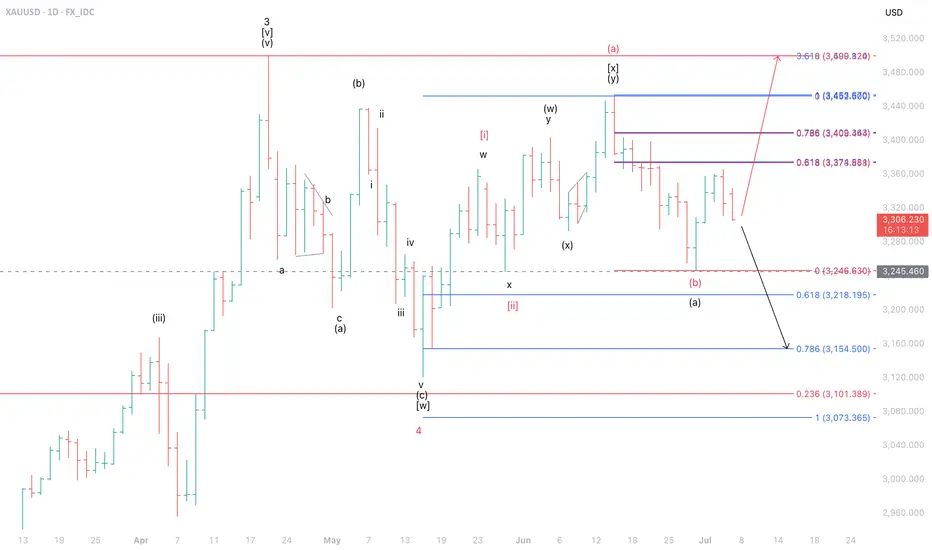
XAUUSD at a CrossroadsOn the daily timeframe, we identify two possible scenarios for XAUUSD. Under the red label, as long as XAUUSD remains above the 3,245 level—serving as a stop-loss—there is potential for further upside to test the 3,378–3,500 area.
However, in the worst-case scenario illustrated by the black label, if XAUUSD breaks below its key support, the next downside target would be in the 3,154–3,218.
DQ heads up into $19: Major Resistance to book some profitsDQ has been flying off our bottom call (see below).
Now testing a major resistance zone at $18.69-18.99
Good spot to book some profits and look for a dip to buy.
.
Previous analysis that called the BOTTOM:
===================================================
.

AIQ heads up at $44.37/67: Double Golden fib zone will be strongAIQ has been floating up towards a Double Golden zone.
$44.37 is a Golden Covid and $44.67 a Golden Genesis fib.
High-Gravity area is likely to hold this in orbit for some time.
.
Previous analysis that caught a PERFECT BREAK OUT:
=======================================================
.

Gold Long: Stop loss at 3305, TP at 3426Over in this video, I did a quick revision on the cycle level Elliott Wave counts for Gold before delving down to the lower timeframes.
I discussed the alternate counts for Gold and explained how the latest 5-waves up made me retain what you see as the primary count. Essentially, what is important over here is that the stop loss is $3305 and the potential take profit is #3426.
Remember to keep your risk tight and good luck in your trading!

JTO : Price at a critical point: Falling or rising?Hello friends
Given the long-term range that this currency has made, the price has now reached the bottom of the range, which is very sensitive, and this currency also has a token release, which can be a warning.
In case of a drop, we have identified important supports for you, so that you can buy with risk and capital management.
*Trade safely with us*

MOVE : Where to buy ?Hello friends
Given the upcoming token release, the price is expected to continue to fall, so be careful.
In case of a fall, we have identified important support levels for you, where you can buy with capital and risk management.
*Trade safely with us*

MINA : Is the shedding over ?Hello friends
Given the heavy fall of this and the prolonged price correction, you can now see that the price is supported within the specified support range, which is a good sign...
We have identified important support areas for you, where you can buy in steps and with risk and capital management.
We have also identified targets.
*Trade safely with us*

ENA : The largest token release...Hello dears
Given the long-term price decline that we have witnessed, it has now been announced that this currency is going to do a token release, which will naturally cause the price to fall, so be careful.
In case of a fall, we have identified important supports for you so that you can buy with risk and capital management.
The target has also been identified.
*Trade safely with us*

BAC – Building the Base for a Breakout?Bank of America (BAC) has been consolidating quietly, attracting attention as it sits near a key mid-range level. With a 52-week low of $33.06 and a 52-week high of $48.08, the stock currently trades around $36.92 – roughly 11% above its low and 23% below its high.
This setup could be the calm before the move.
💥 Technical Outlook & Strategy
With financials holding steady and macro headwinds softening, BAC might offer a solid swing trade or medium-term positioning opportunity.
📌 Entry Points to Watch
$36.90 – Market price, if volume picks up near support
$33.30 – Prior breakout area and potential pullback support
$30.50 – Strong support and near the 52-week low for aggressive buyers
🎯 Target Levels
$39.80 – Short-term resistance; previous rejection zone
$43.50 – Fib retracement from the high, medium-term target
$47.50–48.00 – 52-week high retest, bullish scenario
🧠 Narrative to Watch
With potential Fed pauses on rate hikes, improving margins, and relative stability in U.S. banks, BAC could be positioning for a slow grind higher. Watch for earnings momentum and bond yield trends.
⚠️ Disclaimer
This analysis is for informational and educational purposes only and does not constitute financial advice. Always do your own research or consult with a licensed financial advisor before making trading decisions.

Is Citigroup (C) the Most Undervalued Big Bank Right Now?🔥Let’s talk numbers:
🧮 P/E: 9.78x
💸 P/S: 0.66x
That’s deep value — Wall Street’s sleeping on this one. While everyone's chasing AI, Citigroup is trading at garage sale prices.
🧠 The Setup:
If you're into swing plays with strong R/R and macro upside, C is worth a look.
🔑 Entry Zones: 1️⃣ Market price — for early bulls
2️⃣ $55 — breakout confirmation
3️⃣ $48 — bargain bin steal
🎯 Targets:
TP1: $70 🟢
TP2: $78 🚀
TP3: $84 💰
💬 Why it matters:
Citi has been lagging behind peers like JPM, but it’s still a beast. If the Fed holds or cuts, banks could catch a serious bid — and this one’s ready to pop from a value base.
📌 Watching volume at $55 and any macro shifts as catalysts.
👀 Don’t ignore this one just because it’s not trending. That’s where smart money hides.
📢 Disclaimer:
This is not financial advice. Just sharing ideas and setups I’m watching. Always do your own research and manage your risk.
#Citigroup #C #Undervalu
#Citigroup #C #UndervaluedStocks #SwingTrade #TradingSetup #DeepValue #Banking #PEratio #SmartMoneyMoves #StockMarket #Financials #Watchlist

#btc #btcusd #elliottwave short sell setup wave 4 7Jul25This count is based on my assumptions so anything can happen not a trading or financial advice just for educational purposes only kindly do your own ta thanks trade with care good luck.

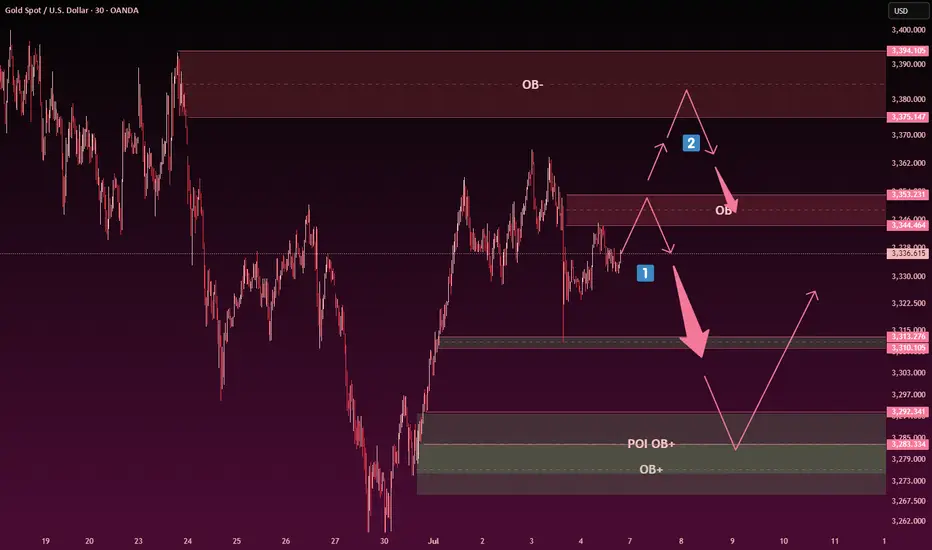
Gold (XAUUSD): Potential Short from Bearish OPotential Short Opportunity After Reaction at OB-
The chart shows a potential short setup on Gold Spot / U.S. Dollar. Price has recently moved upwards, labeled as swing "1", and is approaching a bearish order block (OB-) identified in the $3,344 - $3,353 area.
We could see a reaction at this OB- level, leading to a downward move as indicated by the arrow. The next potential target for this downward move could be the Point of Interest (POI) which aligns with a bullish order block (OB+) around the $3,283 - $3,288 zone.
Alternatively, if price pushes through the initial OB-, the next bearish OB- around $3,375 - $3,385 could act as further resistance, potentially leading to a reversal as shown by swing "2".
Traders could look for confirmation signals around these OB- levels to initiate short positions, targeting the POI OB+ as a primary target. A break below the POI OB+ could open the way for further downside.
Consider price action and volume at the highlighted zones for better entry and exit decisions.
Is BTC getting ready for a new ATH?🔍 1. Key Support and Resistance Levels (Horizontal Lines):
🟢 Resistances (Green Lines):
114,295.54 — strong resistance resulting from previous highs.
112,767.65
111,009.00
110,685.35 — current key level that price may try to retest after a potential breakout.
🔴 Supports (Red Lines):
108,496.55 — current level being tested, also coinciding with local resistance from the past.
107,687.57
105,888.74
102,909.85
100,848.07
98,208.22 — strong long-term support; in the past, this level was reacted with a strong bounce.
🔶 2. Downtrend channel marked with orange lines:
The upper downtrend line acted as resistance.
The lower uptrend line acted as support.
The price recently broke above the upper line, but is now testing it again - this could be a retrospective retest.
➡️ If the close of the H4 candle is above this line - a possible confirmation of the breakout.
📊 3. Stochastic RSI indicator (at the bottom of the chart):
Currently in the uptrend phase after a bounce from the oversold level (<20).
The %K line (blue) is crossed upwards by the %D line (orange) - a bullish signal.
Still below the overbought zone, which suggests that the potential uptrend still has room to develop.
🧠 4. Market structure and price action:
Price broke above the 108.496 level, but is currently struggling to stay above this zone.
A retest of the broken triangle could be a healthy move, provided that support is maintained in the 108k–107.6k area.
A break below and a close below 107.6k could mean a false breakout and a possible decline towards 105.8k or even 102.9k.
🧭 5. Possible scenarios:
✅ Bullish scenario:
Maintaining the 108.496 level and closing the candle above the upper orange line → continued growth.
The nearest targets are:
110.685 (first resistance),
111.009 and 112.767 next.
❌ Bearish scenario:
The price will not stay above 108k and will fall below 107.687.
Possible return to the previous consolidation range with the target:
105.888,
and then 102.909 or 100.848.
🧮 Summary:
Currently, the decisive moment is underway: a test of support after breaking out of the convergent triangle.
The Stoch RSI indicator gives a bullish signal, but the price must confirm the movement by behaving above 108k.
Retest and bounce - this is a bullish scenario.
A breakdown and return under the trend line - means that the breakout was false.

XAUUSD SELLthe setup has been given with all the necessary analysis given .
follow and support for more analysis .
Thank you !

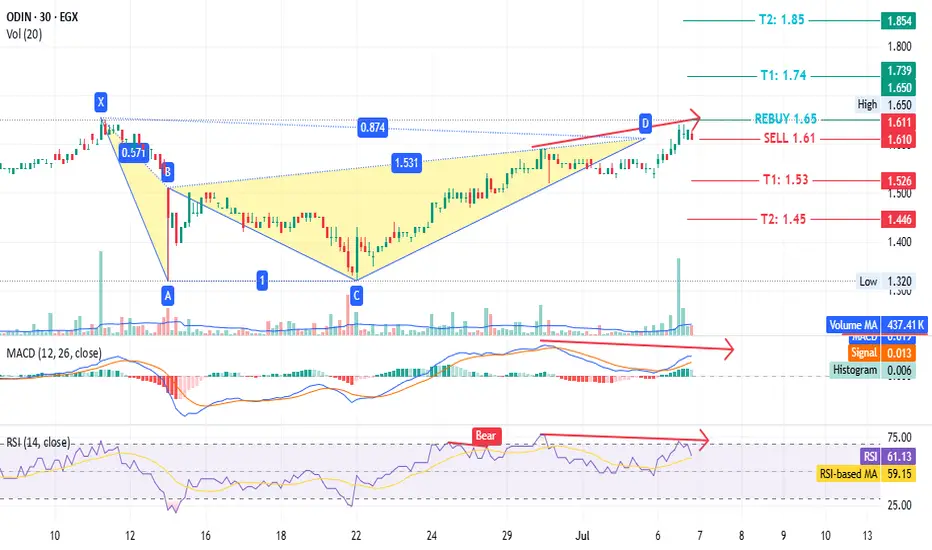
ODIN - confused but easy NGM:ODIN timeframe: 1 hour
Identified a bearish Gartley pattern with:
- Sell point: 1.61
- Targets: T1 at 1.53, T2 at 1.45
- Stop loss/rebuy: 1.65
If rebuy is triggered:
- New targets: T1 at 1.74, T2 at 1.85
- Stop loss: 1.61
MACD and RSI indicators do not support the recent price rise, aligning with the bearish pattern.
Disclaimer: This is not investment advice, only an analysis based on chart data. Consult your account manager before making any decisions. Good luck.
XAUUSD Elliotwaves update: Is wave 4 complete?The view we had in past three weeks was a possibility of complex 4th wave and our short term bias was bearish. But price reacted and closed above 61.8 Fibonacci retracement level and therefore changed our bias to bullish(Technically 4th wave is complete). Another confluence was a clear 5 waves after the reaction on the 61.8 fib. Now two possibilities, either wave 2 is complete and we should expect price to continue up from current price level or a possibility of double 3 to push price down to atleast 61.8 Fib before continuation to the upside. To take advantage of this anticipated move a trader should either wait for price to drop to the golden zone or wait for price to breach the immediate high and retest.
