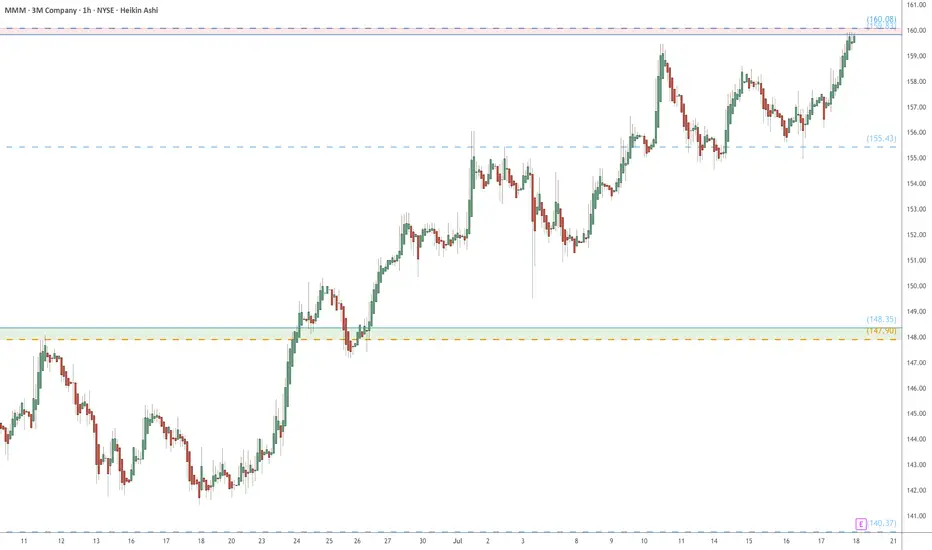
MMM eyes on $160: Resistance Zone waiting for Earnings reportMMM has been crawling off a decade long bottom.
Testing a significant resistance at $159.83-160.08
Earnings report tomorrow, so a key 24 hours here.
.
Previous analysis that caught the BREAK OUT:
Hit the BOOST and FOLLOW for more PRECISE and TIMELY charts.
========================================================
.
Fibonacci
Elliott Wave Analysis: SPY Poised To Extend Higher In Bullish SeElliott Wave sequence in SPY (S&P 500 ETF) suggest bullish sequence in progress started from 4.07.2025 low. It expects two or few more highs to extend the impulse sequence from April-2025, while dips remain above 6.23.2025 low. SPY ended the daily corrective pullback in 3 swings at 480 low on 4.07.2025 low from February-2025 peak. Above there, it favors upside in bullish impulse sequence as broke above February-2025 high. Currently, it favors wave 3 of (1) & expect one more push higher from 7.16.2025 low in to 630.31 – 651.1 area before correcting in wave 4. In 4-hour, it placed 1 at 596.05 high, 2 at 573.26 low as shallow connector & extend higher in 3. Within 3, it placed ((i)) at 606.40 high, ((ii)) at 591.89 low, ((iii)) at 627.97 high & ((iv)) at 618.05 low.
In 1-hour above ((ii)) low of 591.89 low, it ended (i) at 605.96 high, (ii) at 603.17 low, (iii) at 626.87 high as extended move, (iv) at 620 low & (v) as ((iii)) at 627.97 high. Wave ((iv)) ended in 3 swing pullback as shallow connector slightly below 0.236 Fibonacci retracement of ((iii)). Within ((iii)), it ended (a) at 619.8 low, (b) at 624.12 high & (c) at 618.05 low on 7.16.2025 low (this week). Above there, it favors rally in ((v)) of 3 targeting in to 630.31 – 651.1 area before correcting in 4. Within ((v)), it placed (i) at 624.73 high, (ii) at 623.08 low & favors upside in (iii) of ((v)). We like to buy the pullback in clear 3, 7 or 11 swings correction at extreme area in 4 and later in (2) pullback, once finished (1) in 5 swings.

BTC for long *The content on this analysis is subject to change at any time without notice, and is provided for the sole purpose of assisting traders to make independent investment decisions.

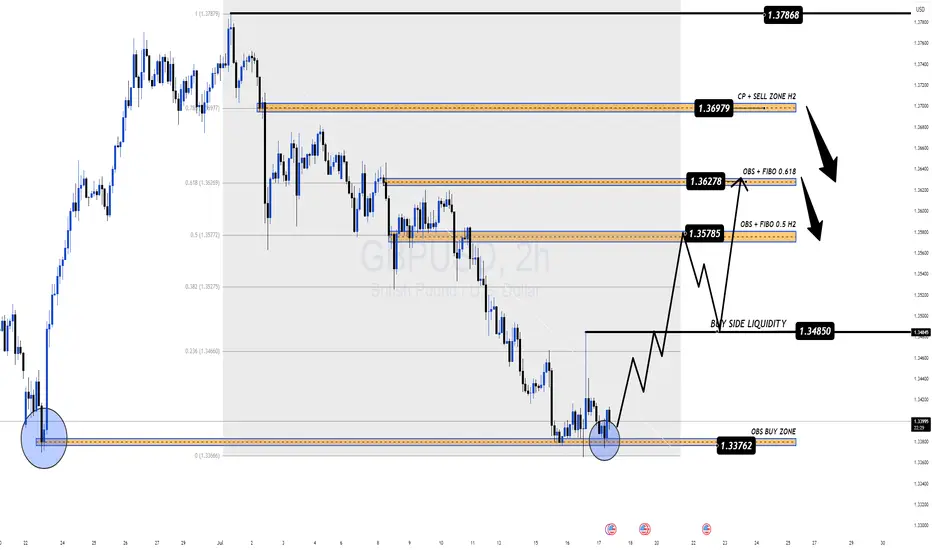
Sterling Rebounds But Faces Heavy Resistance Ahead GBP/USD Outlook – Sterling Rebounds But Faces Heavy Resistance Ahead
🌐 Macro Insight – UK Labour Data Mixed, Trump Headlines Stir Market
The British Pound (GBP) regained some lost ground against the U.S. Dollar after the UK labour market data revealed mixed signals:
Wage growth cooled as expected, suggesting a potential easing in inflationary pressures.
UK ILO Unemployment ticked up to 4.7%, raising concerns about labour market fragility.
Meanwhile, in the U.S., President Trump denied reports about firing Fed Chair Powell, briefly easing tensions and stabilizing USD demand.
With both currencies facing mixed narratives, GBP/USD is set for a pivotal move, and traders should stay alert to key liquidity zones and order blocks.
🔍 Technical Setup – MMF + Smart Money Framework
On the H2 chart, GBP/USD has reacted from the OBS BUY ZONE at 1.3376, bouncing with a bullish structure and forming a potential continuation pattern. Price is now expected to target key zones above, where significant order blocks and Fibonacci confluence reside.
⚙️ Key Resistance Zones:
1.3578 – 0.5 Fibonacci Retracement + OBS
1.3627 – 0.618 Fibonacci + Supply Zone
1.3697 – CP Continuation Pattern + H2 Order Block
These areas represent institutional interest for potential sell setups.
✅ Trade Plan for GBP/USD
🟢 BUY ZONE: 1.3376 – 1.3398
SL: 1.3360
TP: 1.3450 → 1.3485 → 1.3530 → 1.3578 → 1.3627
Look for bullish structure confirmation before entering. Target the next liquidity highs and imbalance zones.
🔴 SELL ZONE: 1.3627 – 1.3697
SL: 1.3735
TP: 1.3580 → 1.3530 → 1.3480
Watch for rejection and bearish divergence at supply areas to time potential swing shorts.
🧠 Strategy Notes
This setup combines MMF zones with institutional volume and price action concepts. The pair is currently reacting to a deep discount zone and may climb toward premium levels where selling pressure awaits. Be cautious during New York session volatility, especially with potential U.S. policy headlines and upcoming global inflation data.
🗨 What’s Next?
Are bulls ready to reclaim control or will resistance zones cap this recovery? Drop your ideas below and don’t forget to follow for more institutional-grade insights powered by MMF methodology.
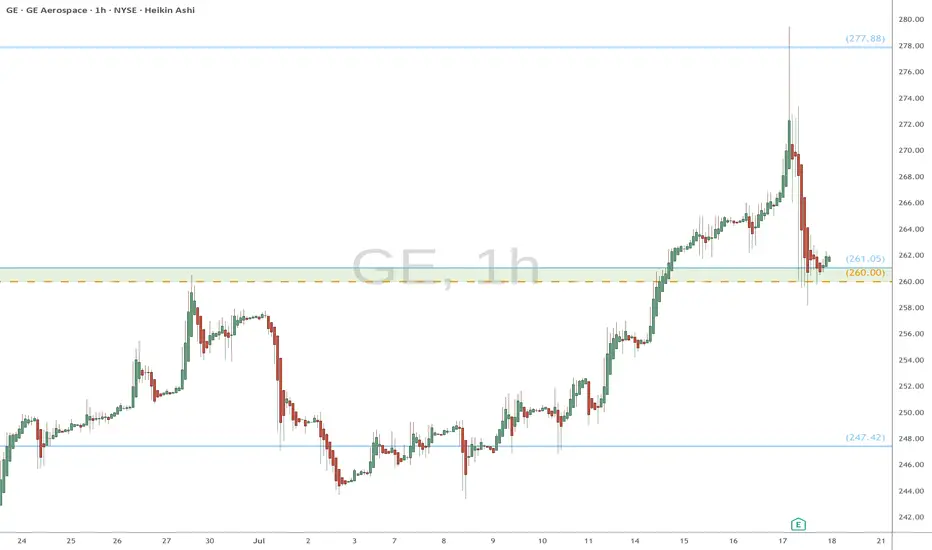
GE watch $260-261: Key support to maintain strong UptrendGE has been in a strong uptrend for a couple of years now.
Earnings report dropped it to support zone at $260.00-261.05
This zone is now clearly visible to everyon, so Do-or-Die here.
Long entry here with tight stop loss just below zone.
======================================================
.
$ETH Ethereum Market Outlook – July 2025Ethereum Market Outlook – July 2025
Brought to you by ProfessorXtrader
🚀 Ethereum Breakout Confirms Multi-Year Bullish Setup
Ethereum ( CRYPTOCAP:ETH ) has officially broken out of a multi-year consolidation range, signaling a strong bullish cycle ahead. With the current price sitting at $3,645.50, ETH has posted a remarkable 46.65% monthly gain as of July 18, 2025.
This move sets the stage for a multi-tiered upside potential — here’s what the chart is telling us.
📊 Key Levels & Targets
🔸 Previous Consolidation Range (2018–2021)
ETH spent over three years capped under the ~$4,884 level, forming a solid accumulation base.
🔸 Breakout Zone
Support: $1,150 – $1,250
Confirmation of Cycle Shift: Price now trading well above breakout zone.
🎯 Upside Targets (Ethereum)
1st Target:
📍 Price: $7,387.56
📈 Potential Gain: ~100%+ from breakout zone
2nd Target:
📍 Price: $11,394.14
📈 Potential Gain: ~180%
Final Exit (Major Reversal Zone):
📍 Price Range: $15,443.81 – $15,477.64
🚨 Total Gain Potential: ~280% from breakout
📌 The area between $15.4K to $18K is marked as the Major Reversal Zone, a region where profit-taking and trend exhaustion are highly likely.
📈 Market Interpretation
Bullish Breakout: Long-term resistance is now support.
Volume & Momentum: Strong monthly candle with expanding volatility confirms conviction.
Structure: Targets are based on clean technical projections, Fibonacci expansions, and market psychology.
🔔 What to Watch Next
📅 Monthly Close above current levels will confirm the breakout.
🔍 Monitor for rejection signals near the first target.
📉 Place trailing stops as we approach the major reversal zone.
💡 Pro Tip from ProfessorXtrader
"The biggest profits in crypto are made during clean breakouts from multi-year ranges. ETH is entering that phase now — plan your targets and protect your capital as you climb."

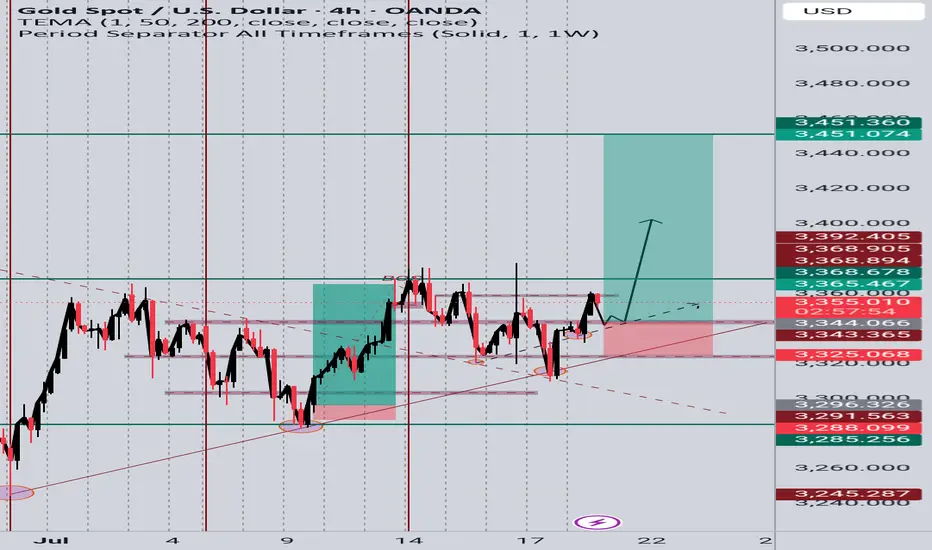
GOLD (XAUUSD) Long Idea – Breakout Confirmation📆 Timeframe: 4H
📈 Type: Long (Buy)
🎯 Entry: Around 3348-3355
🎯 Target: 3451
NOTE: Price has respected the ascending trendline from early July.
Clean breakout from a consolidation range after several rejections near 3365 resistance.
Bullish structure confirmed with higher lows and higher highs.
Fibonacci levels and support zone at ~3344 are holding strong.
Targets set at prior resistance zone (~3451), aligning with liquidity zone.
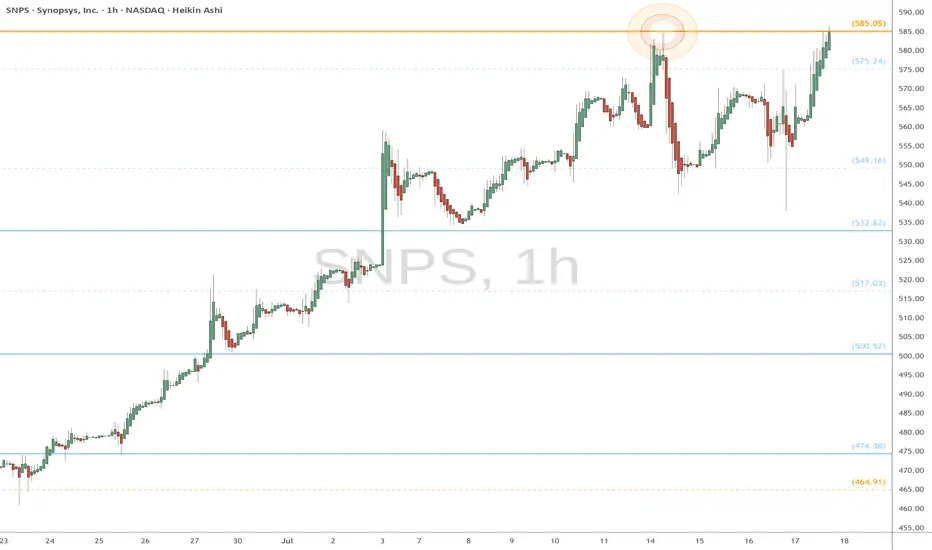
SNPS eyes on $585.05: Golden Genesis break should RUN strongSNPS back to a Golden Genesis that caused last dip.
Current stance and market winds favor break and run.
$585.05 will be key for entries and tight stop losses.
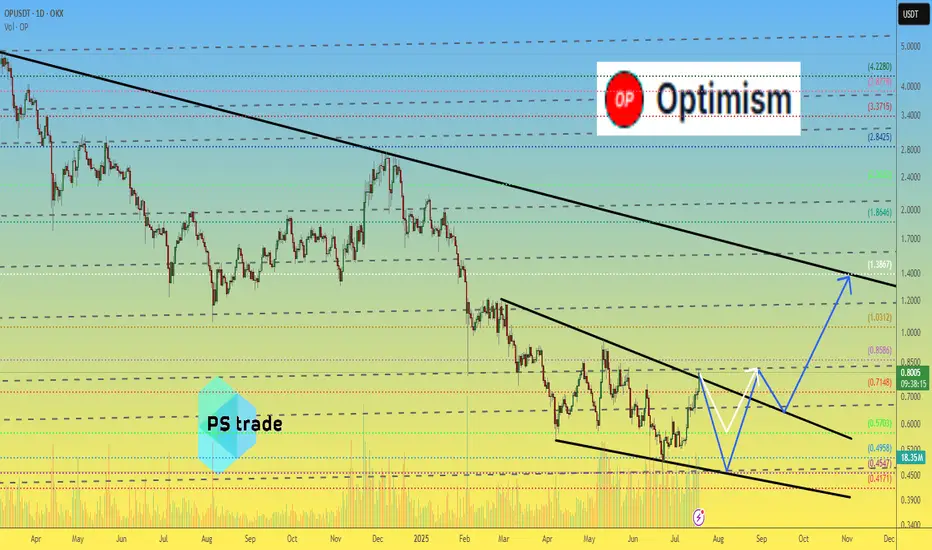
Optimism OP price analysisCurrently, the price of #OP does not look very optimistic (a little pun to start with )))
🟢 An optimistic forecast would be for the price of OKX:OPUSDT to rise to $1.40
🟡 But it looks like this growth will not happen now, but after a correction.
🔴 Correction: only to $0.57 or again to $0.45 — this is also an open question.
👌 Patience to holders and fans of the #Optimism project, the “microclimate” in the crypto market is improving — the time will come, and this coin will also be pumping...
_____________________
Did you like our analysis? Leave a comment, like, and follow to get more
EURUSD Bullish Continuation OutlookFX:EURUSD has been trading in a bullish trend. Currently price is retesting the previous resistance level, as well as 0.618 fib. Hidden bullish divergence can be observed on the chart, in addition to regular bullish divergence on lower timeframes (1 & 4 hour).
I am expecting bullish continuation from here to complete the price projections!

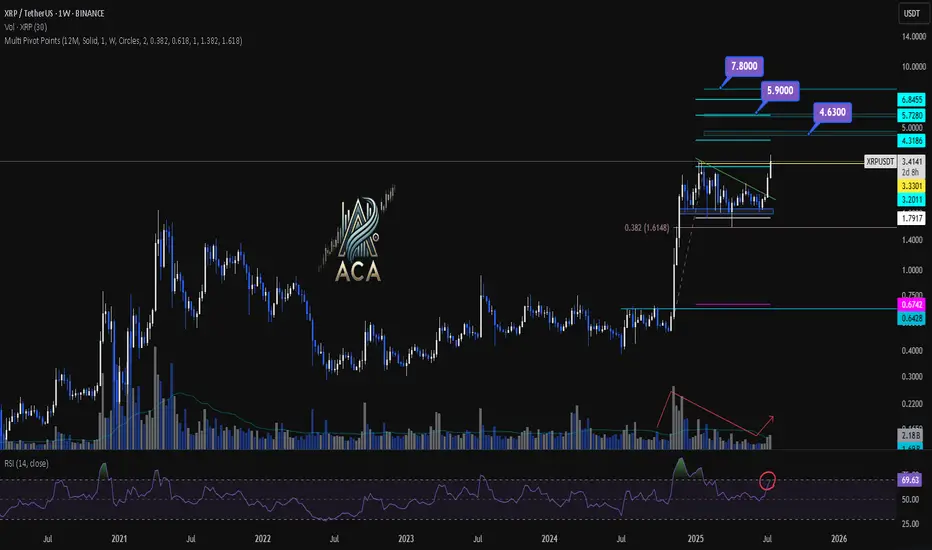
XRPUSDT Weekly Chart Analysis | Next Bullish MoveXRPUSDT Weekly Chart Analysis | Major Resistance Levels Align for Next Bullish Move
🔍 Let’s break down the XRP/USDT weekly setup, highlighting key technical signals and major upside targets for the next rally.
⏳ Weekly Overview
The weekly chart shows consolidation just below a major resistance, with price action tightening and preparing for a breakout. A recent correction found support near the 0.382 Fibonacci retracement level, which has acted as a springboard for renewed momentum. Notably, the R2 pivot point level aligns closely with this area, strengthening its importance as a decision zone for bulls.
🔺 Upside Targets & Confluences:
- First Target: $4.63 — This coincides with the R2 monthly pivot point and aligns with key Fibonacci extension targets, offering strong confluence for a reaction zone.
- Second Target: $5.90 — Our most realistic medium-term target, also backed by cluster resistance from both pivot analysis and fib projections.
- Final Target: $7.80 — This is the major Fibonacci extension level, marking the highest projected upside if momentum persists.
📊 Key Technical Highlights:
- Pivot Point R2 & Fibonacci Confluence: The R2 level reinforces a critical resistance, overlapping with the $4.63 Fibonacci target.
- Fibonacci Retracement: Price respected the 0.382 retracement during the latest correction, signaling healthy trend continuation.
- Volume Confirmation: An uptick in volume confirms that buyers are stepping in, supporting the bullish momentum.
- RSI Signal: RSI is entering the overbought zone, which typically indicates a strong surge in buying pressure and can mark the start of a momentum move.
🚨 Conclusion:
XRP is setting up for a major breakout as key technical levels align. Watch for a sustained move above $4.63 to unlock the $5.90 area, with a final potential push towards $7.80 if bulls maintain control. Volume expansion and an overheated RSI are both classic signs of an incoming momentum wave—keep your eyes on these levels for validation of the setup.
AAPL Set for a Breakout? | Technical Checklist & Projections
▍Observation & Context
▪ AAPL has been moving sideways within a clearly defined range for the past three months .
▪ On July 07 , price tested the range resistance decisively, showing some interest in the upside.
→ Let's first explore the bullish breakout scenario.
▍What Makes a Good Breakout ?
Before we talk about targets, let’s define what a good breakout looks like:
▪ A strong bullish candle breaking through the resistance in one clean move .
▪ Followed by a retest of the broken resistance (now acting as support).
▪ After that, price should ideally:
1. Form a higher low , and
2. Reach the next resistance or target zone before pulling back.
▍Target Price – Method 1: Extension of the Range
🔹 Near-Term Target: 1.5–1.618x Fibonacci Extension
- A common zone where momentum often pauses.
- Aligns with the previous high from the last downtrend.
- Technically, to reverse a trend, price needs to take out the previous high. Even though the range has “cooled off” the pressure, we still respect that level.
🔹 Ultimate Target: 2x Range Extension
- Represents a 100% projection of the previous range.
- Commonly used in range breakout targets.
🔹 Dream Target: 2.618x Fibonacci Extension
- Aligns with the start of the last downtrend , adding significance to the level.
- Often marks the exhaustion point of strong trends.
▍Target Price – Method 2: Projection from Higher Low
Note: The new higher low is not yet confirmed at the time of writing. The levels below assume an upward breakout without dropping below 207.22 . However, the same logic can be applied once the higher low forms.
🔹 Near-Term Target: Same as Method 1
🔹 Ultimate Target: 100% Projection of Prior Swing
- Projecting the prior swing (from previous low to recent high) from the new higher low .
- This level also aligns with the 1.5–1.618x Fibonacci extension of that swing, increasing its significance.
🔹 Dream Target: Another 100% projection
- Rare, but happens when momentum is very strong .
- In such cases, price might skip any retracement and launch directly into a second leg , equal to the previous swing.
- Here, the level aligns perfectly with the start of the last downtrend , just like the 2.618x extension in Method 1.
▋Mental Notes
▪ No one knows for sure if the breakout will be real or fake. But when it happens, knowing what to look for and where price might go next gives us a clear plan of action .
▪ The market will always find ways to surprise. Stay open and follow the flow.
▋Not Financial Advice
The information contained in this article is not intended as, and should not be understood as financial advice. You should take independent financial advice from a professional who is aware of the facts and circumstances of your individual situation.

DDOG eyes on $116.34: Golden Genesis fib to determine the TrendDDOG bounce just hit a Golden Genesis at $116.34
The sister Goldens above and below marked extremes.
This one could mark the orbital center for some time.
It is PROBABLE that we orbit this fib a few times.
It is POSSIBLE that we see a pullback from here.
It is PLAUSIBLE but unlikely to continue non-stop.
===============================================
.

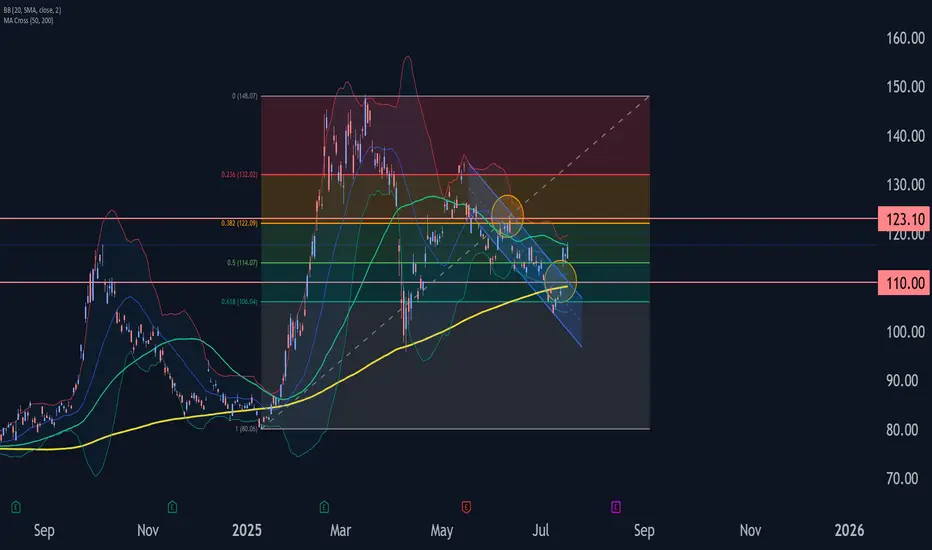
Alibaba Group Wave Analysis – 17 July 2025
- Alibaba Group rising inside impulse wave (3)
- Likely to reach resistance level 123.10
Alibaba Group recently rose with a sharp upward gap, breaking the resistance level 110.00 and the resistance trendline of the daily down channel from May.
The breakout of these resistance levels accelerated the active intermediate impulse wave (3).
Alibaba Group can be expected to rise to the next resistance level 123.10 (the former monthly high and top of wave B from June).
TOTAL3 exc BTCÐTOTAL3 is at the all-time high again and pushing to break that.
according to previous cycles the 1.414% of Fibonacci retracement at $1.98T is the top & timing of before the end of November 2025

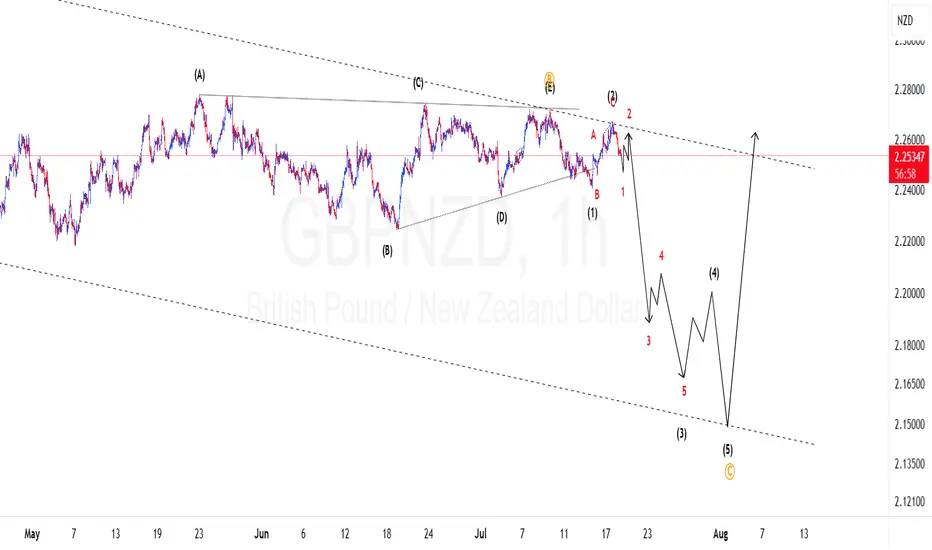
GBPNZD Elliotwaves update: Are Bears still on control?We have been on this in the past two weeks and now we can see clear signs of bears controlling the price. We had a triangle correction completed and made an impulsive wave to the downside which confirmed our bias. Now are are on the first wave of wave 3 and we should anticipate momentum to the downside to increase. To take advantage of the drop one should find areas where price might find resistance and other confluences like Fibonacci to take a trade.
The AI Boom's Unsung HeroThe rise of artificial intelligence isn’t just shaking up tech companies it’s quietly transforming the global silver market in a big way. As major players like NVIDIA, Google and others ramp up their AI infrastructure silver is becoming more critical than ever. Why? Because silver, thanks to its unmatched electrical conductivity, plays a key role in powering the hardware behind AI.
Silver is the most conductive metal on Earth. That makes it perfect for high-performance computing something AI needs a lot of. It’s especially important in data centers and advanced semiconductors, where both electrical and thermal performance are mission-critical.
What’s really interesting is that AI servers tend to use two to three times more silver than traditional data center servers. That’s because AI workloads are more power-hungry, generate more heat and require more complex cooling and electrical systems. Simply put, more AI means more silver.
If there’s one company at the heart of this trend it’s NVIDIA. Analysts at Morgan Stanley expect NVIDIA to consume a staggering 77% of all silicon wafers used for AI accelerators in 2025 up from 51% in 2024. That adds up to around 535,000 300-mm wafers a year each of which contains silver in key components.
All of this AI growth is showing up in the numbers. Industrial silver demand hit an all-time high of 680.5 million ounces in 2024. The electronics industry alone uses around 250 million ounces per year and AI is now the fastest-growing part of that.
Despite all this demand, silver supply just isn’t keeping up. The market’s been in deficit for four straight years, with a total shortfall of 678 million ounces between 2021 and 2024. That’s roughly ten months of global mine output gone missing from the balance sheet.
It’s no surprise, then, that silver prices have been climbing fast. As of July 2025 silver’s up nearly 30% for the year. Looking further ahead I see room for silver to keep climbing:
In the short term (2025): $36–$42 per ounce seems realistic
By 2026: Potential for $50+ as more AI growth stays strong
AI isn’t just changing how we work, communicate, or compute—it’s literally reshaping the commodities that make this technology possible. Silver, once thought of mainly in the context of jewelry or coins, is now a backbone material for the AI revolution.

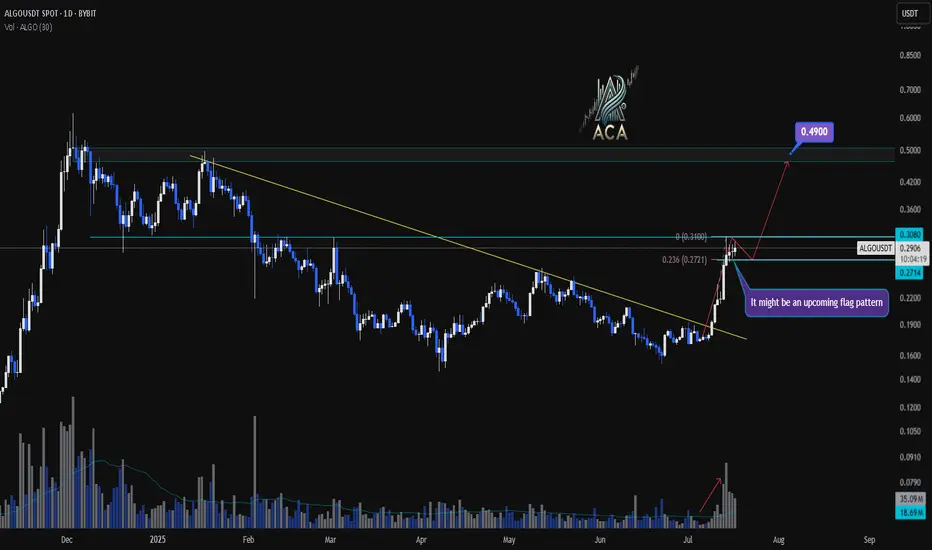
ALGOUSDT Daily Chart Analysis | Continuational patternsALGOUSDT Daily Chart Analysis | Momentum Picks Up on Higher Timeframe
🔍 Let’s break down the latest ALGO/USDT daily chart, highlighting a shift in market structure and key bullish signals.
⏳ Daily Overview
A decisive breakout above the long-standing descending trendline has flipped the narrative for ALGOUSDT. Increased volume during the breakout points to robust bullish momentum, suggesting buyers are regaining control at this multi-month inflection point.
🔔 Flag Pattern & Chart Structure
- Bullish flag pattern is emerging after the recent breakout, as price consolidates in a tight range—a classic continuation formation.
- Former trendline resistance is now acting as support, confirming a notable shift on the higher timeframe.
📐 Fibonacci & Target Levels
- The 0.236 Fibonacci retracement at $0.2771 is providing immediate support, with price consolidating above this anchor level.
- Upside targets:
- First resistance at $0.3080, which aligns with horizontal supply and previous pivot highs.
- If the flag pattern resolves upward, the next Fibonacci extension points to $0.4900, marking a significant confluence and potential for further gains.
📊 Key Highlights
- Strong daily candle and surging volume confirm momentum shift.
- Watch the developing flag pattern for breakout confirmation.
- Major trendline break on the daily signals structural reversal.
- $0.3080 is the immediate target; $0.4900 is the extended objective from the flag/Fibonacci alignment.
🚨 Conclusion
ALGOUSDT is setting up a compelling bullish scenario—keep a close eye on price behavior at the flag and $0.3080 level. A breakout may trigger the next impulsive move toward $0.4900.
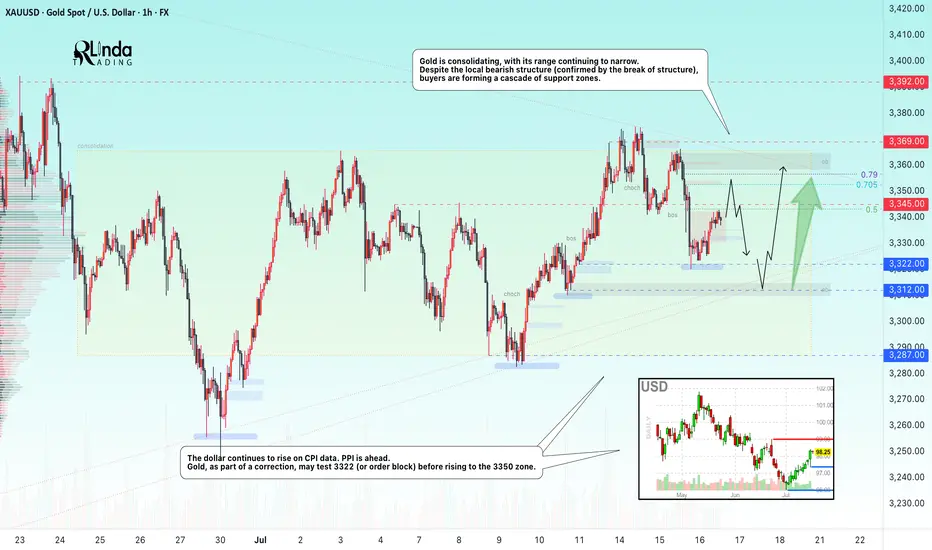
GOLD → Borders are shrinking. Consolidation continues...FX:XAUUSD is adjusting amid controversial CPI data and confirming the local bearish market structure. The PPI is ahead, and gold is consolidating, with its boundaries continuing to narrow...
Gold is recovering slightly but remains under pressure amid rising bond yields and a stronger US dollar. Higher inflation in the US reduces the chances of a quick Fed rate cut. Traders are cautious ahead of the PPI data release. If producer inflation exceeds forecasts, the dollar may rise again, putting further pressure on gold
Technically, we see consolidation in a symmetrical triangle pattern. Trading within the consolidation has a negative side - low volatility and unpredictable movements. The purpose of such movements is accumulation. However, decisions can be made based on relatively strong levels. In the current situation, we are seeing a rebound from 0.5 Fibonacci (I do not rule out a retest of the 0.7 zone before correction). The price may head towards the liquidity zone of 3322 before rising to the upper boundary of the consolidation and the zone of interest of 3350-3360.
Resistance levels: 3345, 3353, 3369
Support levels: 3322, 3312, 3287
The problem is that the price is in a consolidation phase. That is, technically, it is standing still and moving between local levels. You can trade relative to the indicated levels. Focus on PPI data. At the moment, gold is in the middle of a triangle and is likely to continue trading within the boundaries of a narrowing channel due to uncertainty...
Best regards, R. Linda!
$PENGU Taking a Breather? CSECY:PENGU Taking a Breather? Wave 4 May Be Brewing
After a strong move, CSECY:PENGU looks like it might be pausing for breath. The recent action suggests we may have just wrapped up a small-degree Wave 3, with price now struggling to clear a key resistance level from earlier in the structure.
That hesitation could mark the early stages of a Wave 4 correction...Conservatively.
Here’s the zone I’m watching for a potential W4 pullback:
- .236 to 50% retracement of Wave 3, measured from the Wave 2 low
- Most Likely Target (MLT) sits right around the .382 fib
- Keep an eye on time symmetry—Wave 4 may offset the time duration of Wave 2
- Price could react off the base channel as a support guide
If this is a W4, it could give us a clean continuation setup into Wave 5—provided it holds structure and doesn’t overlap the Wave 1 territory. Stalking the pullback as it plays out, and am ready to react if we see support step in at the expected fib levels or the base channel.
Trade Safe!
Trade Clarity!

Bitcoin Dominance BTC.D analysisCurrently, the maximum of BTC.D was 65.38% and the absolute maximum is very close, and then the capital will start flowing into altcoins.
We will have to keep a close eye on where the capital will go: only to highly liquid altcoins, or to a certain industry, or to a narrative, as it was before: “defi”, “memecoin”, and so on...
Do you have any ideas where the capital can go? Write in the comments!
❗️ Also, it is worth noting that such a popular term as "alt-season" lasts less and less, and you have to wait longer and longer for it!
It seems that this time the "alt-season" has every chance to last until the end of 2025, and then... it will be seen. Perhaps the market will gain capital and new powerful players who will set a new vector and new rules by 2028....
But first... we have to live to see it!)
_____________________
Did you like our analysis? Leave a comment, like, and follow to get more

Germany 40 – Preparing For A Short Term Range BreakoutTariff worries, including new comments from President Trump stating that he is likely to impose fresh import charges on pharmaceuticals, have continued to dominate the thinking of Germany 40 traders this week. This has lead to some choppy price action for the index, which after opening on Monday at 24140, has bounced between a Tuesday high of 24293 and a Wednesday low of 23923, before settling back into the middle of that range.
Throw into the mix, the start of Q2 earnings season for European corporates and an upcoming ECB interest rate decision in a week's time and you can see how price action could become increasingly volatile moving forward into the end of July.
Earnings season has so far got off to a slow start in Europe and Germany 40 traders may have to wait until SAP, the company carrying the highest market capitalisation ($352 billion) and index weighting (14.5%), reports its results next Tuesday (after the close) for further insight into where prices may move next.
In terms of the ECB rate decision next Thursday (July 24th), market expectations may currently be indicating that another rate cut is unlikely, although it could be a close call. Traders seem to be focusing on recent commentary from policymakers which suggests the balance of power for the time being has shifted to the more hawkish committee members, who have stated that with inflation sitting on the central bank's target of 2% there is no need to cut rates further. Choosing instead to wait for more clarity on the outcome of trade negotiations with the US, which could decide whether a trade war between the world's first and third biggest economies may be something they need to navigate.
Technical Update: Assessing Current Pirce Action
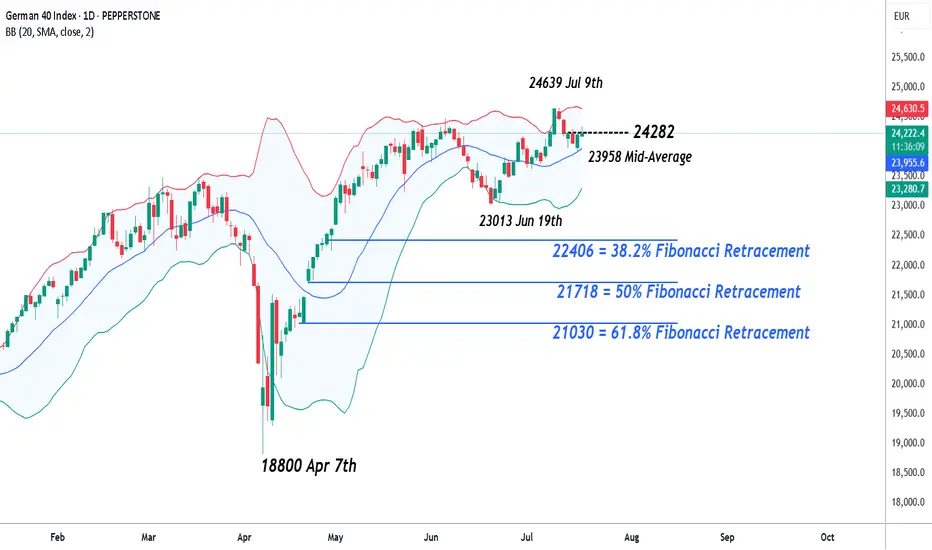
Having posted a new all-time high at 24639 on July 9th the Germany 40 index has entered a corrective period in price. However, while much will depend on future market sentiment and price trends, traders may well be asking, whether current price declines can develop into a more extended phase of weakness, or if the downside move could be limited as buyers return once again.
Time will tell, but in the meantime, technical analysis may help pinpoint potential support and resistance levels which can aid traders in establishing the next possible trends and directional risks.
Potential Support Levels:
Having recently posted a new all-time high at 24639, it might be argued this is still a positive price trend, especially as the Bollinger mid-average is currently rising. The mid-average stands at 23954, so may mark the first support focus for traders over coming sessions.
However, if closing breaks of this 23954 level materialise, it might lead towards a further phase of price weakness towards 23013, the June 19th session low, even 22406, which is the 38.2% Fibonacci retracement of April to July 2025 price strength.
Potential Resistance Levels:
If the 23954 mid-average successfully holds the current price setback, it could prompt further attempts to extend recent strength.
The first resistance might then stand at 24282, which is equal to half of the latest weakness, with successful closing breaks above this level possibly opening scope back to the 24639 all-time high and maybe further, if this in turn gives way.
The material provided here has not been prepared accordance with legal requirements designed to promote the independence of investment research and as such is considered to be a marketing communication. Whilst it is not subject to any prohibition on dealing ahead of the dissemination of investment research, we will not seek to take any advantage before providing it to our clients.
Pepperstone doesn’t represent that the material provided here is accurate, current or complete, and therefore shouldn’t be relied upon as such. The information, whether from a third party or not, isn’t to be considered as a recommendation; or an offer to buy or sell; or the solicitation of an offer to buy or sell any security, financial product or instrument; or to participate in any particular trading strategy. It does not take into account readers’ financial situation or investment objectives. We advise any readers of this content to seek their own advice. Without the approval of Pepperstone, reproduction or redistribution of this information isn’t permitted.
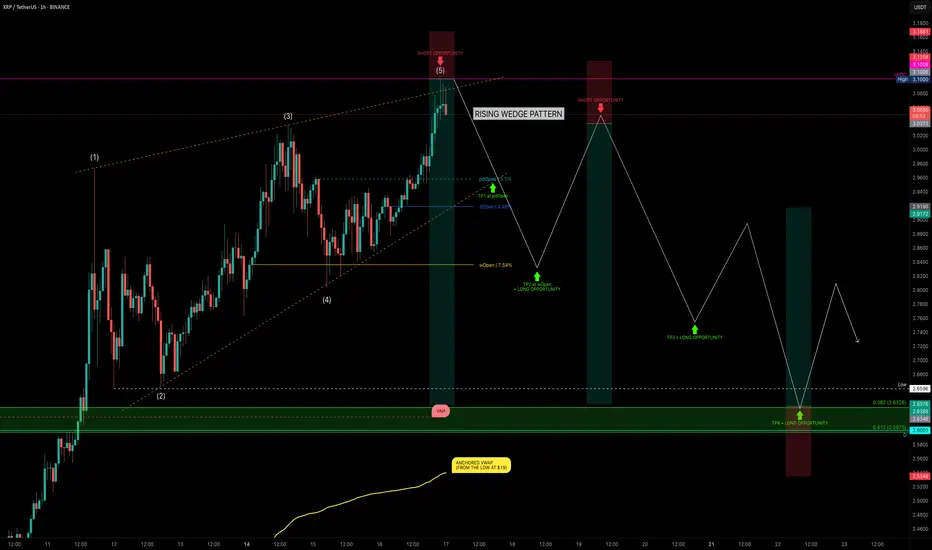
XRP Hits $3.10 — Rising Wedge or Ready to Fly?XRP has been on a strong run over the past 24 days, rallying from $1.90 → $3.10 — a +62% price increase. But after hitting key resistance, is XRP about to correct, or will it break out further? Let’s dive into the technicals.
🧩 Market Structure
Rising Wedge Pattern:
The current market structure resembles a rising wedge, with XRP likely completing wave 5.
Rejection Zone Hit:
Price tapped the nPOC at $3.10 and rejected — providing a clean short opportunity.
📉 Key Support Levels & Confluences
Taking the full 24-day bullish move:
0.382 Fib Retracement: $2.6326 — aligns with liquidity pool below the $2.6596 swing low.
226-day Trading Range VAH: ~$2.62 (red dashed line) — adds confluence.
Daily Level: $2.60 — further support.
Anchored VWAP from $1.90 Low: ~$2.54 (rising over time).
✅ Conclusion: The $2.66–$2.60 zone is a critical support area and offers a solid long opportunity.
Trade Setups
🔴 Short Setup (After Breakdown Confirmation):
Wait for a sell-off & breakdown of the wedge.
Ideal entry: retest of the lower wedge edge, ideal short entry would be between 0.618–0.786 fib retracement.
🟢 Long Setup:
Entry Zone: $2.66–$2.60
SL: below VWAP line
Target: Fib 0.618 as TP
🧠 Educational Insight: Rising Wedges Explained
A rising wedge is a bearish pattern, often signalling weakening momentum as price climbs within narrowing highs and lows.
Key points:
➡️ Volume typically declines as the wedge matures.
➡️ Breakdown below the lower wedge edge often triggers stronger sell-offs.
➡️ Retests of the broken wedge support turn into ideal short entries.
Pro tip: Combine wedge patterns with fib retracement zones and VWAP levels for higher-confidence setups.
Watch for wedge breakdown confirmation before shorting.
_________________________________
💬 If you found this helpful, drop a like and comment!
Want breakdowns of other charts? Leave your requests below.