moodeng buy setup scalp & swingIf btc stays sideways till fri-sat it can hit swing tp, also during eid days I won't recommend you to take any trade due to dry volume, less volatility. It's a meme token so use tight sl and don't use high margin on this trade. Good Luck.
Fibonacci

ENAUSDT Long / Buy SetupOn lower tf ena showing bullish momentum, while previous setups went bad due to war, but ena still holding the previous marked area, this is a short term setup not long term, still expecting another low for whole market. Will share swing setups if found strong momentum. Must use SL as btc as it's peak.

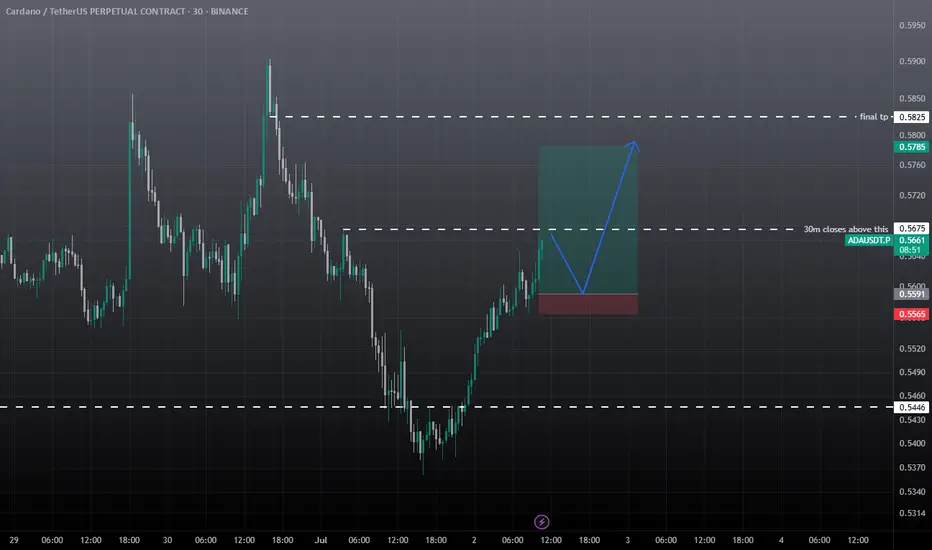
ADAUSDT Intraday SetupAda Showing some good movement. Trade Rules
must gave 30m candle closing above marked area, if wick above marked area then trade will become risky. Must use the sl. Target is given.
If retraces back before the marked area then it also good, in this case 30m marked area will first tp book 30% here, rest hold till final tp or SL.
ada usdt scalp tradeshort term pullback expected from ada, cardano so take it with small amount, trade entry based on 5m, so don't expect bigger targets. must use sl.

ENA SCALP & Intraday Setup Both Long & Short SetupWait for the entries to be filled first. If short entry achieved first then go for the short, if long entry achieved first then go for the long, in both cases must use SL, cause it's consolidating in a range, any side impulse move is expected from ena.

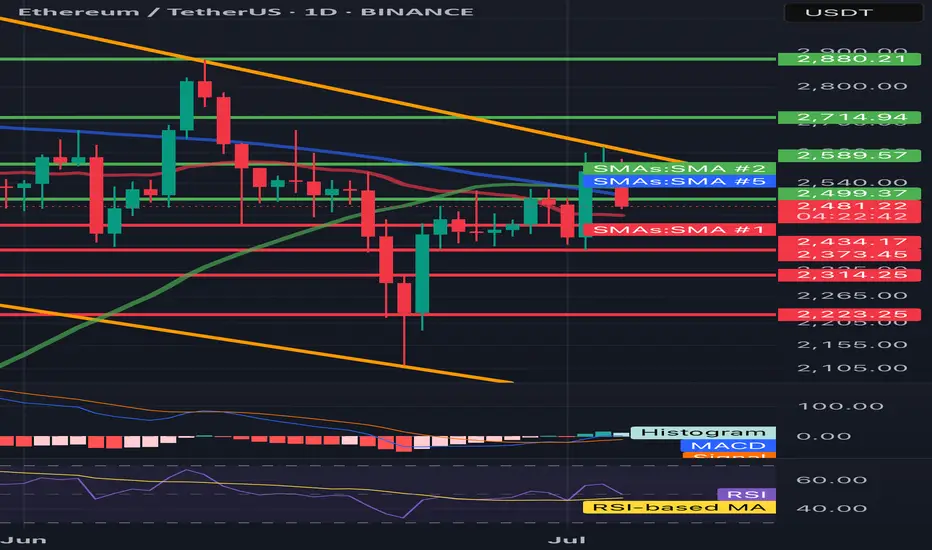
ETH/USDT 1D🔍 ETH/USDT - technical analysis (1D interval):
📉 Price: 2478 USDT (-4.36%)
🔧 Resistance:
• SMA 200 (green): ~ 2589
• Resistance zone: ~ 2715 → 2880 USDT
• SMA 100 (blue): ~ 2500 (just rejected)
🔧 Support:
• SMA 50 (red): ~ 2434 - currently tested
• Strong support: 2373, 2314, 2223 USDT
📊 indicators:
• MacD: freshly intersected, but the momentum is weakening
• RSI: ~ 45 - neutral/weak, under 50 (no bull strength)
• Trend: Still in the downward channel (yellow trend lines)
⸻
⚠️ Conclusions:
• Price rejected from 2500 (SMA 100) and flies down.
• If 2434 falls, a further discount is possible to 2373–2314.
• Lack of bulls with key resistance - the inheritance scenario dominates.
• Watch behavior at 2434 - this is now a key level.
EURCAD Wave Analysis – 4 July 2025- EURCAD reversed from support level 1.5950
- Likely to rise to resistance level 1.6100
EURCAD currency pair recently reversed up from the strong support level 1.5950 (former double top from April, acting as the support after it was broken).
The upward reversal from the support level 1.5950 continues the active short-term impulse wave 5 of the intermediate impulse wave (3) from last November.
Given the strong daily uptrend and the strongly bullish euro sentiment seen today, EURCAD currency pair can be expected to rise to the next resistance level 1.6100.

Bitcoin Euro is €82,000 nextIn this video I go through an idea that may take bitcoin down to the €82,000 region .
I cover the current price action and run through a scenario of bitcoin coming down to the Newley spawned quarterly pivots and faking out at the value area low before coming back up into the range .
The tools I used in the video are quarterly pivots , anchored vwap , Fibonacci, fixed range volume profile and a tpo chart .
Appreciate your following and Good luck with your trading !

BTC shorting opportunity comes againBTC climbed above 108000 again, and the short-term bullish power was slightly stronger. According to the current strength, BTC still has room for growth, but it is still under pressure in the 109000-110000 area in the short term; if there is no major positive news, BTC may find it difficult to break through the resistance area in the short term under the current conditions, and may even experience stagflation and retreat again after approaching the resistance area.
Therefore, I think shorting BTC with the help of the resistance area is still the first choice for short-term trading. We can boldly short BTC in the 108500-109500 area and look towards the target area around 106000 again.

PARTI Setup: Key Reversal Zone Could Spark +50% RallyToday, I want to analyze the Particle Network ( BINANCE:PARTIUSDT ) project for you, which has a chance of increasing by +20% to +50% in the short term .
Let's first take a look at the fundamental state of the Particle Network (PARTI) project .
Particle Network is building a modular Layer-1 blockchain with a focus on Chain Abstraction, aiming to unify user experiences across multiple chains through:
Universal Accounts – Single account across all chains
Universal Liquidity – Access liquidity without bridging
Universal Gas – Seamless cross-chain transactions without gas token concerns
The project has:
Raised $25M+ funding from top-tier investors (Binance Labs, Animoca Brands, Spartan Group)
Integrated with 60+ blockchains and 900+ dApps
Reached over 1.3M testnet accounts and 27,100 daily transactions (Messari Q1 2025 report)
Recently launched UniversalX (a cross-chain DEX) as its flagship dApp
Summary:
Particle Network shows strong fundamentals with innovative tech, a growing ecosystem, and backing from major players in crypto. Long-term success will depend on user adoption of Universal Accounts and dApps like UniversalX.
------------------------------------------------------
Now let's take a look at the PARTI token chart on the daily time frame .
PARTI token is currently trading near Potential Reversal Zone(PRZ) , Monthly Support(2) . There is also a possibility of a Range channel forming, we should wait for the confirmation of the second bottom .
I expect the PARTI token to start rising again from the Potential Reversal Zone(PRZ) and near $0.14 .
Note: Stop Loss(SL)= $0.1177
Please respect each other's ideas and express them politely if you agree or disagree.
Particle Network Analyze (PARTIUSDT), Daily time frame.
Be sure to follow the updated ideas.
Do not forget to put a Stop loss for your positions (For every position you want to open).
Please follow your strategy and updates; this is just my Idea, and I will gladly see your ideas in this post.
Please do not forget the ✅' like '✅ button 🙏😊 & Share it with your friends; thanks, and Trade safe.

SOLUSDT Holding Long Term Trendline SupportSOLUSDT continues to show strong bullish structure, with price consistently holding above a multi-year ascending trendline a key structural element that has defined its uptrend. This dynamic support has anchored price action within a broader ascending formation, reflecting steady long-term accumulation.
Additionally, the chart reveals a well defined Cup and Handle formation, further reinforcing the bullish outlook. As long as price respects the immediate demand zone, this area remains a prime region for re-accumulation, with expectations for it to hold as a firm support level.
The projected target for this setup is clearly illustrated on the chart, aligning with the broader bullish continuation narrative.
Share your view, do you see SOLUSDT pushing higher from here, or is a deeper retest likely before the breakout?

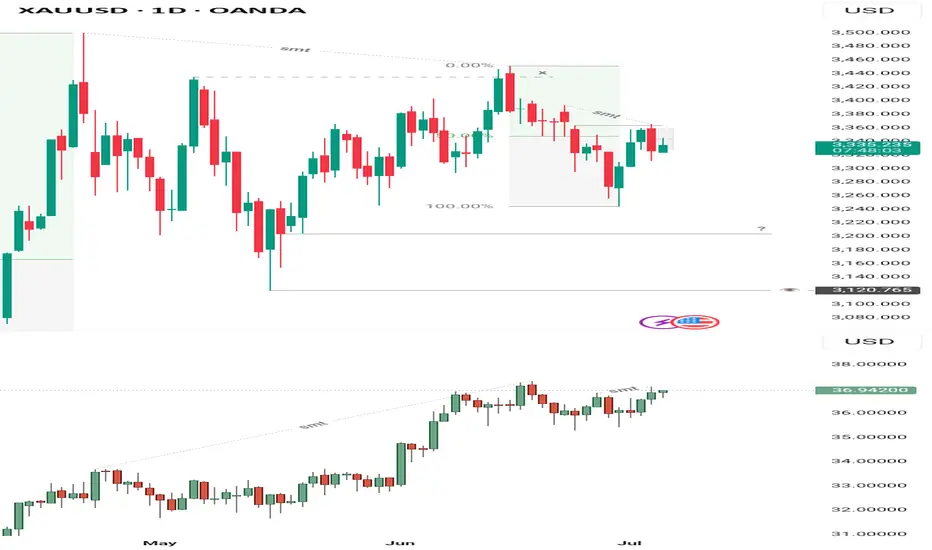
Gold-Silver Discrepancy Analysis – Reevaluation After NFP ReactiAfter taking a loss yesterday, I had to reassess my outlook on Gold. The market behavior leading into and following the NFP event revealed significant discrepancies between Gold and Silver that can’t be ignored.
Since April 24th — the day Gold printed its highest price in human history — the daily chart has shown consistent lower low formations. In contrast, Silver had been forming higher highs on the daily during this same period, showing relative strength.
However, this dynamic began to shift. On the 4-hour chart, Silver is now printing lower lows from last month’s high, aligning more closely with Gold, which has been bearish on both the daily and 4-hour timeframes since its peak.
A key moment occurred just before the NFP release: Silver made a strong run above last week’s high, while Gold failed to even trade above Wednesday’s high — which coincides with the gap fill from last week Tuesday’s open. This divergence in price behavior is crucial.
Gold closed yesterday with a full-bodied bearish engulfing candle, rejecting that same gap area. Meanwhile, Silver’s breakout above last week’s high, despite its internal weakness, is a clear discrepancy of value.
Now, with Silver beginning to shift into lower low structure on the daily and no bullish market structure shift present on the 4-hour chart, the bullish narrative weakens. This divergence between both metals—especially as Silver shows signs of internal breakdown—suggests a high-probability case that the market may be preparing for a broader downside move rather than continuation to the upside.
That said, the key level at 3225/3200, which I marked during my previous bullish outlook, remains on watch. Price reaction at this zone will be critical in determining whether the market still has a chance to reclaim bullish intent or if the short bias continues to play out. If the bearish pressure holds, 3120 becomes a likely target—and a deeper fall toward 2960 wouldn’t be surprising either, considering it aligns with a key discount zone from the weekly timeframe.
UXLINK price powerfully pumping😱 Totally manipulative asset - $UXlink
When all the altos are growing, OKX:UXLINKUSDT price is in a falling consolidation, when most altos start to “feel bad”, then #UXLINK is pummped.
Now, the MM's goal is obvious - to break the feet of shorts and organize a “short squeeze” and sell a large portion of the asset at high volumes.
Therefore:
1️⃣ Don't shorts - it's too early.
2️⃣ Move your stops at a long position or use a trigger stop.
3️⃣ Short squeeze - are close, above $1.20, it will be sharp... to $1.30 or even to $1.50, or even to $2.15... it is unknown, time will tell)
The only thing that is known is that those who like to trade such manipulative assets will get an unforgettable adrenaline rush, but afterwards the taste will be twofold...
Better watch without participating!)
P.S:
we would buy, not earlier than at $0.26-0.32
_____________________
Did you like our analysis? Leave a comment, like, and follow to get more

MooDENG price analysis😭 How “fun” you can live trading memecoins!)
First, -97% dump, and then +1600% if from the absolute bottom, or +800% of a rapid pumping)
And with all this, the capitalization of #MOODENG is only $275 million, and at the maximum it was around $600 million.
🕯 Moreover, on the OKX:MOODENGUSDT chart, they “draw” as if they want to give another upward momentum. Here's the question: to $0.40 or $0.70?
❗️ But this is an idea for spot holders!!!
Because as you can see on the chart, a -50% correction "It's not a big deal" at all, and it can liquidate longs even with x2 leverage.
_____________________
Did you like our analysis? Leave a comment, like, and follow to get more

Ethereum in JULYEthereum should close above $3000 by the end of July to stay in the bull run, Monthly candle is so important now.

Still short gold before breaking 3355After the release of NFP yesterday, gold began to fall sharply from 3352, reaching a low of around 3312; although it has gradually rebounded above 3340, the time span is not short, so the rebound is not strong; and the double top structure successfully constructed by gold in the 3365-3360 area in the short term still plays a technical suppression role in the short term, greatly weakening the rebound potential; and with the decline of gold yesterday, I think before gold recovers the 3352 starting point, gold will also be under pressure in the 3345-3355 area in the short term. If gold cannot successfully break through this area during the rebound, gold is expected to retest the 3330-3320 area again.
Because of the US Independence Day, the gold market will be closed in advance today. It is expected that gold will not have a breakthrough today, so it may be difficult to break through the 3345-3355 area in the short term, so we can still continue to maintain the trading rhythm of shorting gold in terms of trading.
So I think shorting gold still has a lot of profit potential. We can short gold with 3345-3355 area as resistance and look to the target area: 3335-3325-3315.

GOLD → Consolidation after a trend break...FX:XAUUSD , after breaking out of a downtrend, is consolidating, which may continue for some time due to Thursday's news and low liquidity on Friday.
Gold stabilized after a correction, but volatility risks remain. After falling from a weekly high of $3,366, gold prices found demand again in Asia on Friday. Strong US employment data cooled expectations of an imminent Fed rate cut, which supported the dollar and limited gold's gains. Additional pressure is coming from the hawkish shift in Fed expectations, but US budget risks and weak liquidity due to the holidays could increase price volatility in the coming days.
Technically, the focus is on the boundaries of the current consolidation at 3311 and 3357. In addition, within the range there is an important level of 3325, which divides the market into bearish and bullish zones...
Resistance levels: 3350, 3357, 3393
Support levels: 3325, 3311
It is important to understand the situation: due to the holiday in the US, liquidity is lower, making it easier to move the price. The rest of the world, interested in gold, can easily push the price up. The trigger will be the zone 3350 - 3350. There is a chance that the market will try to break through the resistance without a pullback and continue to rise to 3393.
However, the most likely scenario is that after yesterday's volatility, gold will remain within 3325 - 3357 before rising next week
Best regards, R. Linda!

GBPCAD → Retest the area of interest before growthFX:GBPCAD is closing the imbalance area as part of a countertrend correction and consolidating below the 0.5 Fibonacci level. What's next, growth or decline?
The global trend is upward, and the situation is classic: the market needs energy and liquidity to continue growing.
Locally, we see that as part of a countertrend correction, the market is closing the imbalance area, but at the same time forming consolidation below 0.5 Fibonacci, still leaving the zone of interest and order block below 1.84600 untouched.
Technically, there is a fairly high probability of continued growth, provided that the price ends its consolidation with a breakout of the 1.85690 resistance and consolidates above 0.5 Fibonacci.
Resistance levels: 1.85690, 1.8657
Support levels: 1.84986, 1.846, 1.8417
However, as an additional and, in my opinion, the most important scenario, I still consider a complete closure of the fvg and a retest of the 0.7-0.79 zone, within which the order block is located. A false breakdown of the zone of interest and the capture of liquidity could attract additional interest, which would trigger growth.
Best regards, R. Linda!

JPM: Internal CadenceResearch Notes
Testing coordinates of full fractal cycle for deterministic properties. If we base our core measurements (0; 1) on that shape:
Interference Pattern I - adjusted to the angle of building blocks
Interference Pattern II
Interference Pattern III
This explains all Fibonacci channels shown in interactive chart.

FCCL LongGolden cross on weekly time frame. RSI has cooled down and is ready to take off again.
Possible target is 77.

Cookieusdt trading opportunityCOOKIEUSDT has broken down from its rising channel and is now heading toward a potential reversal zone. If price finds support and reacts positively from this area, a move toward the important supply zone is expected. A confirmed breakout above this supply zone would open the path toward the projected final target, as outlined on the chart.

USDCAD offers good R:R opportunityAs the price corrected, its forming a falling wedges pattern. And the best thing is all the new lower low was appear alongside the higher low on MACD, it's such a strong BULLISH DIVERGENCE signal.
I believe in the next 2-3 trading days, 100-150 pips upward movement is very likely to happen.

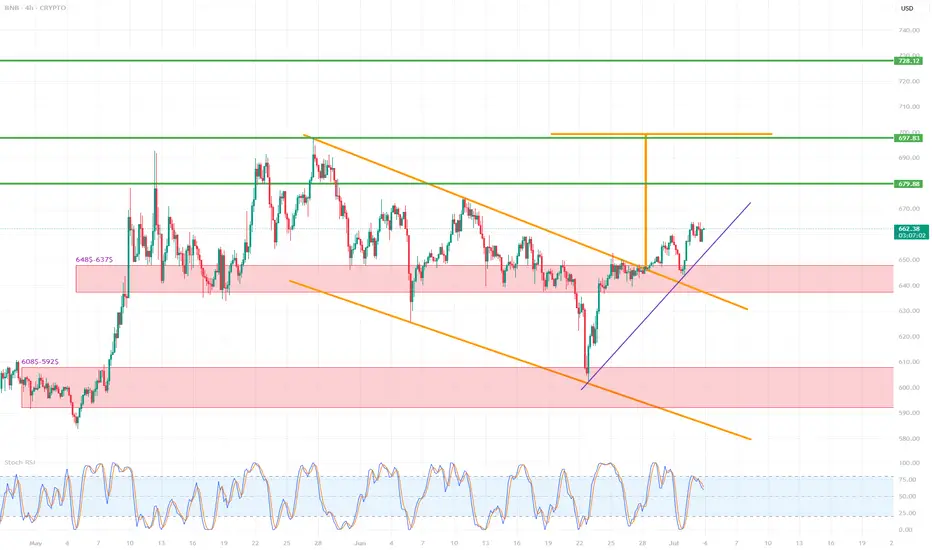
BNB/USD (4h interval)🔍 1. Chart structure
Instrument: Binance Coin / USD (BNB/USD)
Interval: 4 hours
📐 2. Technical formations
🔸 Breakout from the descending wedge formation
The descending wedge (orange lines) is a bullish formation - it suggests a potential breakout upwards.
The breakout occurred dynamically, with a large breakout candle (confirmation of the formation).
The goal of breaking out of the wedge is usually the height of the entire formation - this is marked with an orange arrow.
📈 Breakout range (target): around $697–710
🟢 Potential next targets:
697.83 (local resistance/projection result)
710.73 (main wedge height projection)
728.12 (strong resistance from history)
📊 3. Supports and resistances
🟥 Support zones (red rectangles):
$648.5–637.5 – previous resistance, now tested as support after the breakout.
$608.5–592.5 – strong support from previous lows.
🔼 Currently, the price has tested the upper support zone (648–637), reacted positively and continues to move up.
🟩 Resistance levels (green horizontal lines):
679.88 USD – local resistance, first target after breaking out of the wedge.
697.83 USD – projected range from the formation.
710.73 USD – full technical range of the breakout.
728.12 USD – strong resistance from history, may be a long-term target.
📉 4. Trends and support lines
Purple upward trend line – currently the price is above, which confirms the short-term upward trend.
Its break may lead to a retest of 648–637 USD.
Only below this zone can a larger correction be considered.
📈 5. Stochastic RSI indicator
Currently in the overbought zone (above 80).
Possible temporary cooling – signal for local correction / consolidation.
It is worth waiting for the indicator to go down to around 20 to re-enter the long.
✅ 6. Scenarios
🔼 Bullish (base) scenario:
Staying above 648–637 USD.
Maintaining the uptrend line.
Continuation to 679.88 → 697.83 → 710.73.
🔽 Bearish scenario:
Breaking the purple trend line.
Returning below 648 USD → going down to the 608–592 zone.
Negation of the breakout from the wedge.
📌 Final conclusions
Breaking out from the descending wedge is a strong pro-growth signal.
The price behaves in accordance with technical analysis, testing the previous resistance as support.
Currently, the retest and consolidation phase is underway – maintaining the trend line and the level of $648 will be key.
The medium-term target is $697–710.