BTC with potential for $115,000/$120,000🔍 Market structure (Price Action)
📈 Trend:
The market previously formed higher highs (HH) and higher lows (HL) – a classic uptrend.
Then there was a correction and a lower high (LH) and lower low (LL) appeared – a potential change in the trend to a downtrend.
The last two lows are again HL (Higher Lows) – suggesting an attempt to return to the uptrend.
🔄 Key support and resistance levels
✅ Resistance (green horizontal lines):
117.469 – local resistance and potential breakout target from the current range.
115.802 – confirmed resistance from previous consolidations.
111.814 – strong local resistance (LH – Lower High formed there).
109.341 – current resistance, the price is currently testing it.
🛑 Support (red horizontal lines):
105.370 – local support, price reacted at this level in recent days.
102.650 – important support, level of previous HL.
100.095 – consolidation level before breaking out upwards.
98.213 – last LL – very important level in the context of defending the structure.
🧭 Structure of peaks and troughs
HH: Higher High – confirmed the previous uptrend.
LH: Lower High – first warning about changing the structure to down.
LL: Lower Low – confirmed a potential change to downside.
HL (x2): two more higher lows – suggest a possible return to growth.
📊 Stochastic RSI (at the bottom of the chart)
The oscillator is currently in the overbought zone (>80), approaching a downward crossover.
It suggests a possible short-term halt in growth or correction.
But in strong trends it may "stick" to the upper range.
📌 Potential scenarios:
🟢 Bullish:
If the price breaks above 109.341, it may test 111.814 and then 115.802.
Continuation of the HL → HH formation will confirm a trend reversal and further growth.
🔴 Bearish:
If the price does not stay above 109k and breaks below 105.370, there is a risk of a test of 102.650 and lower.
A break of 100.095 and especially 98.213 will negate the growth structure.
🧠 Conclusions:
The market is at a key decision point - HL formation vs. resistance zone.
Buyers' strength will be confirmed only after breaking 111-112k.
Stochastic RSI warns of potential pullback or consolidation.
Fibonacci

$10 is looking realistic... if Mr. T doesn't mess it up lolWe have a lot of $10 call options on every expiration date for the next few months, meaning this move might take a while to play out. Unsure of exact date if its earnings call or news but $10 seems to be where the focus is.
If tariffs begin or effect Brazil negatively then this stock could plunge on low growth anticipation.
Watch very very closely on how price reacts to $9 IF we even go down there.

I have shorted gold as expected and held on patientlyEven under the influence of the ADP data, which is bullish for the gold market, gold has not effectively broken through 3350, and even showed signs of falling back after rising several times. The resistance above is becoming more and more obvious, which may further weaken the market's bullish sentiment and confidence, thereby strengthening the dominance of the bears.
Although gold has not effectively fallen yet, from the perspective of the gold structure, even if gold wants to rise, it still needs to be backtested and support confirmed before rising, and the current retracement is far from enough, so gold still has a need for structural retracement; and before the NFP market, gold rose slowly but was far from enough to break upward, and there was no volume support, so the illusion of gold rising may be to lure and capture more bulls;
Therefore, out of caution, I try to avoid chasing gold at high levels; and I believe that shorting gold is still the first choice for short-term trading at present. And I have executed short trades in the 3340-3350 area according to the trading plan, and held it patiently. I hope that gold can retreat to the 3320-3310-3300 area as expected.

HINO LongHino broke its downward channel line in November 24. It posted a high of 545 in Jan 25 and came back to retest the level which broke the downward channel (~300).
Now it is exactly at its Fib 0.236 level, crossing which, it will pace up and move towards its next levels.
Next levels are: 545, 589, 721 and 853 in short to medium term.
Long terms target can be its all-time high level of 1274.
Its not a buy / sell call, just my personal opinion.
Daily, weekly and Monthly RSI are all at or around 60 that show positive momentum.
Moreover, the increasing volumes since it broke downward channel showing active players ;)
One thing to note that its free float is very low, that will cause its very fast move upward (whenever it may be)

Analysis on circle using tpo and regular chart longs and shortMust watch video giving 2 really nice Risk reward entries on the Newley listed stock Circle
In this video I highlight a region using limited data of where to get filled if you missed the IPO and want to buy some circle .
We are currently in a no trade zone for buyers as I anticipate that price will gravitate down to the .786/.886 level over time .
In this video I also use the TPO chart "Time price opportunity" and demonstrate what i am looking for from using this type of chart to add to my confluences for a high probability trade .
Also identified in the chart is a short trade off of the weekly pivots and the value area high of the range .
Thankyou for watching and i welcome any questions

AERO Long Swing Setup – Strong Pullback into Fibonacci SupportAERO has shown notable strength in recent months and is now retracing into a key support zone, aligning with the 38.2% Fibonacci level. The $0.75–$0.80 area offers a solid long swing opportunity.
📌 Trade Setup:
• Entry Zone: $0.75 – $0.80
• Take Profit Targets:
o 🥇 $1.04 – $1.32
o 🥈 $1.60 – $2.05
• Stop Loss: Daily close below $0.70

How much higher for Platinum futures In this video I look at the current price of platinum on a higher tf and forecast where I believe the cool down to this rally might begin.
Using tools like the fib extension, volume profile and speed fan we are able to highlight a major reaction zone ahead at $1600 region .
Set alerts at these key levels for what might prove to be a solid short entry or a rejection , retest and claim for higher levels like the 1.618 ext .

Gold LongGold is likely to go long, supported by technicals as well as fundamental data. Powell's speech and today's ADP non farm employment data support the global uptrend of gold. Technically, it needs to breakout 3347 and close above it. That will trigger the upward momentum targeting 3390-3400 zone.
I do not rule out a decline to the bottom of the range (which confluences with 0.236 fib) before further upward momentum. What do you guys think?

Bitcoin: 170k–180k?If you find this information inspiring/helpful, please consider a boost and follow! Any questions or comments, please leave a comment!
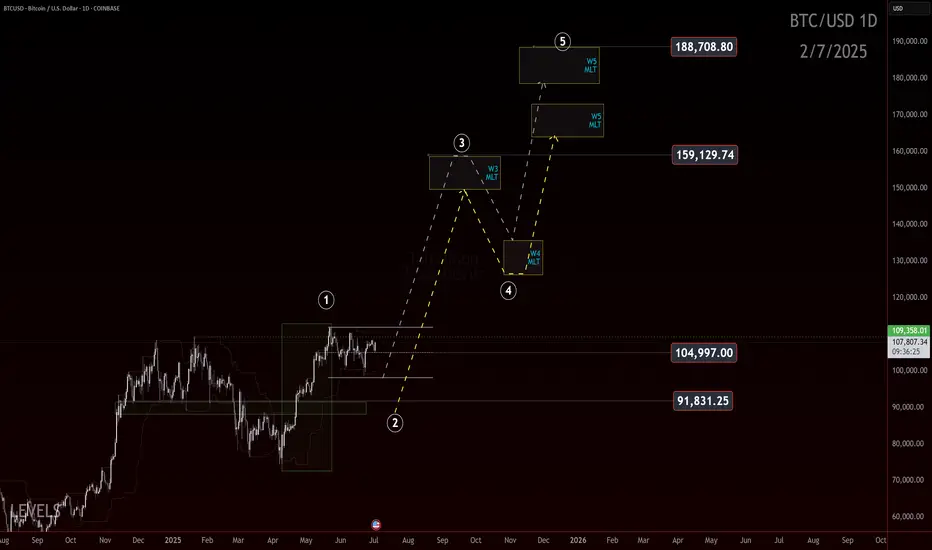
Bitcoin: 170k to 180k?
Let’s talk bias.
We’ve seen a powerful move off the 75k low, and it’s hitting some markers of a potential wave 1 impulse. If that structure holds and price doesn’t come back to wipe out the lows in a wave 2 retracement, then this is what we’d be looking at.
The idea? This is a conservative roadmap built off Elliott Wave Fibonacci projections and it targets the 170k to 180k zone.
Now, let’s be clear. This is a conservative projection. We’re not talking hopium fueled 250k moon targets here. We have no proof of that yet. We're anchoring the wave count and saying: if this is a 1, we’re due a 2, and then a 3 takes us to the upper levels.
But there’s a catch. Always is.
If price starts to fade back through the 91.8k area in a deep aggressive retrace, this roadmap gets less likely. Breaking the 75k pivot means the impulse structure failed or was misread, and we shift the count.
Until then, the 170k–180k level is a possible destination based on this roadmap.
Trade Safe!
Trade Clarity!
This is exactly how I like it!This is textbook range trading. A break below the range by the same size aligns with the 0.5 Fibonacci level of the entire underlying correction, followed by a bounce back into the range. The next step is to take the 0.5 Fibonacci level of the range itself. If that level is broken, the next target is the upper band of the range. Should that also be breached, we are then aiming for Fibonacci level 2 — or the moon.

Quick BB updates - Minor MovementAs we've observed, it appears we're currently in a Minor Cycle at the end of the 4th wave, aligning closely with the Fibonacci target for this wave.
The last financial quarter delivered strong results, and I genuinely like the direction the company is heading. In my view, this could represent the most significant core business shift in the past 30 years.
As always, please do your own research before investing, this is not financial advice.
Have a blessed week!

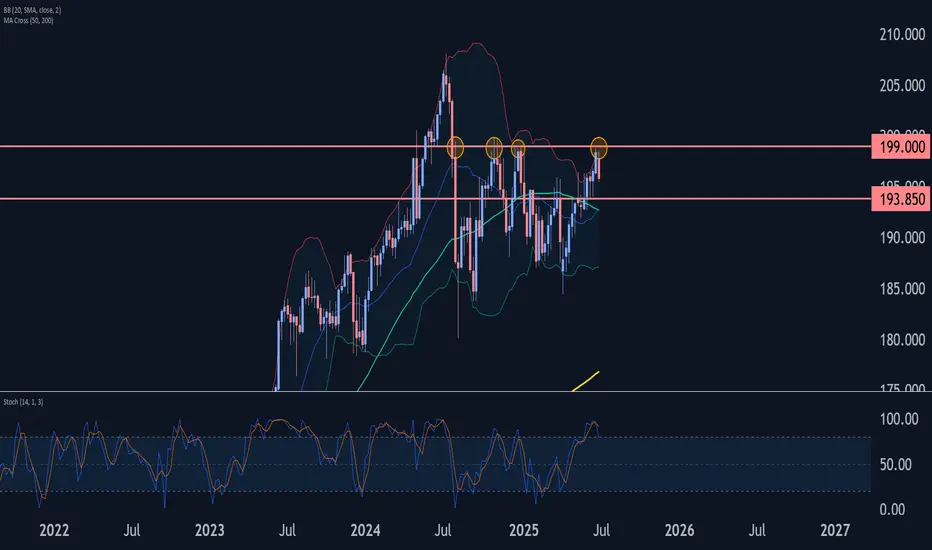
GBPJPY Wave Analysis – 2 July 2025- GBPJPY reversed from resistance zone
- Likely to fall to support level 193.85
GBPJPY currency pair recently reversed down from the resistance zone between the strong resistance level 199.000 (which has been reversing the price from last October) and the upper weekly Bollinger Band.
The downward reversal from this resistance zone stopped the C-wave of the previous ABC correction (2) from April.
Given the strength of the resistance level 199.000 and the overbought weekly Stochastic GBPJPY currency pair can be expected to fall to the next support level 193.85.
EURGBP Wave Analysis – 2 July 2025- EURGBP broke resistance zone
- Likely to rise to resistance level 0.8700
EURGBP currency pair recently broke the resistance zone between the resistance level 0.8570 (which stopped the previous impulse wave i at the end of June) and the 61.8% Fibonacci correction of the downward impulse (B) from April.
The breakout of this resistance zone accelerated the active minor impulse wave 3 of the intermediate impulse wave (C) from May.
EURGBP currency pair can be expected to rise to the next resistance level 0.8700 (which is intersecting with the daily up channel from May).

AFTER - XAU/USD - Jul 1,2025 DoneCongratulations guys 200 pips profits
✅ XAU/USD Trade Recap – Jul 1,2025
Bias: Short (Sell Position)
🔹 Entry Price: Around $3,348
🔻 Stop-Loss: $3,371
🎯 Take-Profit Target: $3,327 (✅ Hit – 200 pips)
📉 Result: First target partially reached – trade closed with +200 pips in profit.
Price rejected the resistance area and moved downward, allowing for a clean exit before reaching TP1 and TP2. Conservative profit-taking secured gains without risking reversal.
💡 Summary:
Smart and disciplined execution. The market respected the setup, and you locked in profits safely at 200 pips before any retracement.

Congratulations everyone all targets done__ June-30,2025
CONGRATULATIONS EVERYONE
✅ XAU/USD Trade Recap – June 30, 2025
Bias: Long (Buy Position)
Result: ✅ Take-Profit Hit
📌 Entry Zone: Around $3,363 – $3,370
🎯 Target 1 (TP1): Hit at $3,302 (273 pips)
🎯 Target 2 (TP2): Hit at $3,308 (336 pips)
🛑 Stop-Loss (SL): $3,259 (Not triggered)
📈 Outcome:
The price moved strongly in favor of the long trade after entry, reaching both profit targets successfully.
The setup was executed with high precision, and the bullish momentum carried price past TP2, confirming the trade idea.

TIA Scalp trade setupwait for the retest of breakout, set sl & tp. While on swing trade will long below 1.31 and tp 2.0$, TIA is extremely oversold, So less affected by BTC.

BTC: Price to 134,500$ , FVG, Fib 0.5 and 0.618 ratio ?Price to 134,500$:
Bitcoin is now moving in a triangle pattern, which is getting smaller. The price is around $107,758. Here is possible move is a breakout to the downside first, where the price may drop to fill the "Fair Value Gap" area, which is marked in purple. This area is between the Fibonacci levels of 0.5 and 0.618. After that, Bitcoin could go up again and reach the price of $134,000.
Trade Ideas:
I marked 2 areas with arrow let the price reach here and wait for confirmation in both areas. Specially in Fair Value Gap area.
Trade Signal:
I will provide both trade signal here so follow my account and you can check my previous analysis regarding BITCOIN. So don't miss trade opportunity so follow must.
BINANCE:BTCUSDT BITSTAMP:BTCUSD COINBASE:BTCUSD COINBASE:BTCUSD BINANCE:BTCUSDT.P CRYPTO:BTCUSD BYBIT:BTCUSDT.P BINANCE:BTCUSD

1000 Floki swing trade setupwait for the entries, must use SL. Don't go for long at any coin wait for the short entries.

inj swing trade setupInj has broken downside, expecting more downfall before any leg up, wait for the entries to be filled, these are swing trades based on 1 day TF, so here wick doesn't matter wait for the closing, you can hold them without SL if entry achieved, take 1st entry on mentioned points 2nd entry below SL, and then wait for the closing, IF any entry achieved and candle closed above the short then wait for the pullback and close on entry points if long entry achieved then hold the trade 2nd entry take from previous wick low and wait for the tp this leg down will be the final shakeout before any major move. That's why giving you some short entries. BTC will take a final leg down sooner or later, then Boom your alt season starts.

QQQ: Scaling Recursive PatternsSo far the closest recursive pattern that can mimic current growth would be shape of expansion after covid crash. In both cases the fall was sharp that caused it grow in distinctive way, so we can grab the cycle of the pattern. To keep it simple for this structure, crossing curve would be first sign that price breaks out of regular rhythm and might dive sooner. Added other related patterns:

NQ Power Range Report with FIB Ext - 7/2/2025 SessionCME_MINI:NQU2025
- PR High: 22723.00
- PR Low: 22683.00
- NZ Spread: 89.5
Key scheduled economic events:
08:15 | ADP Nonfarm Employment Change
10:30 | Crude Oil Inventories
Session Open Stats (As of 12:25 AM 7/2)
- Session Open ATR: 328.85
- Volume: 20K
- Open Int: 265K
- Trend Grade: Neutral
- From BA ATH: -0.8% (Rounded)
Key Levels (Rounded - Think of these as ranges)
- Long: 23239
- Mid: 21525
- Short: 20383
Keep in mind this is not speculation or a prediction. Only a report of the Power Range with Fib extensions for target hunting. Do your DD! You determine your risk tolerance. You are fully capable of making your own decisions.
BA: Back Adjusted
BuZ/BeZ: Bull Zone / Bear Zone
NZ: Neutral Zone

Sol searching, for an entry. If you find this information inspiring/helpful, please consider a boost and follow! Any questions or comments, please leave a comment!
The Elliottician’s Paradox: 12-12 or Zigzag? Bias Is the Key
Ever stare at a chart and ask, “Is that a 12-12 or a classic zigzag?” Yeah… welcome to the paradox we Elliotticians live in. Pattern recognition’s a blessing and a curse because context is everything, but confidence can get you wrecked.
This one’s got me on the edge.
What’s Happening Here
We’re currently watching a move that could be either:
- A corrective zigzag (5-3-5), or
- A 1-2, 1-2 setup, gearing up for a blastoff
That’s the core dilemma — two valid options, both technically legal. So what tips the scales? Bias.
The Line in the Sand: 152
Here’s what I’m watching for:
Key Level: 152
- That’s the bull/bear line for me.
- A strong impulsive reclaim above 152 flips the script. I’d reconsider the bearish view if price surges with intent.
- But if we return to 152 in a sluggish, corrective way? I’ll be eyeing continuation lower, aligned with a more traditional zigzag structure.
Elliott View
This is where the paradox plays out:
If we’re looking at a 1-2, 1-2 setup, expect:
- A powerful Wave 3 soon (should not be shy)
If it’s a Zigzag ABC:
- Then we should expect a corrective internal retracement and continuation to the down side, at minimum past the origin of the initial move.
The chart will speak loudest. But structure and strength of this next leg will confirm the story.
Final Thoughts
Trading isn’t about being right. It’s about managing scenarios — and this one’s a classic fork-in-the-road moment. I’ve got a plan for both directions.
152 is my trigger. Stay below it and fade the rally. Break above it impulsively, and I’ll flip my bias with it.
The Elliottician’s paradox isn’t a trap — it’s an invitation to stay sharp.
Your Turn
How are you reading this structure? Do you favor the zigzag or the 1-2 setup? Drop a comment and let me know.
Trade safe, trade clarity!

