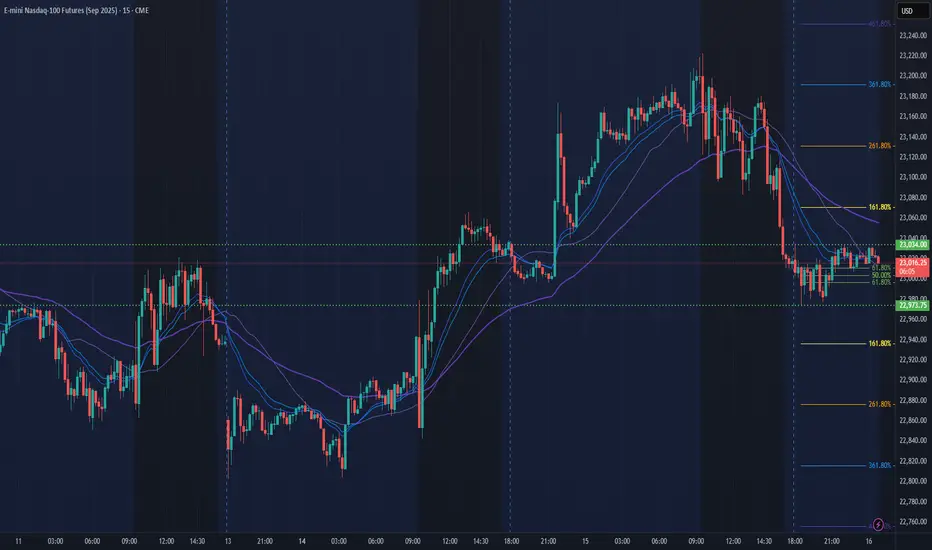
NQ Power Range Report with FIB Ext - 7/16/2025 SessionCME_MINI:NQU2025
- PR High: 23034.25
- PR Low: 22973.75
- NZ Spread: 135.5
Key scheduled economic events:
08:30 | PPI
10:30 | Crude Oil Inventories
AMP margins raised overnight for expected PPI volatility
Session Open Stats (As of 12:25 AM 7/16)
- Session Open ATR: 277.22
- Volume: 27K
- Open Int: 277K
- Trend Grade: Neutral
- From BA ATH: -0.8% (Rounded)
Key Levels (Rounded - Think of these as ranges)
- Long: 23239
- Mid: 21525
- Short: 20383
Keep in mind this is not speculation or a prediction. Only a report of the Power Range with Fib extensions for target hunting. Do your DD! You determine your risk tolerance. You are fully capable of making your own decisions.
BA: Back Adjusted
BuZ/BeZ: Bull Zone / Bear Zone
NZ: Neutral Zone
Fibonacci
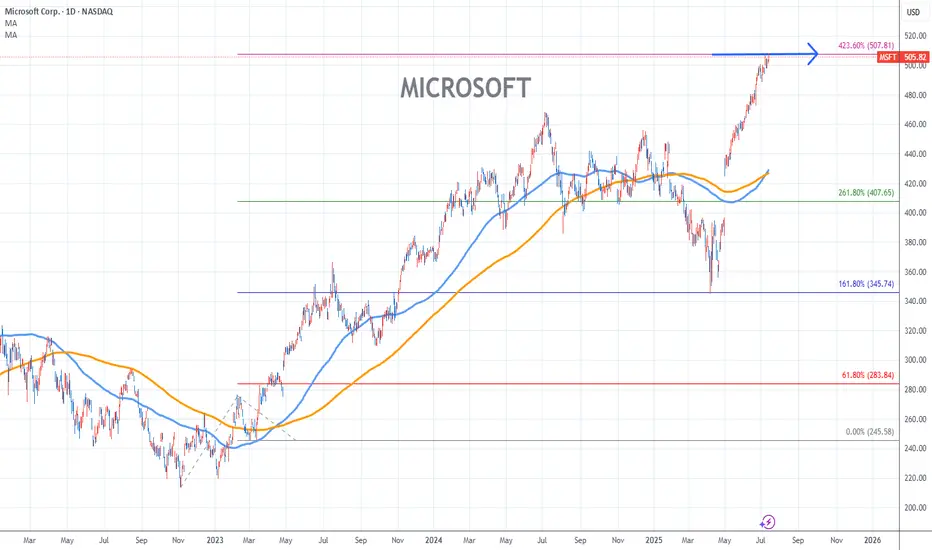
MICROSOFT Stock Chart Fibonacci Analysis 071525Trading idea - Hit the top > 507/423.60%
Chart time frame:D
A) 15 min(1W-3M)
B) 1 hr(3M-6M)
C) 4 hr(6M-1year)
D) 1 day(1-3years)
Stock progress:E
A) Keep rising over 61.80% resistance
B) 61.80% resistance
C) 61.80% support
D) Hit the bottom
E) Hit the top
Stocks rise as they rise from support and fall from resistance. Our goal is to find a low support point and enter. It can be referred to as buying at the pullback point. The pullback point can be found with a Fibonacci extension of 61.80%. This is a step to find entry level. 1) Find a triangle (Fibonacci Speed Fan Line) that connects the high (resistance) and low (support) points of the stock in progress, where it is continuously expressed as a Slingshot, 2) and create a Fibonacci extension level for the first rising wave from the start point of slingshot pattern.
When the current price goes over 61.80% level , that can be a good entry point, especially if the SMA 100 and 200 curves are gathered together at 61.80%, it is a very good entry point.
As a great help, tradingview provides these Fibonacci speed fan lines and extension levels with ease. So if you use the Fibonacci fan line, the extension level, and the SMA 100/200 curve well, you can find an entry point for the stock market. At least you have to enter at this low point to avoid trading failure, and if you are skilled at entering this low point, with fibonacci6180 technique, your reading skill to chart will be greatly improved.
If you want to do day trading, please set the time frame to 5 minutes or 15 minutes, and you will see many of the low point of rising stocks.
If want to prefer long term range trading, you can set the time frame to 1 hr or 1 day.
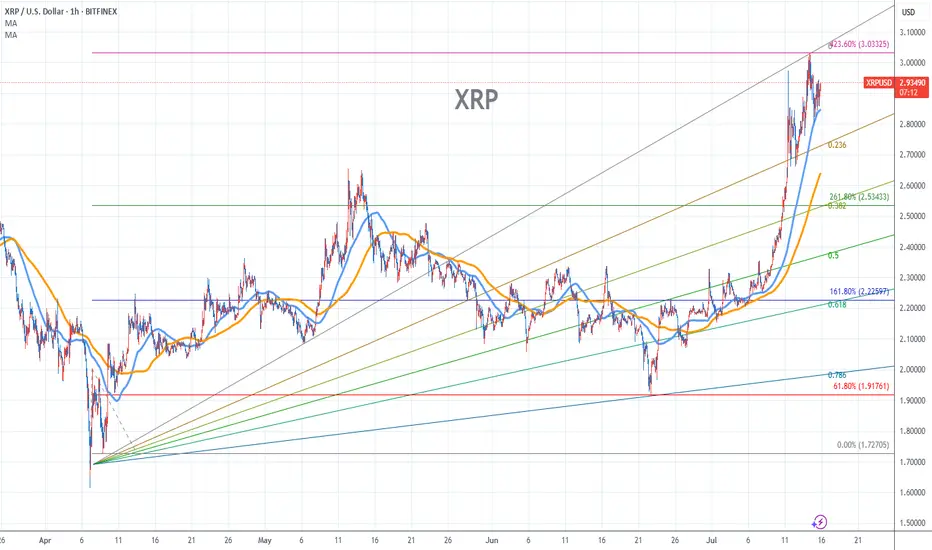
XRP Stock Chart Fibonacci Analysis 071525Trading idea - Hit the top - 3.03/423.60%
Chart time frame:B
A) 15 min(1W-3M)
B) 1 hr(3M-6M)
C) 4 hr(6M-1year)
D) 1 day(1-3years)
Stock progress:E
A) Keep rising over 61.80% resistance
B) 61.80% resistance
C) 61.80% support
D) Hit the bottom
E) Hit the top
Stocks rise as they rise from support and fall from resistance. Our goal is to find a low support point and enter. It can be referred to as buying at the pullback point. The pullback point can be found with a Fibonacci extension of 61.80%. This is a step to find entry level. 1) Find a triangle (Fibonacci Speed Fan Line) that connects the high (resistance) and low (support) points of the stock in progress, where it is continuously expressed as a Slingshot, 2) and create a Fibonacci extension level for the first rising wave from the start point of slingshot pattern.
When the current price goes over 61.80% level , that can be a good entry point, especially if the SMA 100 and 200 curves are gathered together at 61.80%, it is a very good entry point.
As a great help, tradingview provides these Fibonacci speed fan lines and extension levels with ease. So if you use the Fibonacci fan line, the extension level, and the SMA 100/200 curve well, you can find an entry point for the stock market. At least you have to enter at this low point to avoid trading failure, and if you are skilled at entering this low point, with fibonacci6180 technique, your reading skill to chart will be greatly improved.
If you want to do day trading, please set the time frame to 5 minutes or 15 minutes, and you will see many of the low point of rising stocks.
If want to prefer long term range trading, you can set the time frame to 1 hr or 1 day.
EURJPY ANALYSIS After seeing the previous daily candle close above key resistance of 172.500 ,we could see a retest of that support and a continuation to the upside

popcat long post trade📓 Trade Follow-Up — July 16 (Entry from Previous Session)
Timeframe:
Trading window is 10:00 p.m. to 12:00 a.m. (Vietnam time).
This session, I was on the charts for less than one hour.
⚙️ Trade Setup:
Trade idea was built during the New York open.
I didn’t execute the trade in real time because I hesitated.
Price moved without me, but I left a limit order at my pre-marked zone and went to sleep.
No chasing, no new setups added after market moved.
📈 Morning Outcome:
Woke up before 5:30 a.m.
The market had returned to the entry, nearly hit the stop loss, then turned.
I was in approximately +1% unrealized profit.
🧠 Morning Decision:
I had no pre-planned rule for what to do if I woke up and the trade was active.
Market was in Sydney session with about 90 minutes left in the trading day.
Tokyo session was approaching (~1 hour and 20 mins away).
I made a quick decision to close the trade:
Reason: setup originated during New York, no longer active session context.
I didn't want to micromanage outside my committed trading window.
During the short moment it took to decide, price pulled back slightly—final profit was just under 1%.
🧩 Notes:
I need to define pre-market and post-market rules:
What to do if a trade is active when I wake up?
Under what conditions do I manage or exit a trade outside my session?
Reaction was clean, no over-involvement or chasing.
Emotionally stable, but acknowledged mild excitement and urgency when waking up to a live position.

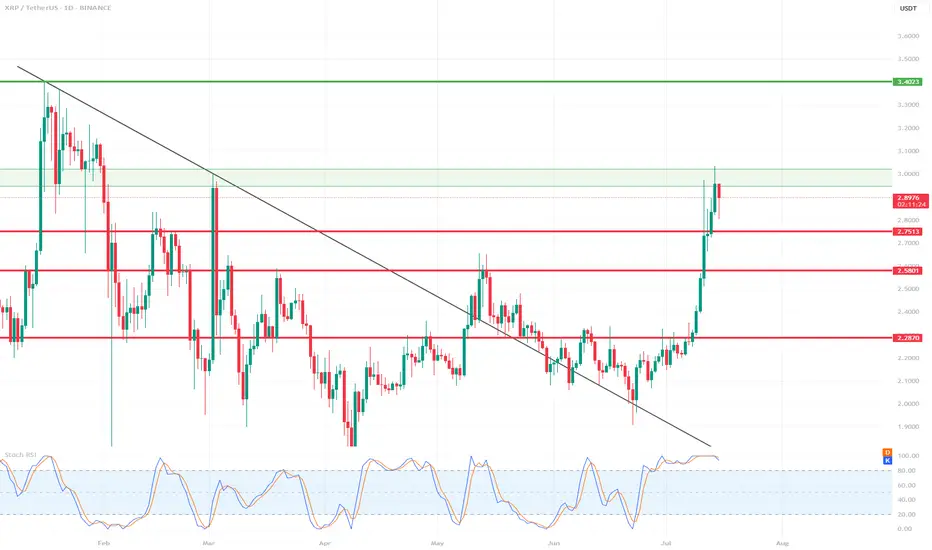
XRP 1D Chart Review📊 Support and Resistance Levels:
🔼 Resistance:
$2.95 - $3.02 – currently being tested, a local resistance zone. Price slightly rejected.
$3.40 – another strong resistance level from the previous high (visible on the left side of the chart).
🔽 Support:
$2.75 – the closest, recently broken support level.
$2.58 – another local support level.
$2.28–$2.30 – a very strong support zone that has been tested multiple times.
📈 Pattern and Momentum:
A breakout from a wedge-shaped downtrend with very high volume and long bullish candles indicates strong demand.
We are currently observing a correction/rejection at $3.02 – a possible short-term pullback.
🔄 Oscillator – Stochastic RSI:
The Stochastic RSI oscillator is in the overbought zone (near 100) – indicating possible consolidation or correction.
The curves are starting to curve downwards – a potential signal for a slight correction in the coming days.
🧠 Scenarios:
✅ Bullish (continued growth):
If the $2.95–$3.02 level is broken strongly and confirmed (e.g., by a daily candlestick closing above it), the target will be $3.40.
In this case, a quick rally to $3.40 is possible without major obstacles.
⚠️ Bearish (correction):
If the $3.02 zone holds as resistance, the price could retrace to $2.75 (the first local support).
If downward pressure persists, $2.58 could be tested.
📌 Summary:
XRP is in a strong uptrend after breaking out of long-term resistance.
In the short term, overbought prices on the Stoch RSI could trigger a correction to $2.75.
Key resistance: $3.02 – breaking it could signal further gains towards $3.40.
It's worth monitoring price reaction in this zone and candlestick confirmation.
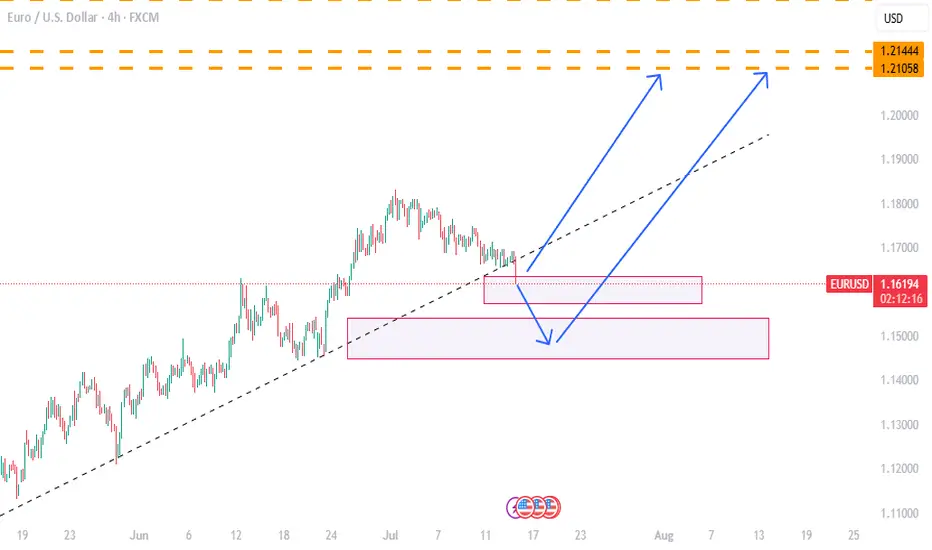
EURUSD Wave Analysis – 15 July 2025- EURUSD broke daily up channel
- Likely to fall to support level 1.1470
EURUSD currency pair recently broke the support area located at the intersection of the support trendline of the daily up channel from May and the 38.2% Fibonacci correction of the upward impulse from June.
The breakout of this support area accelerated the active short-term ABC correction 4.
Given the strongly bullish US dollar sentiment coupled with significant euro pessimism seen today, EURUSD currency pair can be expected to fall further to the next support level 1.1470 (low of former wave iv).

Got filled at the bugattiMy hedge short is filled
continuation of my other chart
IF this is good the target it the!!....
key levels will be longed if data aligns.
#xauusd #elliottwave short sell setup wave 4 16Jul24This count is based on my assumptions so anything can happen not a trading or financial advice just for educational purposes only kindly do your own ta thanks trade with care good luck.
USD/CAD Coils Below Key ResistanceUSD/CAD has rallied nearly 1.3% off the monthly low with the advance now testing resistance at 1.3729/50- a region defined by the 38.2% retracement of the 2021 rally and the May opening-range lows. Note that pitchfork resistance converges on this threshold over the next few days and further highlights the technical significance of this key zone- looking for a reaction off this mark this week.
USD/CAD is trading within the confines of an embedded channel extending off the monthly low with the weekly opening range taking shape just below confluent resistance at 1.3729/50. Ultimately, a breach / close above the June high / 61.8% retracement of the December 2023 advance at 1.3795/98 is needed to suggest a more significant low was registered last month / a larger trend reversal is underway. Subsequent resistance seen at the 2022 high close / 2023 high at 1.3881/99 and the 2022 high / 2020 March weekly-reversal close at 1.3977/90- both levels of interest for possible topside exhaustion / price inflection IF reached.
Initial support rests with the weekly range lows at 1.3670- a break / close below the monthly channel would threaten resumption of the broader downtrend. Subsequent support objectives unchanged at the yearly low-day close (LDC) / May, June, July lows at 1.3571/90 and the Fibonacci confluence at 1.3504/23.
Bottom line: The USD/CAD is testing confluent resistance at the February downtrend with the weekly opening-range set just below- look for the breakout in the days ahead and watch the weekly close here. From a trading standpoint, losses would need to be limited to the weekly lows IF price is heading for a breakout on this stretch with a close above 1.3795 ultimately needed to put the bulls in control.
-MB

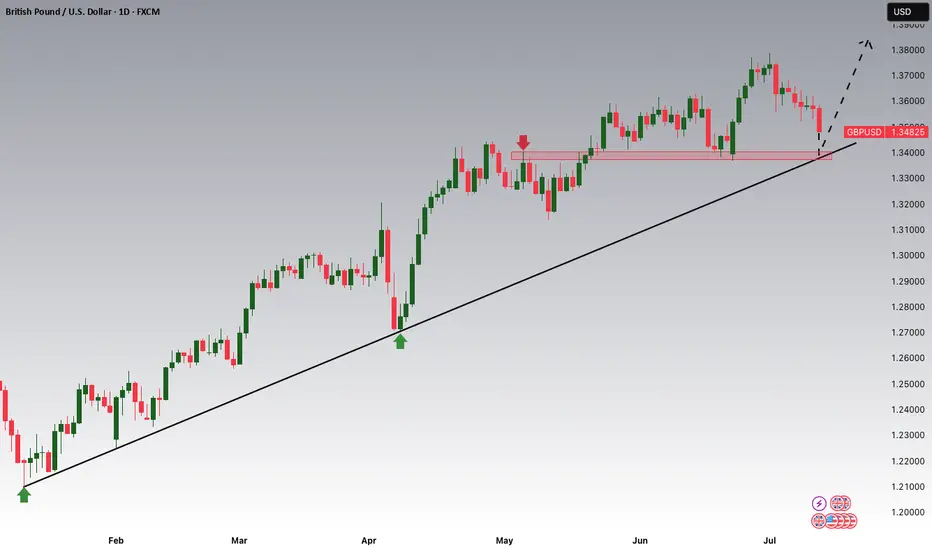
GBPUSD is Nearing the Daily Trend!!!Hey Traders, in tomorrow's trading session we are monitoring GBPUSD for a buying opportunity around 1.34100 zone, GBPUSD is trading in an uptrend and currently is in a correction phase in which it is approaching the trend at 1.34100 support and resistance area.
Trade safe, Joe.
EURUSD OUTLOOK 15 - 18 JULYCore CPI m/m came in light which gave a mixed signal at first but CPI y/y was higher than expected which eventually moved EU lower.
The last two analysis that I posted were more longer term focused so this time I will be giving a more short term outlook.
Currently the dollar is stronger based on the recent news that has been coming out and because of that I am still looking to short this pair keeping in mind that it is only the internal structure that is bearish and the swing structure is still bullish

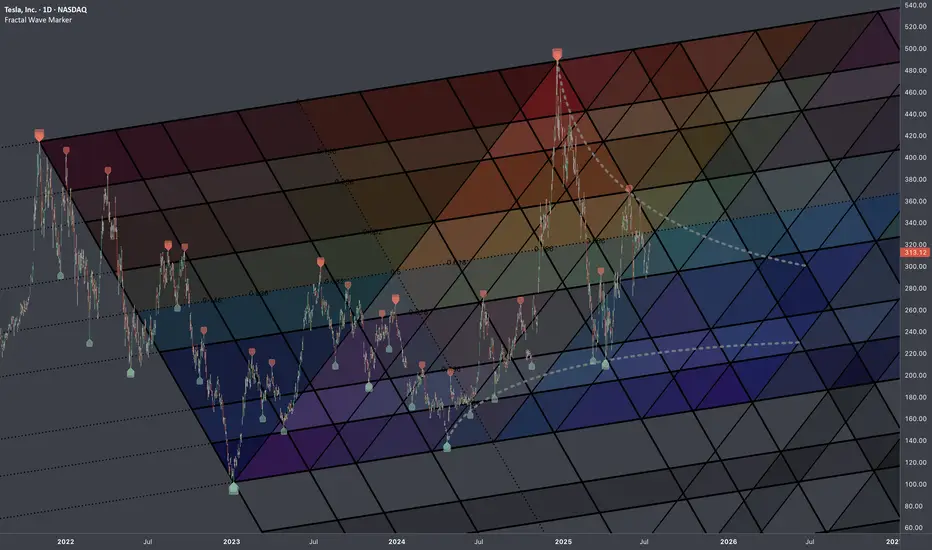
$TSLA: Fib InterconnectionsResearch Notes
Examining interconnection type with regressive angle:
Critical points:
Mapping with 3 fibonacci channels:
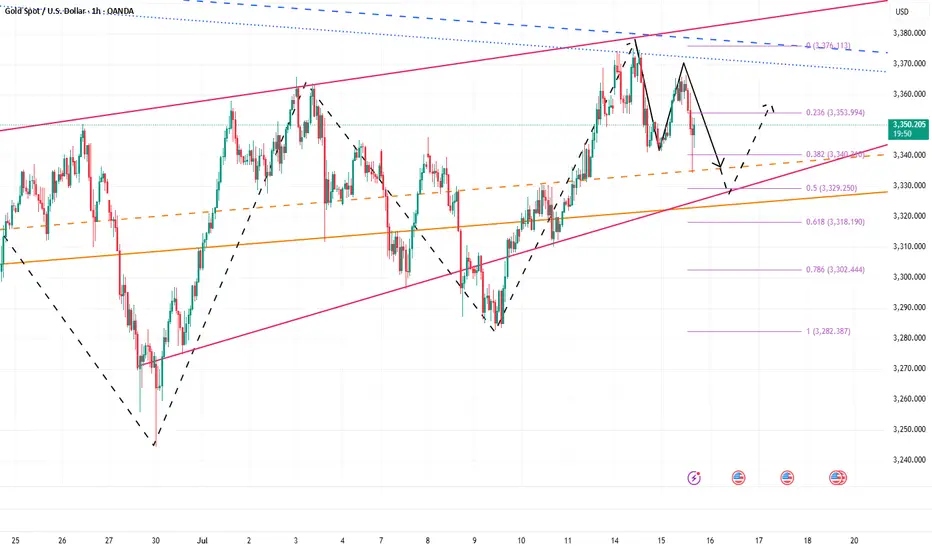
Don’t hesitate, a massive gold move Is brewingRefer to my previous trading idea. Gold retreated as expected. We almost caught the highest point of the day and shorted gold near 3365, and successfully hit TP: 3346, which enabled us to successfully profit 190pips in short-term trading, with a profit of nearly $10K, which is a good result in short-term trading.
Currently, the lowest point of gold in the retracement process has reached around 3335, which has fully released the short energy and vented the bearish sentiment in the market. All the bad news is out, which means good news! Although gold fell from 3375 to 3335, the retracement was as high as $40, but the rising structure has not been completely destroyed. The previous W-shaped double bottom support structure and the resonance effect of the inverted head and shoulder support structure still exist. As long as gold stays above 3325, gold bulls still have the potential to attack.
Moreover, after this round of retracement, the bearish sentiment of gold was vented, and the liquidity was greatly increased, attracting more buyers to actively enter the market. Gold may start a retaliatory rebound, and even touch 3375 again or even break through and continue to the 3380-3390 area.
So for short-term trading, I think we can try to go long on gold in the 3335-3325 area appropriately, first looking forward to gold regaining lost ground: 3350-3360 area, followed by 3380-3390 area.
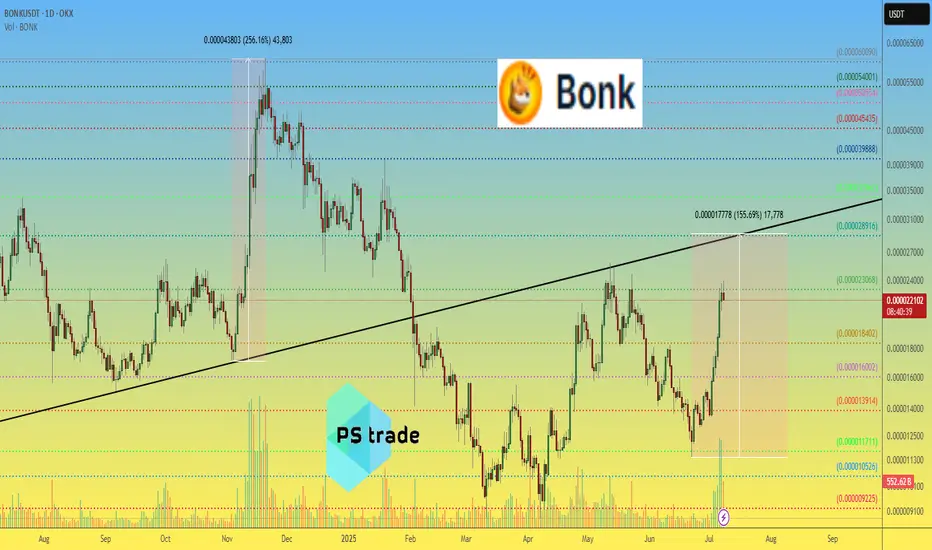
BONK price analysis “Someone” decide to revive the price of CRYPTOCAP:BONK , or are there fundamental reasons for this? (Please share your thoughts in the comments.)
📈 However, the last time there was such a powerful surge in trading volume on the OKX:BONKUSDT chart, the price managed to gain +256% in just over two weeks.
❓ Do you think that the price of #Bonk , in the current wave of growth, will manage to rise by at least +156% and reach the mark of $0.0000290, and the capitalization of the memecoin project will grow from the current $1.75 billion to $2.25 billion?
_____________________
Did you like our analysis? Leave a comment, like, and follow to get more
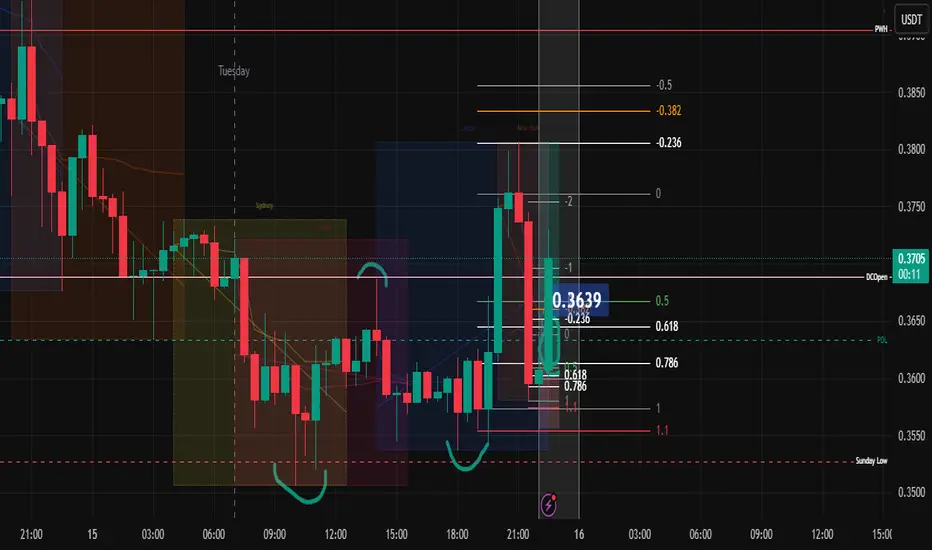
PopCat Long 15-July-2025
🧠 Trade Journal Reflection: July 15
Session: 10 p.m. – midnight (Vietnam time)
Context: Market felt “muddy” on the 1H chart. Needed time to analyze.
🔍 What I Saw:
Market was consolidating below the previous day’s low and today’s open.
Asian session stayed compressed.
London session didn’t break the range meaningfully.
New York session broke out above the day’s open—but then retraced deeply.
On the lower timeframes (45m, 30m, 15m), I identified valid swing highs/lows and noted a retracement that aligned with potential Fibs.
🎯 What I Did:
Measured my Fibonacci retracement levels.
Took time to interpret the situation—was leaning toward longing, but wasn’t fully decisive.
By the time the idea solidified, price had already moved.
I chose not to chase. Instead:
Left a limit order on the LTE (likely your identified entry zone).
Accepted that if price doesn’t come back, it’s okay—I will learn.
💡 What I Felt:
Anxious. A bit unsure. Took time to make the decision.
After placing the limit, I committed to not revenge trading or chasing another asset.
Proud that I chose patience over FOMO.
Acknowledged the lesson: Be quicker next time, but don’t force a trade.
🧭 What I Learned:
I’m becoming more self-aware. That’s rare and powerful.
Not all trades need to be executed to be valuable—this one taught me discipline.
I stayed in alignment with my time window and strategy, even though it felt uncomfortable.
If I’m more decisive and sharper tomorrow, great. If not, I’ll still be here learning.
💤 Final Words to Myself Before Sleep:
“I didn’t chase. I respected my boundaries. I traded with integrity, even if no order was filled. This is the version of me I want to show up with—calm, patient, and always learning. The market will still be here tomorrow.”
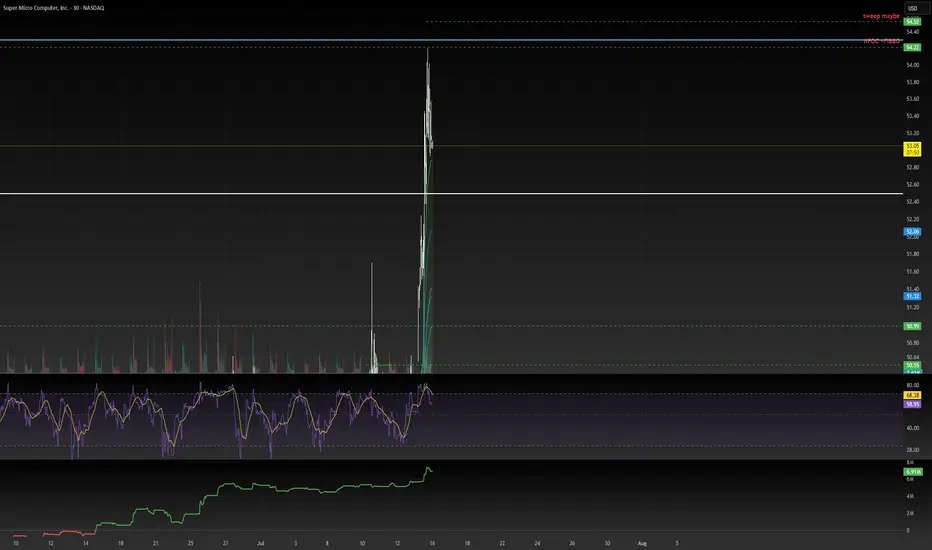
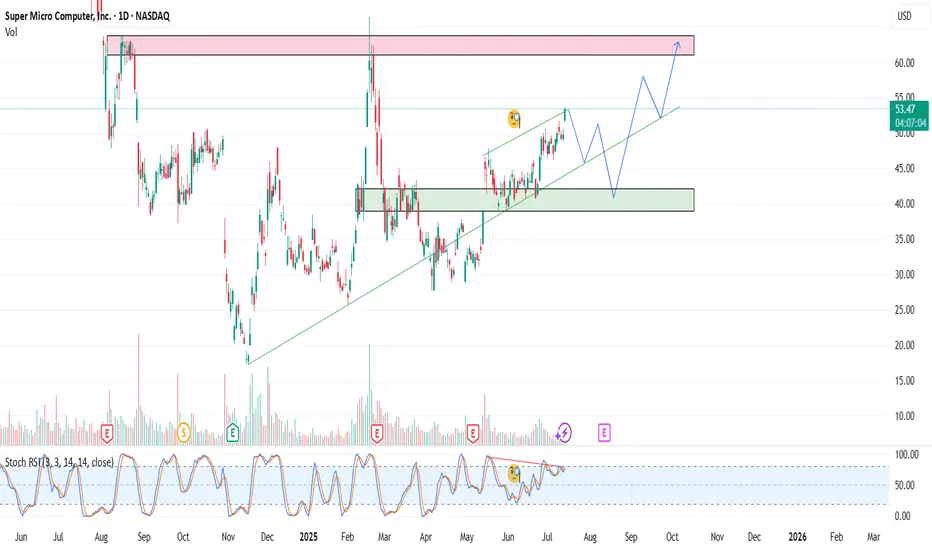
SMCI – Reloading the AI BeastSMCI continues to show strength as a key player in the AI infrastructure space. In this update, I present a new strategy with staggered entry zones at $49, $45, and $38 — designed to capture value during healthy pullbacks within a larger bullish trend.
Entry Plan:
1) $49
2) $45
3) $38
Target:
1) $56
2) $61
3) $66
📉 If price dips back to $45 or $38, I will reload heavier. No FOMO. Let the market come to us.
Drop a 👍 if you're still riding SMCI or waiting for the next entry.
This analysis is for educational and informational purposes only. It does not constitute financial advice or a recommendation to buy or sell any securities. Always do your own research and consider your risk tolerance before making investment decisions.
XME eyes on $57.40: Golden Genesis a MAJOR barrier already felt XME recovering nicely from the tariff tantrum.
$57.40 is the exact level of the Golden Genesis.
High Energy object whose heat is clearly noticed.
It is PROBABLE that we orbit this object a few times.
It is POSSIBLE that it rejects to the retest fibs below.
It is PLAUSIBLE that bulls could blow thru it this time.

Is it right time and choice to buy UNH Stock - {15/07/2025}Educational Analysis says that UNH Stock (USA) may give trend Trading opportunities from this range, according to my technical analysis.
Broker - NA
So, my analysis is based on a top-down approach from weekly to trend range to internal trend range.
So my analysis comprises of two structures: 1) Break of structure on weekly range and 2) Trading Range to fill the remaining fair value gap
Let's see what this Stock brings to the table for us in the future.
Please check the comment section to see how this turned out.
DISCLAIMER:-
This is not an entry signal. THIS IS FOR EDUCATIONAL PURPOSES ONLY.
I HAVE NO CONCERNS WITH YOUR PROFIT OR LOSS,
Happy Trading.

AMC | Long-Term Setup BrewingAMC has been a battlefield stock for retail traders, and while the meme frenzy has calmed, the chart shows signs of a long-term consolidation that may lead to a breakout.
We’re not chasing hype we’re playing levels. The current zone offers asymmetric risk/reward for patient swing or position traders looking for a reversion move back toward key psychological and technical levels.
🔍 Entry Zones:
✅ Market Price: ~$2.99 (initial momentum position)
🧲 Pullback #1: $2.75 (former pivot + fib level)
🧨 Pullback #2: $2.50 (key support floor and high-risk/reward entry)
🎯 Profit Targets (Swing/Position):
🎯 TP1: $3.30 – reclaim of early resistance
🎯 TP2: $4.00 – volume spike zone
🎯 TP3: $5.00+ – potential sentiment surge / short squeeze zone
📢 Disclaimer: This is not financial advice. Always manage your own risk and do your own due diligence.

analyse eurusd *The content on this analysis is subject to change at any time without notice, and is provided for the sole purpose of assisting traders to make independent investment decisions.
HBARUSDT 4H Chart Analysis |Volume & Fibonacci Reaction in FocusHBARUSDT 4H Chart Analysis | Volume & Fibonacci Reaction in Focus
🔍 Let’s break down the latest HBAR/USDT setup, highlighting a clear technical reaction and a new opportunity on the horizon.
⏳ 4-Hour Overview
HBAR has completed a strong impulsive leg after breaking above the RR2 of the key reversal trendline, supported by notable volume confirmation. This impressive surge was then followed by a corrective leg—a healthy sign for bulls, especially for those who missed the initial breakout.
📉 Corrective Phase & Fibonacci Support
- The current corrective leg is characterized by decreasing volume, suggesting profit-taking rather than heavy selling pressure.
- Notably, price has reacted firmly at the 0.236 Fibonacci retracement level, aligning with classic pullback zones for continuation setups.
- This volume pattern shows traders are waiting for the next major move rather than exiting positions.
🔺 Bullish Continuation Setup
- A strong candle close above the $0.255 level on either the 1H or 4H timeframe will serve as a clear bullish confirmation.
- Such a breakout may pave the way for another impulsive leg upward, with the first upside target identified near $0.30—roughly 19% higher from the recent candle close.
📊 Key Highlights:
- The prior trend reversal was validated by surge in volume and momentum.
- Volume decline during the correction favors further upside rather than distribution.
- Price is respecting key Fibonacci levels, hinting at trend continuity.
- A confirmed close above $0.255 unlocks the next target at $0.30, marking a potential 19% move.
🚨 Conclusion:
HBAR is showing textbook trend continuation signals. For those sidelined after the initial move, the current consolidation offers a safer re-entry point, with actionable confirmation above $0.255. Stay alert for a strong candle close and keep the $0.30 target in view as bullish momentum builds.

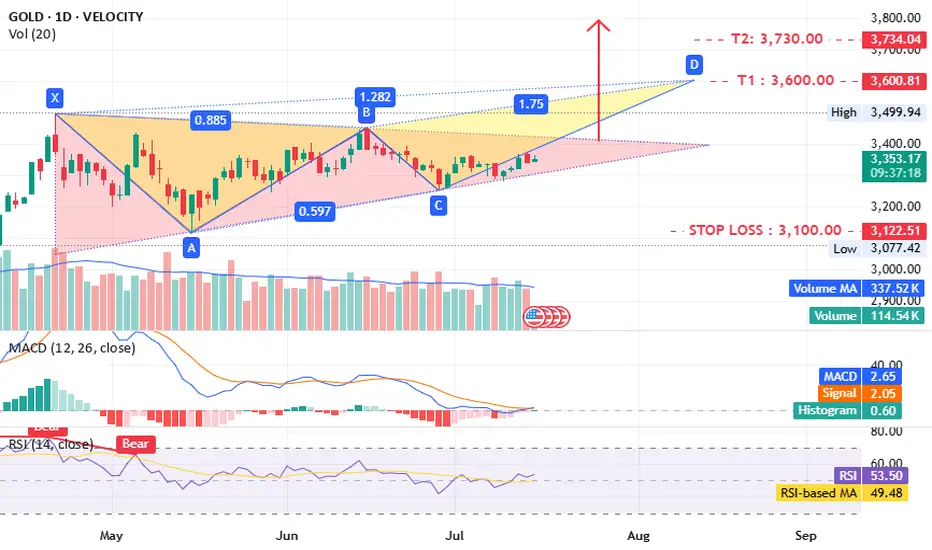
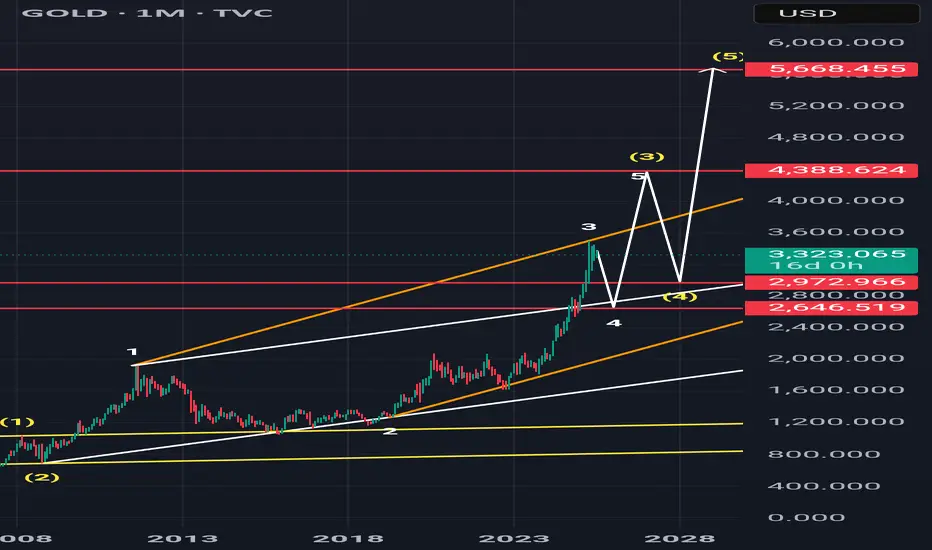
Gold what is next ?!!TVC:GOLD timeframe 1 day
is forming a potential triangle pattern, which could lead to a bearish setup.
The MACD and RSI indicators are positive, supporting this outlook. A close above 3400 would further confirm the idea.
Targets:
- T1: 3600
- T2: 3730–3800
Stop loss: 3100
Support: 3300–3260
Consider opening a long position now, with confirmation above 3400.
Disclaimer: This is not investment advice, only an analysis based on chart data. Consult your account manager before making any decisions. Good luck.