BNB/USDT 1D🕵️♂️ General context
• Steam: BNB/USDT
• Price: 649.52 USDT
• Time: 1D (daily interval)
• Currently, the reflection is underway after the inheritance, but the technical situation remains uncertain.
⸻
📈 Trend and market structure
• You can see a previous strong drop (visible long red candles).
• Currently, reflection is underway to the level of technical resistance (approx. 650–672 USDT).
• A medium -term inheritance trend is still in force - marked with an orange interrupted line of decreasing (inheritance) trend.
⸻
📊 Technical levels
🔹 Opora (green levels):
1. 651.01 USDT - the first tested resistance (current price right next to it).
2. 672.68 USDT - another resistance, above SMA (2), historically strong level of sales.
3. 700.81 USDT - strong psychological and technical level, tested in the past.
🔻 Support (red levels):
1. 636.40 USDT - short -term support (price maintaining just above this level).
2. 625.65 USDT - key support - if it is broken, a possible test of lower levels.
3. 607.62 and 595.27 USDT - subsequent support, where purchases appeared earlier (Long Knoty).
⸻
📉 Technical indicators
🔵 MacD
• Histogram comes out of red - a potential signal of Momentum change to upward.
• The MacD line begins to turn up to the signal line - possible Bullly Crossover soon (buy signal).
🟣 RSI
• RSI oscillates around line 40-50-it is a neutral zone with a slight tilt down, but RSI-Based has a possible reflection.
• Lack of purchase or sale - suggests that traffic can go both ways.
⸻
🔃 Medium walking (SMAS)
• The price is tested by several medium (green, red, blue line):
• SMA (1) and SMA (5) are similar and flat - no clear short -term trend.
• SMA (2) acts as a strong resistance at 672 USDT.
• Need to break out over 672.68 to recognize that the trend can turn around.
⸻
✅ Applications - technical scenarios
🔼 Bullish (upward) scenario:
• Crossing the level 651–672 USDT and closing the daily candle above.
• Confirmation by RSI> 50 and MacD crossover.
• Target: 700–710 USDT.
🔽 Bearish (inheritance) scenario:
• Price rejection with current resistance and descent below 636 → 625 USDT.
• If 625 falls, a possible drop in around 607/595 USDT.
• RSI may then fall into the sale zone.
⸻
🧠 Neutral / swing strategy
• Currently, the market in potential consolidation between 625 and 672 USDT.
• You can consider:
• Buying at the lower consolidation limit (625–636) with a stop-loss below 620.
• Short or Take Profit at the upper limit (670+) until it breaks out.
Fibonacci

PGY - Watching for a Pullback to Previous High or 20EMAWhy This Setup Has My Attention:
Strong uptrend , but currently looks overextended
Approaching the 1.618 fib level — often a profit-taking zone
Heavy green volume recently on the daily chart = demand still present
I’m looking for a pullback to $20.60, which aligns with the previous high and the 0.382 fib retracement — a healthy spot for price to reload if bulls are still in control.
Plan:
Entry Zone: $20.60 area or bounce off the 20EMA
Stop: Below the most recent swing low at time of entry
Profit: Wherever 1.618 fib is, using the high and low of the wave down.
If $21+ breaks and holds: I’ll look for a retest entry on strength

#btc #btcusd #elliottwave long buy setup wave 5/3 30Jun25This count is based on my assumptions so anything can happen not a trading or financial advice just for educational purposes only kindly do your own ta thanks trade with care good luck.

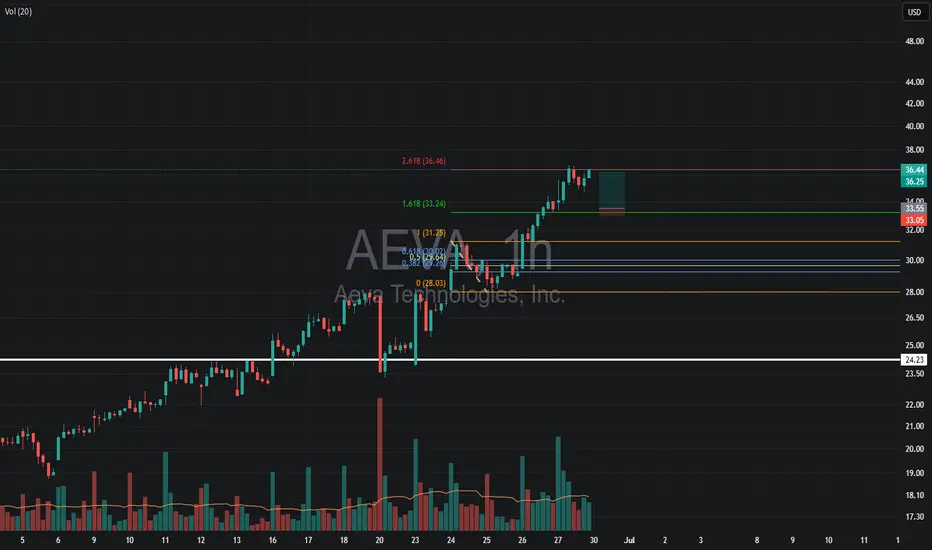
AEVA – Planning a Pullback Entry in a Strong UptrendWhy I Like This Setup:
Powerful daily uptrend — momentum clearly to the upside
Buyers stepping in on every dip — strong demand showing up consistently
Game Plan:
Entry Zone: Watching the 1.618 fib level for a pullback and bounce
Stop: Just below that 1.618 fib — clean invalidation point
Target: Previous high, but with this strength, I’ll likely use a trailing stop once price moves in my favor
Letting the trend do the heavy lifting on this one
Trading the Impulse Rally Retracement — Price and Time Symmetry The Stop Loss Triangle is back!
This time with BITSTAMP:BTCUSD coming off its recent impulse rally. For those of you that aren’t familiar with my strategy — let me start from the beginning…
This concept involves positioning against the opposing decline in price and time as a precursor to our theoretical projection. If the underlying enters our predetermined faded cross-section, the stop loss is triggered to prevent sideways consolidation and the erosion of contract premiums or leverage decay.
This inherently ‘sclene’ triangle is constructed by drawing a straight trend line through the bottoming reversal candle and the furthest projection in price and time symmetry (78.6%) of the retracement. Once connected, draw a vertically positioned straight line from the highest or lowest point in the previously identified retracement to the bottom reversal candle area once again. To create a ‘right triangle’, now turn 90 degrees towards the final point, which is determined by the nearest projection in price and time symmetry (38.2%). This allows time after the imposed price and time date, yet not enough for premium or leverage decay to become significant.
In its entirety, this forms the stop loss triangle.
I encourage my followers to identify and explore the system on their own. As always, feel free to ask me anything related to it. We’ll follow along and you’ll be amazed at the precision of Fibonacci symmetry.
CHEERS

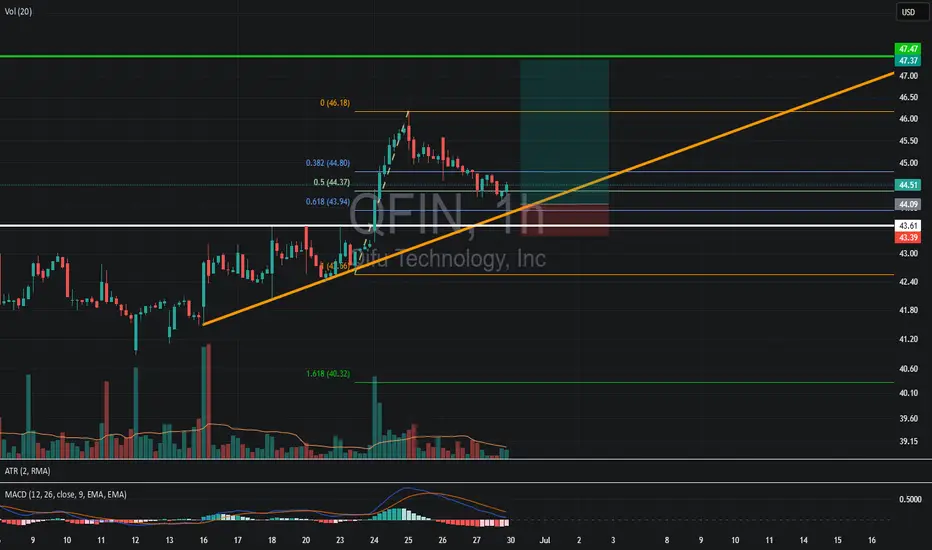
QFIN – Eyeing a Pullback Entry Near $44 Trendline SupportWhy This Caught My Eye:
Consistent green volume > red — demand remains strong
June 24: Big green candle on high volume
Last 3-day pullback = low volume → likely healthy retrace
0.618 fib lines up with the uptrend support — strong confluence
My Plan:
Entry Zone: Around $44 after a bounce off the trendline
Stop: Below the trendline and the prior resistance (now support)
Target: 1.618 fib extension (measured from expected entry point)
Clean price action + volume story makes this one worth watching.
UTI on WatchWatching for a Breakout Above 52-Week High – $36.65
Why I'm Watching:
Strong weekly uptrend
Heavy green volume on Friday = buying interest
MACD curling up – possible momentum shift
Bear Flag? Maybe… But
The current flag has lasted 13 days with no breakdown attempt — that hesitation leans more like consolidation than weakness. I’m leaning bullish unless we lose key support.
Plan:
Entry Trigger: Break and close above $36.65 (1.618 fib extension + retest of 52wk high)
Stop: Below the previous 52-week high (potential support level)
Sharing my thought process — not financial advice. What’s your read on this setup?

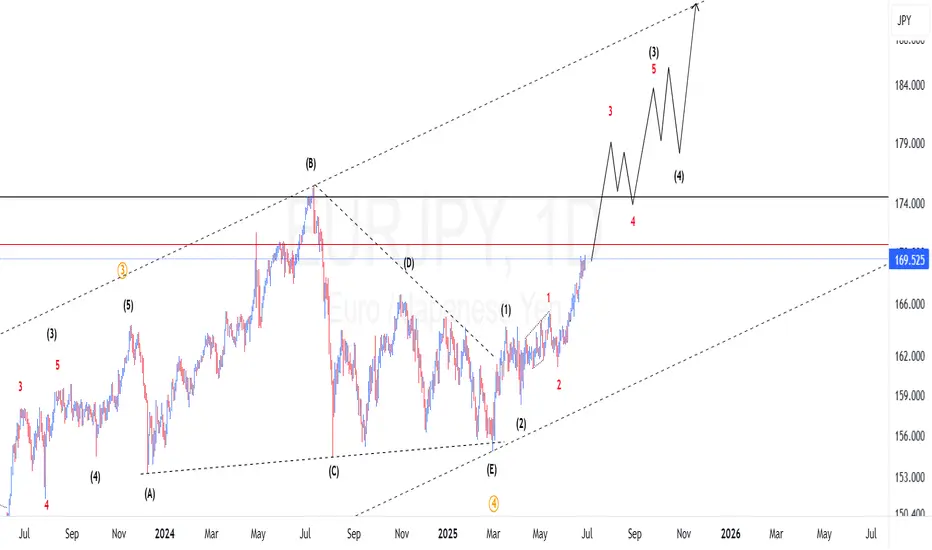
EURJPY bullish continuation Price is still on uptrend on 3rd wave wave. What we should expect is small pullbacks and continuation up.
GBPAUD Elliot waves Short IdeaPrice made a leading diagonal to the downside which completed potentially wave 1. At it is currently pulling back up for wave 2 which unfolds as a zigzag ABC. If this count is correct we should expect price to find resistance on the golden zone which is in line with the upper trendline of the channel. So we should be looking to short GBPAUD at either upper trendline of the channel or somewhere between 50% and 61.8% fib retracement.

NZDUSD Elliotwave Update: Is wave 2 complete?We have seen from our previous count price made a leading diagonal and have pulled back down with 3 waves. The question is whether the correction is complete and we have already resumed the bullish momentum. Us long us we are not taking the previous high then we should expect price to pullback down to complete wave 2 at 38.2 fib. If we are correct then we should expect price to drop in the coming days.

XAUUSD Elliot wave update: Is wave 4 still in play?From our previous count we were anticipating a drop for 4th wave completion. We can see now we have been dropping as anticipated. Given the current wave structure I am expecting a double 3 (wxy) to complete this 4th wave. If we are correct then we should expect price to continue down from current position before pulling back up and fall one more time. To take advantage of the move if not caught at the top, one should find areas where price will find resistance to short the market.

PSYCHOLOGY OF A CRYPTO CYCLEWe expected a pullback, and now thats behind us!😅
The market is back on track, and we are firmly in the #Belief phase of the bull cycle.
With heavy short liquidity stacked around $110K, a push into that zone could trigger a short squeeze, launching us into the #Thrill phase.
And if momentum holds, all signs point to #Euphoria by late 2025.
Favorites so far this cycle:
🥑 POLONIEX:GUACUSDT 🔗 POLONIEX:LLUSDT 🎮 KUCOIN:MYRIAUSDT
🌐 HTX:SYNTUSDT 🧪 MEXC:DEAIUSDT 🏠 OKX:PRCLUSDT
🧱 MEXC:YBRUSDT ⛏️ MEXC:KLSUSDT 🧩 $RUJIUSDT
Comment below your favorite coins!

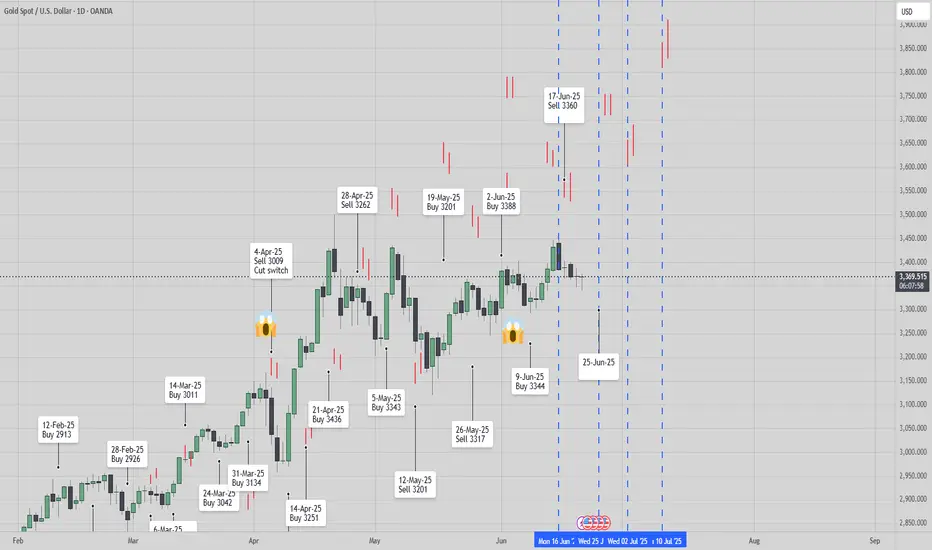
[ TimeLine ] Gold 25-26 June 2025📆 Today is Friday, June 20, 2025
📌 Upcoming Gold Signal Dates:
• June 25, 2025 (Wednesday) — Single-candle setup
• June 25–26, 2025 (Wednesday–Thursday) — Two-candle combined range
🧠 Trading Plan & Notes
✅ Gold recently experienced a sharp bearish reversal of approximately 1100 pips, after touching the key psychological resistance at 3451.
🔁 Several re-entry opportunities have emerged, especially around Fibonacci retracement levels, which have acted as reliable reaction zones.
✅ I will personally trade both signals (June 25 and June 25–26) as part of my ongoing live research and strategy development.
⚠️ If you're feeling cautious, it’s completely valid to skip the June 25 signal and prioritize the 2-day range (June 25–26) instead for added confirmation.
📋 Execution Plan
🔹 Wait for the Hi-Lo range to fully form from the selected candle(s):
▫ Ranges will be initially marked with purple lines on the chart.
▫ After market close, I’ll update with buffer zones, Fibonacci levels, and other supporting indicators.
🔹 Entry Trigger:
• Executed only when price breaks out beyond the range, including a 60-pip buffer.
🔹 Risk Management – Recovery Rule:
• If the trade hits Stop Loss (SL), we will cut/switch direction and double the position size on the next valid breakout setup for potential recovery.
📉📈 Chart Reference
🔗 Copy & paste this into your TradingView URL: TV/x/fzDQQ7oo/
Gala (GALA)On the above 4-day chart price action has recently corrected 50% since a sell signal in late January (ask below if you wish to see). A number of reasons now exist to be long..
1) You know why.
2) Price action finds support on the golden ratio.
3) There is a positive divergence between RSI and price action.
4) The bull flag channel, naturally a bullish pattern on confirmation of a breakout to the upper side of the channel.
5) A breakout confirmation will result in a 300% gain from current levels.
Is it possible for price action to fall further? Sure.
Is it probable? No.
Ww
Type: Trade
Risk: <= 6%
Timeframe to open: Now
Return: 300%

HYPE — How to Combine Fibonacci, VWAP and Market StructureAfter an explosive +392% rally in just 70 days — from $9.298 to a peak of $45.8 — HYPE has entered a consolidation range as expected. Structurally, this appears to be a 5-wave impulse now transitioning into a corrective ABC pattern. Based on current structure, we may now be forming wave B.
What’s Unfolding Now?
A potential Head & Shoulders pattern is developing, with price currently working on the right shoulder. The $40 mark stands out as a key resistance — both technically and psychologically:
0.618 Fibonacci retracement of the down move sits at $40.108
Structural resistance from prior highs
Ideal area for a short rejection
🎯 Short Setup:
Entry: Laddered short between 0.618 ($40.108) and 0.786 ($42.611)
Stop-Loss: Above $44 (after rejection adjust to entry)
Target: $28–$27 zone
R:R potential: 1:3 up to 1:9 depending on entry quality
📍 Why $28–$27 Is Key Support:
0.5 Fibonacci retracement of entire +392% rally sits at $27.549
Anchored VWAP from the rally origin ($9.298) aligns around this zone
Weekly & Monthly S/R convergence
VAH (Value Area High)
0.618 Fibonacci Speed Fan also aligns as dynamic support
Fair Value Gap (FVG) lies in this region
Weekly 21 EMA at $28.05/Weekly 21 SMA at $24.10 — both key moving averages providing layered support and trend structure
📐 Bonus Confluence Insight:
If this is indeed wave B, then projecting a 0.786/1.0 Trend-Based Fib Extension from wave A aligns well with the 0.5 fib retracement at $27.5.
📚 Educational Insight:
Stacking confluences such as Fibonacci retracements, anchored VWAPs, volume zones, EMA/SMA levels, and harmonic structures helps identify high-probability zones where smart money is likely to act. These levels become even more powerful when they align across multiple tools and timeframes. Always confirm with price action.
_________________________________
💬 If you found this helpful, drop a like and comment!
Want breakdowns of other charts? Leave your requests below.

USDJPY Potential UpsidesHey Traders, in tomorrow's trading we are monitoring USDJPY for a buying opportunity around 144.400 zone, USDJPY is trading in an uptrend and currently is in a correction phase in which it is approaching the trend at 144.400 support and resistance area.
Trade safe, Joe.

BITCOIN → Pause for consolidation before growth. 115K?BINANCE:BTCUSDT focus on the structure on D1. The market is forming local resistance and consolidation after growth. The fundamental background is positive. BTC is following the SP500
The market is recovering in line with the stock market (SP500, NQ) after the de-escalation of the situation in the Middle East. The fall in the DXY is also providing support.
Technically, the focus is on the consolidation phase after the distribution triggered by a false breakout of 100K. The price stopped before the resistance at 108100 and rolled back to 106500, confirming the boundaries of the local trading range, the essence of which is a pause for a breather before a possible continuation of growth. The structure on D1 is compression towards resistance. The trigger is 108100, and a breakout of this level could trigger distribution towards 110500 and ATH.
Despite the fact that the market is under a cascade of resistance (resistance: 108100, 110400, 11900 (ATH)), an important nuance is that after strong growth, the price moved into accumulation in the 100K-110K range on D1-W1, and there are no reasons for a decline yet.
Resistance levels: 108100, 108900, 110400
Support levels: 106500, 104650
If the market structure within 106500 - 108100 remains unchanged and BTC continues to storm the consolidation resistance in the “compression to level” format and stick to the level, the chances of a breakout will increase. I do not rule out the possibility of a pullback to 106500, 105650 before a possible rise to ATH.
Best regards, R. Linda!

XOM daily setup to $117XOM gave us a 50% retracement on the daily (I use 24 hour chart since it includes after hours), swept a key level, and bouncing off bullish FVG.
We break and hold $110.94 and we're in business.
Targeting $117.05. I have July 18 $110 calls.

QUBT on WatchLooking for a breakout above the gap at $18.83.
Why:
Uptrend
Consolidating since the 11th
MACD looking ready to turn bullish
Target is right below $25.31 (1.618 fib)
Stop loss is below the close of the gap.

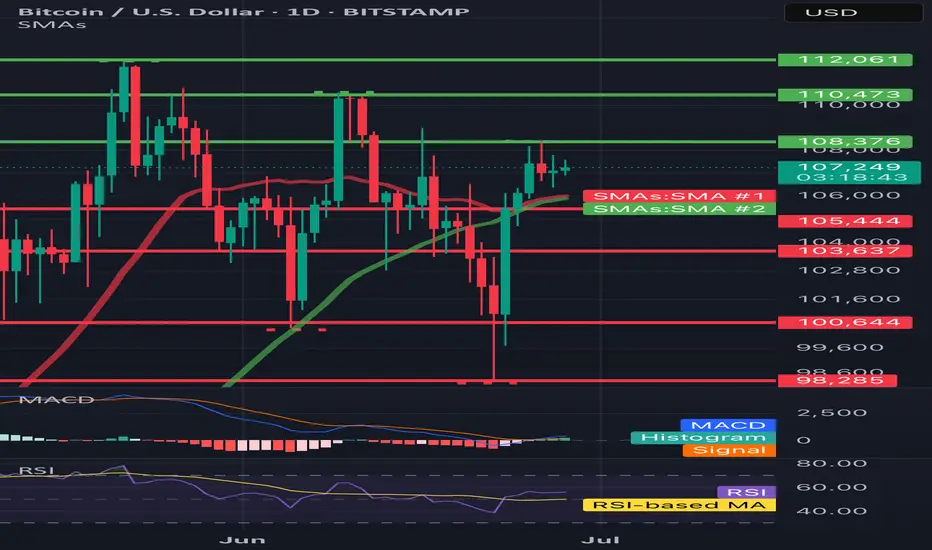
BTC/USD 1DHello everyone, let's look at the 1D BTC chart to USD, in this situation we can see how the 3rd peak formed us and we are currently fighting to maintain the price or a potential output up if we do not see a try to break out, you can expect a stronger relief.
However, let's start by defining goals for the near future the price must face:
T1 = 108376 $
T2 = 110473 $
Т3 = 112061 $
Let's go to Stop-Loss now in case of further declines on the market:
SL1 = 105444 $
SL2 = 103637 $
SL3 = 100644 $
SL4 = 98285
Looking at the RSI indicator, we see
As we entered the upper part of the indicator again, however, there is still a place to try to grow.
FEROZ LongFEROZ just touched its channel top this month and breaking it (410) will open up its way to further upside targets of 482, 581 and then 722 in medium term.
Further, a beautiful inverse head and shoulders formation is already complete... Breakout expected next month insha Allah.
Its my personal opinion, not a buy / sell call

SITC Long Trade - Breakout almost confirmedSITC has given a breakout from Fib 0.618 of previous all-time high level on monthly time frame which will be confirmed on monthly closing.
Next targets are 540 (Fib 0.786) and then previous all time high 630.
Crossing it will open up gates to 1,000+
RSI is in bullish zone. Volumes of last two days confirm the breakout as well.
Its my personal analysis, not a buy / sell call.

BTCUSD - Weekly Bullish Momentum Targeting $115K, Eyeing $137KI'm currently observing a strong bullish structure on the weekly timeframe for Bitcoin, trading at $107,305 at the time of writing. The current weekly candle shows aggressive buying pressure, and if this momentum sustains through the close, we could see a continuation toward the $115,200 level.
There’s visible liquidity and unfilled price action around $109,500, which I expect to be taken out as price moves upward. Once cleared, Bitcoin could either:
1. Continue straight to \$115K+, or
2. Briefly retrace before resuming the uptrend.
From a Fibonacci retracement perspective, BTC previously pulled back to the 38.2% level ~$76,000 before launching into the current leg up, a classic continuation signal within an uptrend.
Given the current price action and historical behavior, I’m targeting the following levels:
Short-term target: $115,200
Long-term target (multi-month): $137,200-$137,300
Stop loss and entry would depend on the timeframe of execution, but from a weekly structure, invalidation would occur if BTC breaks below the last major higher low around $98,000-$96,000.
Let’s see how this weekly candle closes. If the momentum holds, the next leg could already be unfolding.
