XOM daily setup to $117XOM gave us a 50% retracement on the daily (I use 24 hour chart since it includes after hours), swept a key level, and bouncing off bullish FVG.
We break and hold $110.94 and we're in business.
Targeting $117.05. I have July 18 $110 calls.
Fibonacci

QUBT on WatchLooking for a breakout above the gap at $18.83.
Why:
Uptrend
Consolidating since the 11th
MACD looking ready to turn bullish
Target is right below $25.31 (1.618 fib)
Stop loss is below the close of the gap.

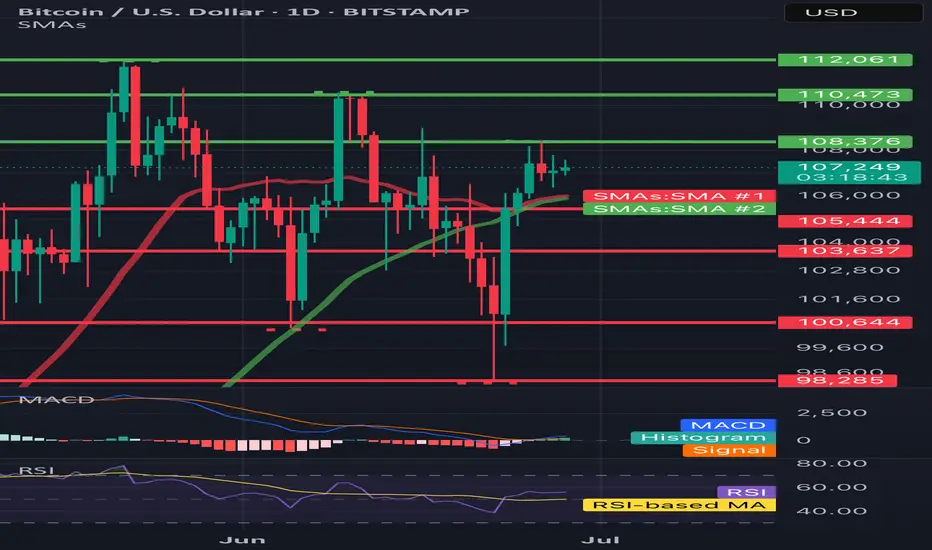
BTC/USD 1DHello everyone, let's look at the 1D BTC chart to USD, in this situation we can see how the 3rd peak formed us and we are currently fighting to maintain the price or a potential output up if we do not see a try to break out, you can expect a stronger relief.
However, let's start by defining goals for the near future the price must face:
T1 = 108376 $
T2 = 110473 $
Т3 = 112061 $
Let's go to Stop-Loss now in case of further declines on the market:
SL1 = 105444 $
SL2 = 103637 $
SL3 = 100644 $
SL4 = 98285
Looking at the RSI indicator, we see
As we entered the upper part of the indicator again, however, there is still a place to try to grow.
FEROZ LongFEROZ just touched its channel top this month and breaking it (410) will open up its way to further upside targets of 482, 581 and then 722 in medium term.
Further, a beautiful inverse head and shoulders formation is already complete... Breakout expected next month insha Allah.
Its my personal opinion, not a buy / sell call

SITC Long Trade - Breakout almost confirmedSITC has given a breakout from Fib 0.618 of previous all-time high level on monthly time frame which will be confirmed on monthly closing.
Next targets are 540 (Fib 0.786) and then previous all time high 630.
Crossing it will open up gates to 1,000+
RSI is in bullish zone. Volumes of last two days confirm the breakout as well.
Its my personal analysis, not a buy / sell call.

BTCUSD - Weekly Bullish Momentum Targeting $115K, Eyeing $137KI'm currently observing a strong bullish structure on the weekly timeframe for Bitcoin, trading at $107,305 at the time of writing. The current weekly candle shows aggressive buying pressure, and if this momentum sustains through the close, we could see a continuation toward the $115,200 level.
There’s visible liquidity and unfilled price action around $109,500, which I expect to be taken out as price moves upward. Once cleared, Bitcoin could either:
1. Continue straight to \$115K+, or
2. Briefly retrace before resuming the uptrend.
From a Fibonacci retracement perspective, BTC previously pulled back to the 38.2% level ~$76,000 before launching into the current leg up, a classic continuation signal within an uptrend.
Given the current price action and historical behavior, I’m targeting the following levels:
Short-term target: $115,200
Long-term target (multi-month): $137,200-$137,300
Stop loss and entry would depend on the timeframe of execution, but from a weekly structure, invalidation would occur if BTC breaks below the last major higher low around $98,000-$96,000.
Let’s see how this weekly candle closes. If the momentum holds, the next leg could already be unfolding.

highest ever weekly close : breakout on chartsHPCL witnessed its highest ever weekly frame close with a clean clear breakout
volumes are healthy with stock clocked more than 11% jump last week.
rsi witnessed healthy improvement and suggest the momentum to continue

Solana coin Long setupIn this video I go through the current price action and talk about how the 126$ target level was recently reached for a clean long entry and on the daily timeframe we printed a higher low .
I expand on my thoughts for a continuation to the upside and to retest some higher levels of resistance 180$s and time will tell if we print a higher high at the 180$s before retesting the $200 zone .

GBPUSD Potential DownsidesHey Traders, in the coming week we are monitoring GBPUSD for a selling opportunity around 1.37400 zone, GBPUSD is trading in a downtrend and currently is in a correction phase in which it is approaching the trend at 1.37400 support and resistance area.
Trade safe, Joe.

Bitcoin: Curve AdjustmentsBottoms can be expressed as a curve which matches logarithmic growth patterns. In the long-term perspective it serves as signal of trend's transition phase in broader scale. Coordinate of top adjusted accordingly.
Extending them is crucial because together they gives boundaries of range compression. Some sort of wave limits which help to clarify price-based levels.


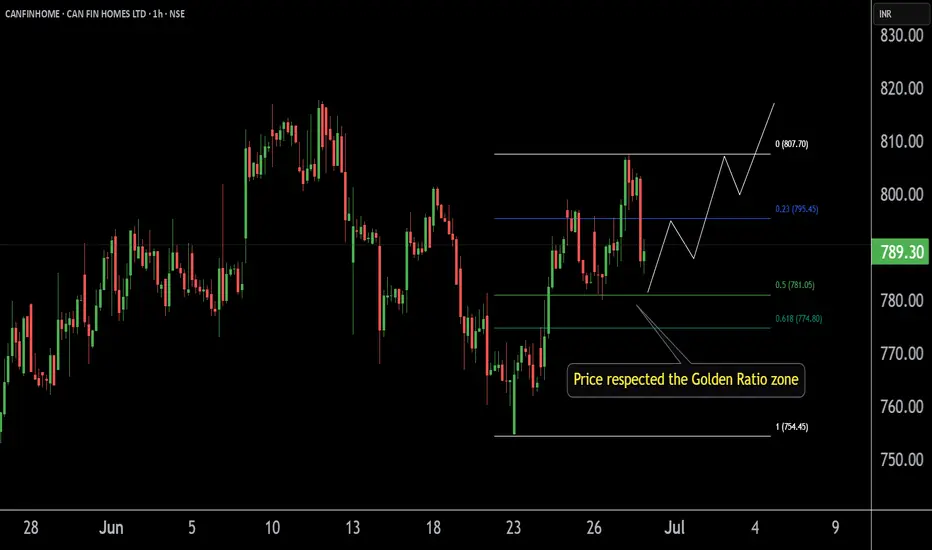
CANFINHOME'S Key ZoneThis is the 1 hour chart of CANFINHOME.
Canfinhome is taking support at the Fibonacci Golden Ratio zone.
If this zone is sustain then we may higher price in CANFINHOME .
Thank You !!
GOLD 4H: not all that glitters is bullish...The 4H chart shows a clean descending triangle breakdown. Price failed to reclaim the trendline and was rejected under both MA50 and MA200. The bounce into 3325–3340 was absorbed — classic liquidity sweep and fade. Volume confirms bearish control.
Technically, the breakdown below 3320 opens the way toward $3293 (1.0 Fibo), $3250 (1.272 extension), and final target at $3195 (1.618), where buyers might step in. RSI supports the continuation without signs of reversal. Structure broke — and the market is telling us where it's heading.
Tactical plan:
— Entry at market or on a retest of $3325–3335
— Targets: $3293 → $3250 → $3195
— Stop: above $3340 (above MA50 and broken trendline)
When gold looks shiny, smart traders look deeper. This breakout isn’t golden — it’s a trap for late bulls.

SP500: Wave Estimation via FibsRegularities
Common angle
To estimate where it's heading to we use those recursive patterns and map them through fib scaling. Overall systematic wave expands in similar geometric narrative but with a compressed cycle.

Lululemon Stock Chart Fibonacci Analysis 062725Trading Idea
1) Find a FIBO slingshot
2) Check FIBO 61.80% level
3) Entry Point > 225/61.80%
Chart time frame:D
A) 15 min(1W-3M)
B) 1 hr(3M-6M)
C) 4 hr(6M-1year)
D) 1 day(1-3years)
Stock progress:C
A) Keep rising over 61.80% resistance
B) 61.80% resistance
C) 61.80% support
D) Hit the bottom
E) Hit the top
Stocks rise as they rise from support and fall from resistance. Our goal is to find a low support point and enter. It can be referred to as buying at the pullback point. The pullback point can be found with a Fibonacci extension of 61.80%. This is a step to find entry level. 1) Find a triangle (Fibonacci Speed Fan Line) that connects the high (resistance) and low (support) points of the stock in progress, where it is continuously expressed as a Slingshot, 2) and create a Fibonacci extension level for the first rising wave from the start point of slingshot pattern.
When the current price goes over 61.80% level , that can be a good entry point, especially if the SMA 100 and 200 curves are gathered together at 61.80%, it is a very good entry point.
As a great help, tradingview provides these Fibonacci speed fan lines and extension levels with ease. So if you use the Fibonacci fan line, the extension level, and the SMA 100/200 curve well, you can find an entry point for the stock market. At least you have to enter at this low point to avoid trading failure, and if you are skilled at entering this low point, with fibonacci6180 technique, your reading skill to chart will be greatly improved.
If you want to do day trading, please set the time frame to 5 minutes or 15 minutes, and you will see many of the low point of rising stocks.
If want to prefer long term range trading, you can set the time frame to 1 hr or 1 day.

FTSE 100 Wave Analysis – 27 June 2025
- FTSE 100 reversed from support level 8700.00
- Likely to rise to resistance level 8900.00
FTSE 100 index recently reversed up from the support level 8700.00 (which stopped wave 4 at the end of May, as can be seen from the daily FTSE 100 chart below) intersecting with the lower daily Bollinger Band and the 50% Fibonacci correction of the upward impulse from May.
The upward reversal from the support level 8700.00 stopped wave A of the active ABC correction (4) from the start of June.
Given the clear daily uptrend, FTSE 100 index can be expected to rise to the next resistance level 8900.00, which stopped the previous impulse wave (3).

Are we out of the woods? BTC has been trading above the golden pocket for three consecutive days. This should give us a technical target of at least 110k, where the next major resistance lies.

ADA ELLIOT WAVE COUNTADA ELLIOT WAVE COUNT. Correct me if I’m wrong. I think a $1.50-$2 ADA this cycle is possible. Not unreasonable.

AUD/USD Coils Below Critical ResistanceThe June range is preserved heading into the close of the month with a massive outside-weekly reversal taking Aussie back into key resistance on Friday. Note that momentum is approaching the 60-level for the first time this year and a break higher alongside a breach above 6550 could fuel a substantial rally here- watch the weekly close.
Initial support rests with the February high-week close (HWC) at 6357 and is backed closely by 6290/6315- a region defined by the yearly low-week close (LWC) and the 38.2% retracement of the yearly range. Note that the median-line converges on this level over the next few weeks and we’ll reserve this threshold as our bullish invalidation level- a break / weekly close below would threaten downtrend resumption toward the next major technical consideration at 6162/79.
A topside breach / close above this key pivot zone is needed to fuel the next leg of the advance with key resistance seen at the 2019 lows near 6670. Ultimately a break above the upper parallel (blue) would be needed to suggest a more significant trend reversal is underway with subsequent resistance objectives eyed at the 2024 HWC / yearly open near 6795-6810 and 6900.
Bottom line: An outside-weekly reversal has covered the entire monthly range with the Australian Dollar now testing critical resistance for an eighth-consecutive week. From a trading standpoint, losses should be limited to the 52-week moving average IF price is heading higher on this stretch with a close above 6550 needed to fuel the next move.
-MB

HTL is at the best level for taking a position.HTL is at the best level for taking a position.
It has already taken the Fib retracement, and is taking support from a trendline

Gold is near the 0.618 levelGold is near that 0.618 level, going to watch it closely from here. We might not get an entry until Sunday at 6pm NY time when market open.
Key Level to watch 3249, 3194
We need SPY / ES to come down for gold to gain momentum.

BTC Looking for a Wave 2 Reset Before the Real MoveBITSTAMP:BTCUSD looks like it just wrapped a clean ABC correction and kicked off a fresh 5-wave impulse. We’ve probably topped out on wave 1 heading into the weekend, Stoch RSI is flashing overbought, price is hitting resistance just under 108.3K, and we’re also seeing some bullish divergence creeping in.
I’m expecting a pullback from here, ideally into that 0.5–0.618 retrace zone (103.2K–104.4K). That would line up well with the mid-channel and EMA support. From there, we could be set up for a proper wave 3 breakout (as long as we don't get any more surprise tariffs or wars).
Fed still leaning dovish into Q4, even with some Q3 inflation and tariff noise. Rate cut odds ramp into Sept/Dec, so bigger picture looks constructive. In my eyes, the longer the FED holds off on these cuts, the longer this cycle extends.
Key zones I’m watching:
Support: 105.3K > 103.2K > 100.8K
Resistance: 108.3K > 112K > 114.5K+
If we dip and hold structure, I’ll be watching for confirmation to load into wave 3.

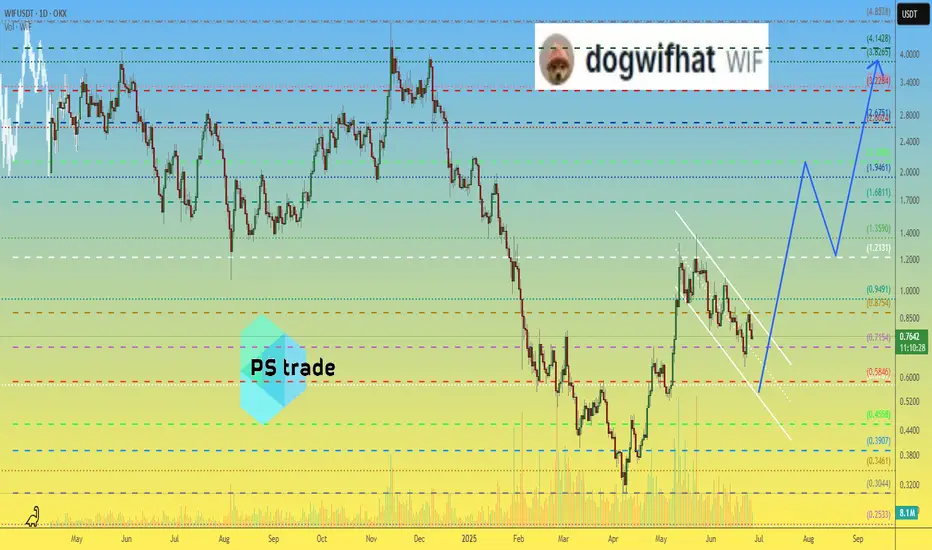
dogwifhat WIF price analysis🤪 "They" are trying to breathe "new life" into #WIF . And if they manage to keep the price of OKX:WIFUSDT above $0.55, this plan will have a chance of success.
So what do we have:
◆ #WIF holders need to keep their fingers crossed that everything will work out and there will soon be growth, and with it a chance to get out of a prolonged "draw fall"
◆ Traders need to wait for confirmation that the price of #WIFUSD is holding steady above $0,55.
And no large trading leverage, because this is a fairly volatile meme coin, even x5 leverage, which allows for a -19% error, or x3, which forgives a “miss” of -32% from the entry point, can liquidate your deposit when trading volatile assets.
⁉️ Do you believe that the price of #dogwifhat can still return to the $4 range with a corresponding project capitalization of $4 billion?
_____________________
Did you like our analysis? Leave a comment, like, and follow to get more