NQ Power Range Report with FIB Ext - 6/23/2025 SessionCME_MINI:NQU2025
- PR High: 21787.00
- PR Low: 21566.75
- NZ Spread: 491.75
Key scheduled economic events:
09:45 | S&P Global Manufacturing PMI
- S&P Global Services PMI
10:00 | Existing Home Sales
Open weekend gap down ~0.33%
Session Open Stats (As of 12:45 AM 6/23)
- Session Open ATR: 382.81
- Volume: 38K
- Open Int: 234K
- Trend Grade: Neutral
- From BA ATH: -4.8% (Rounded)
Key Levels (Rounded - Think of these as ranges)
- Long: 22096
- Mid: 20383
- Short: 19246
Keep in mind this is not speculation or a prediction. Only a report of the Power Range with Fib extensions for target hunting. Do your DD! You determine your risk tolerance. You are fully capable of making your own decisions.
BA: Back Adjusted
BuZ/BeZ: Bull Zone / Bear Zone
NZ: Neutral Zone
Fibonacci

Bitcoin Stock Chart Fibonacci Analysis 062225Trading Idea
1) Find a FIBO slingshot
2) Check FIBO 61.80% level
3) Entry Point > 99,063/61.80%
Chart time frame:B
A) 15 min(1W-3M)
B) 1 hr(3M-6M)
C) 4 hr(6M-1year)
D) 1 day(1-3years)
Stock progress:B
A) Keep rising over 61.80% resistance
B) 61.80% resistance
C) 61.80% support
D) Hit the bottom
E) Hit the top
Stocks rise as they rise from support and fall from resistance. Our goal is to find a low support point and enter. It can be referred to as buying at the pullback point. The pullback point can be found with a Fibonacci extension of 61.80%. This is a step to find entry level. 1) Find a triangle (Fibonacci Speed Fan Line) that connects the high (resistance) and low (support) points of the stock in progress, where it is continuously expressed as a Slingshot, 2) and create a Fibonacci extension level for the first rising wave from the start point of slingshot pattern.
When the current price goes over 61.80% level , that can be a good entry point, especially if the SMA 100 and 200 curves are gathered together at 61.80%, it is a very good entry point.
As a great help, tradingview provides these Fibonacci speed fan lines and extension levels with ease. So if you use the Fibonacci fan line, the extension level, and the SMA 100/200 curve well, you can find an entry point for the stock market. At least you have to enter at this low point to avoid trading failure, and if you are skilled at entering this low point, with fibonacci6180 technique, your reading skill to chart will be greatly improved.
If you want to do day trading, please set the time frame to 5 minutes or 15 minutes, and you will see many of the low point of rising stocks.
If want to prefer long term range trading, you can set the time frame to 1 hr or 1 day.

Crypto $TOTAL Market Cap Hopeful Weekly CloseWhat a wild close to the Week for the Crypto CRYPTOCAP:TOTAL Market Cap
Closed just above the 50% Gann level within the POI, but failed to close above the EMA9.
Strong bounce off the SMA20 still shows bull have some gas left in the tank, but I suspect we go lower with such a massive bearish candle on the week.
SMA50 is ~2.8T

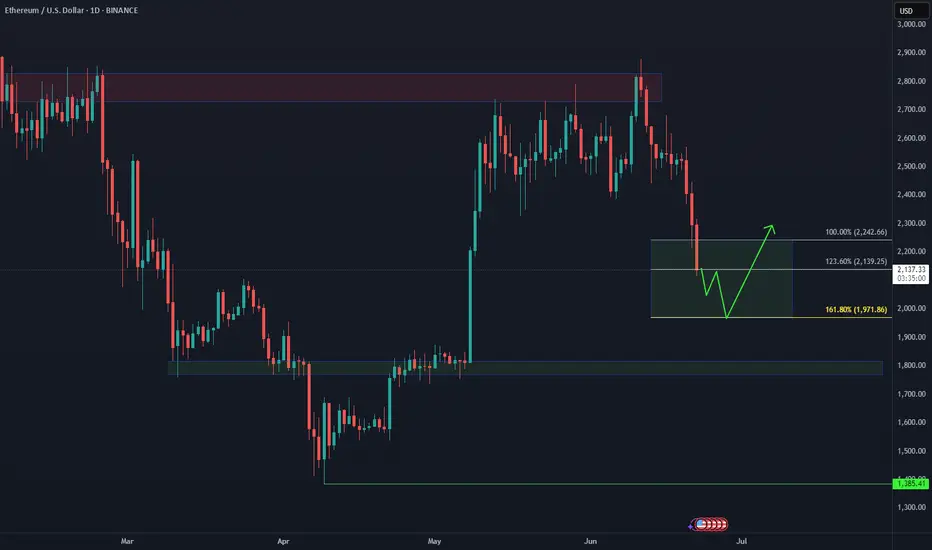
Ethereum: How Deep Into the Buying Area?📉 CRYPTO:ETHUSD is currently testing the extreme buying zone $2140–$1970 — a key area where a bullish reaction is anticipated. But if the bounce fails to materialize next week, eyes shift to the next potential demand zone near $1800.
This level aligns with prior structure and could offer a stronger base for the next leg higher — as long as the broader structure remains intact.
TOTAL 2 Analysis (6H)The TOTAL2 chart — representing the altcoin market cap excluding Bitcoin — currently shows signs of weakness. A double top formation has emerged and is actively playing out. In addition, a micro trend change of character has clearly appeared, further validating short-term bearish pressure.
Technical Observations:
Price recently retested a broken support level and failed to reclaim it — a typical bearish confirmation.
In such scenarios, it’s common for the price to decline at least the depth of the double top formation.
However, it’s important to note that macro trend indicators still remain bullish, so entering aggressive short positions is not advised. Instead, consider setting alerts at the key reversal zones marked on the chart — these levels are likely to trigger a strong rebound.
If TOTAL2 breaks above the $1.23T resistance, this double top analysis becomes invalid.
— Thanks for reading.

USDT Dominance Update (2H)The USDT Dominance (USDT.D) chart — often referred to as the “reverse chart of crypto” — is currently showing signs of strength. On the micro time frame, a new impulsive wave structure has emerged, and we are likely progressing through wave 3 of this formation.
Wave 3 appears to be targeting the 4.88% level.
A minor correction (wave 4) may follow.
Ultimately, wave 5 is projected to reach the 5.00% zone.
Market Implications:
If this scenario unfolds as expected:
Bitcoin could down toward the $100,000–$101,000 range.
However, altcoins may face a sharp correction, with potential losses of 15–20%, exacerbated by the rising BTC dominance and capital flow concentration.
⚠️ While macro bullish momentum remains intact for the market, this short-term USDT.D surge could present a temporary but significant shakeout, especially across the altcoin sector.
— Thanks for reading.

Gold Technical ✅ Entry Level (Long Position):
Ideal entry zone: Between $3,360 – $3,370
This is near the Wave (4) low and just above the ascending channel support line.
Also aligns with the 23.6% Fibonacci retracement level, where price has shown signs of support.
---
🎯 Take Profit (Exit Levels):
These targets are based on Fibonacci extensions and the upper boundary of the channel:
1. TP1: $3,400 (50.0% Fib level) – conservative target, aligns with minor resistance.
2. TP2: $3,415 (61.8% Fib level) – key Fibonacci golden ratio and likely Wave (5) area.
3. TP3: $3,435–$3,440 (upper channel line) – aggressive target, aligns with 100% extension and projected Wave (5) peak.

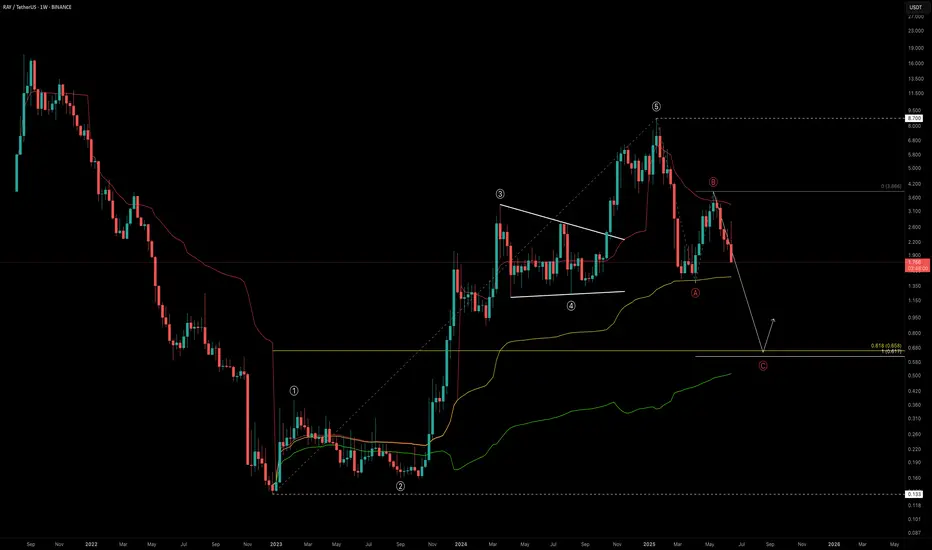
RAY Outlook: Is a -60% Drop the Reset We Need?RAY marked its bottom in December 2022 at just $0.133, entering a prolonged accumulation phase that lasted nearly a year. Then, in late 2023, it broke out into an explosive bull run, skyrocketing +6421% over 756 days and peaking at an impressive $8.70.
This run completed a full five-wave Elliott Wave structure. After topping out, RAY dropped -84% down to $1.388 — likely marking the Wave A correction. A strong relief rally followed into the $4 region before facing rejection at the yearly VWAP, possibly completing Wave B. Now, all signs point toward us being in the final Wave C of the larger corrective structure.
So, where could Wave C bottom out?
🔍 Fibonacci Confluence Zones (Log Scale)
Let’s assess the key levels with log-scaled Fibonacci tools:
🔹 Fib Retracement (from $0.133 low to $8.7 high):
The 0.618 fib retracement lies at $0.658
🔹 Trend-Based Fib Extension (Wave A → B projection for Wave C):
1.0 TBFE sits at $0.617
✅ These two levels align nearly perfectly, giving us a strong confluence zone between $0.62 and $0.66
Additional Confluences
Anchored VWAP Bands:
The 0.618 VWAP band multiplier also aligns with this $0.6 zone
Liquidity Perspective:
This level would wipe out long positions built over the past 550 days — clearing and potentially resetting the market
🚨 Fair Value Trend Model (FV Trend Model):
According to my Fair Value Trend Model indicator, the fair value for RAY currently sits around $0.78 — right in line with the broader confluence zone. This model uses log-log regression to estimate Bitcoin’s and other assets’ fair-value over time.
👉 Feel free to use the indicator
Just head over to my profile, click on the “Scripts” tab, and you can add the Fair Value Trend Model to your charts to experiment with it yourself.
Together, these technical elements form a compelling high-probability zone for long setups around $0.6–$0.8.
💡 Educational Insight — Why 0.618 is a Critical Fib Level
In Elliott Wave theory and harmonic trading, the 0.618 retracement is known as the "Golden Ratio" — often serving as a magnet for price during corrections. When paired with a 1.0 trend-based fib extension, it can mark exhaustion zones where Wave C concludes.
🔭 Summary: What’s Next for RAY?
Potential bottom zone: $0.61–$0.78
Watch for reversal signals like bullish candlestick patterns, volume spikes, or divergences
A drop to this zone would represent a -60% drawdown from current levels
Remember: High-probability setups don’t come every day — patience is your edge
Set alerts. Stay prepared.
_________________________________
💬 If you found this helpful, drop a like and comment!
Want breakdowns of other charts? Leave your requests below.
$BTC Heading to the Long-Awaited 200DMA Retest ~$96kFULFILL THY PROPHECY 📖
CRYPTOCAP:BTC making its way down to the long-awaited 200DMA retest, which just so happens to show confluence with the .618 Fib level at $96k.
RSI shows a bit more room to the downside as well.
Make sure to get those bids in!

BTC eyes on $97.8k: Last stop before 85.3k Golden Genesis retestShown here is a single fib series in three different time-frames.
The "Genesis Sequence" has called every major turn since 2015.
Clear reactions at each fib confirms our faith in the "Golden Ratio"
Topped at the 111.66k fib, and orbitted the 105k fib for a bit.
Now approaching a critical fib at 97.8k that bulls must fight for.
If it does not hold then we look to the Golden Genesis at 85.3k
$ 97,769.44 is the exact location of next fib.
$ 85,354.35 is the exact location of the Golden fib.
Golden Genesis fibs deserve the respect of a retest.
===================================================================
Previous calls of the Genesis Sequence include these amazingly PRECISE turns:
$111k Top call:
$105k recent Top call:
$73k previous Cylce top:
Hit the FOLLOW and BOOST to encourage more such PRECISE charts.
===========================================================
.

USDJPY Short: 61.8% retracementHi, a simple reason to short: 61.8% retracement. Stop above 144.44.
Thank you.

S&P500 Update: Break of Lower TrendlineIn this video, I updated the wave count for S&P500 and discussed 2 different ways of counting it but ended with a bias on a stronger wave 3 down as opposed to a wave 5 of 1 down.
The stop loss is above 6016, with 2 take profit targets:
1) 5940
2) 5923
Good luck!

BTC Loses Key Level — Will 100K Hold or Fold?Bitcoin has been locked in a range for the past 45 days, clinging above the critical psychological support at $100K. But cracks are starting to show…
Every bounce from the key level at $102,430 has been weakening — and now, for the first time, we’re breaking cleanly below it. Things are starting to tilt bearish.
So the question is…
⛏️ Will 100K be tested next?
🔍 Key Support Zone: $97.7K–$96.9K
Using the Fibonacci retracement from the swing low at $74.5K to the recent ATH, the 0.382 retracement lands at $97,655 — just below the $100K mark.
But there’s more…
Here’s why the zone between $97.7K and $96.9K is crucial:
0.382 Fibonacci retracement: A common pullback level in strong uptrends.
Anchored VWAP from $74.5K: Currently sitting around $96.9K, tracking cumulative volume-weighted average price — a key level.
Daily Order Block: Sits right at $96,887, aligning with the VWAP and reinforcing the area as demand-rich.
1.272 Fibonacci extension: From the previous move — providing another layer of confluence.
Fair Value Gap (FVG): The imbalance lies right in this zone. Price often fills these before continuing trend.
All of this stacks up to a high-probability long setup.
🕵️♂️ What to Do Now?
Set alerts at $100K and watch for a reaction. If price slices through, shift focus to the 0.382 Fib — monitor price action closely for signs of a reversal.
The first clean test of this zone could present a solid long — but as usual don’t trade blindly. Wait for confirmation.
_________________________________
💬 If you found this helpful, drop a like and comment!
Want breakdowns of other charts? Leave your requests below.

ONDO — Reversal or more Pain ahead? After a strong rally back in 2024, ONDO topped at $2.15 — completing a clear 5-wave impulsive move. Since then, price has entered a prolonged downtrend, dropping over -70%, with no confirmed reversal signs yet.
We’re now trading around a critical zone near $0.70. So the question is: where’s the next potential bottom?
🔎 Technical Breakdown:
📍 VWAP Breakdown:
The yellow anchored VWAP (Volume Weighted Average Price) has been lost — a clear sign of market weakness. This VWAP was previously acting as support but has now flipped to resistance, which often precedes continued downside.
📌 Key Support Zone:
$0.80–$0.70 was a structural support area that has now been broken — another bearish sign.
📉 Fibonacci Confluence:
Taking the structure and applying a Fibonacci retracement, the 0.786 retracement lies at $0.4828 — let’s round that to a critical $0.50 zone. This level is important for several reasons:
Liquidity rests at a previous key low at $0.50128
Anchored VWAP Band (0.618 multiplier) aligns with the same area
The 8/1 Gann Fan also intersects around this zone
All roads lead to the $0.50 level as a potential high-probability reversal zone. A bounce from here — especially with volume confirmation or reversal candlesticks etc. — would be a signal worth watching.
💡 Educational Insight: Importance of 0.786–0.886 Fibonacci Zone + VWAP
While many focus on the 0.618 retracement, bear markets often go deeper.
The 0.786–0.886 zone is where emotional exhaustion kicks in — traders give up, liquidity pools build, and smart money steps in.
Combining this with Anchored VWAP adds precision:
VWAP reflects where the “average buyer” is positioned. When price reaches confluence with both deep fibs and VWAP fib bands, you have a statistically powerful setup for reversals.
🚨 Note: These zones are not automatic buy levels — watch for confirmation signs before entering.
🛎️ Set your alerts, stay patient, and as always let the trade come to you.
_________________________________
💬 If you found this helpful, drop a like and comment!
Want breakdowns of other charts? Leave your requests below.

USDJPY: Ready for Wave 5?USDJPY is showing a strong bullish wave structure, with a clear path toward higher levels based on Elliott Wave Theory. After a successful breakout from a multi-year consolidation, price action appears to be completing a Wave (4) correction thereby setting the stage for a Wave (5) rally.
Based on the bullish structure and projected continuation:
1st Target = 157.78
2nd Target = 177.41
Final Target = 209.16 Full wave extension, top of macro channel
With support holding above ¥140.00 and a bullish bounce forming, this could mark the Wave C bottom of (4), setting the stage for the next major leg up.
Disclaimer:
This analysis is for informational and educational purposes only and does not constitute financial advice. Markets are dynamic and unpredictable.

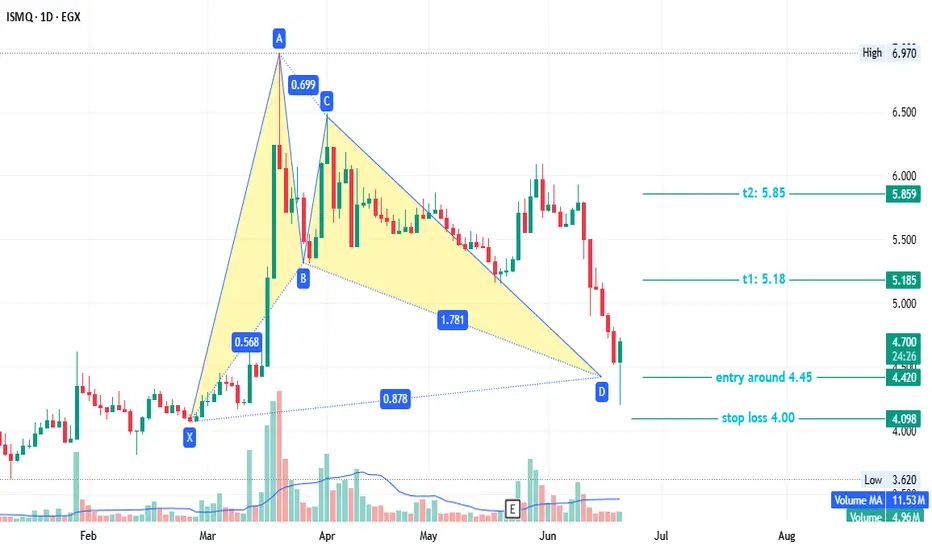
ISMQ - interested EGX:ISMQ timeframe 1 day
Created Bullish Gartley pattern, so we can see action price in this point .
Entry level around 4.45
Stop loss 4.00
First target at 5.18
Second target 5.85
NOTE : this data according to timeframe 1 day.
Its not an advice for investing only my vision according to the data on chart
Please consult your account manager before investing
Thanks and good luck
KAITO Waiting For ExtremesBINANCE:KAITOUSDT The bounce from $1.50 didn’t deliver the upside follow-through — now price is heading toward the equal legs zone at $0.97–$0.77.
As long as the April low holds, this area could attract buyers for another attempt higher. But if it breaks, we may be looking at a deeper correction.

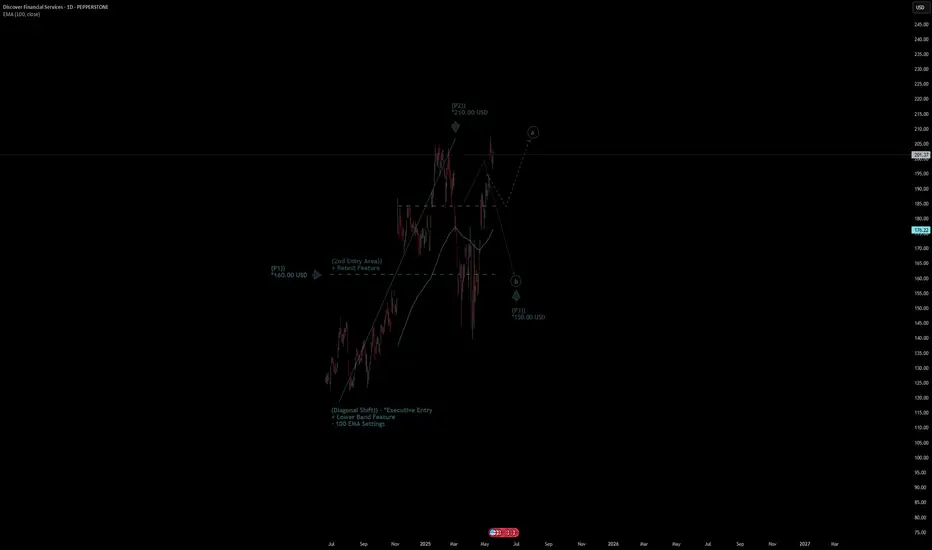
Discover Financial Serv. Stock Quote | Chart & Forecast SummaryKey Indicators On Trade Set Up In General
1. Push Set Up
2. Range Set Up
3. Break & Retest Set Up
Notes On Session
# Discover Financial Services Stock Quote
- Double Formation
* (Diagonal Shift)) - *Executive Entry | Completed Survey
* (2nd Entry Area)) + Retest Feature | Subdivision 1
- Triple Formation
* (P1)) / (P2)) & (P3)) | Subdivision 2
* (TP1) = a / Long Consecutive Range
* (TP2) = b / Short Consecutive Pullback | Subdivision 3
* Daily Time Frame | Trend Settings Condition
- (Hypothesis On Entry Bias)) | Regular Settings
- Position On A 1.5RR
* Stop Loss At 185.00 USD
* Entry At 200.00 USD
* Take Profit At 225.00 USD
* (Uptrend Argument)) & No Pattern Confirmation
* Ongoing Entry & (Neutral Area))
Active Sessions On Relevant Range & Elemented Probabilities;
European-Session(Upwards) - East Coast-Session(Downwards) - Asian-Session(Ranging)
Conclusion | Trade Plan Execution & Risk Management On Demand;
Overall Consensus | Buy
COOKIE Failed to Hold $0.20 ! What's Next ?BYBIT:COOKIEUSDT bounce attempt fizzled, and price broke lower below $0.2 — now heading toward the $0.14 support zone, with Fibonacci extension at $0.10 in sight.
Will bulls defend the April low and spark a fresh rally from here? Eyes on the reaction.

Bittensor Step-by-Step Process🧠 BINANCE:TAOUSD has entered the #BlueBox buying area at $302–$214, where the bottoming process is expected to begin. This zone aligns with the typical equal legs fib cluster setup is a high-probability region for bulls to step in.
Now it’s all about strategy:
🔹 Aggressive bulls might start scaling in here
🔹 Conservative traders may wait for reversal confirmation — like a break of internal trendlines or bullish divergence on lower timeframes
Either way, the groundwork for the next rally could be forming.

Solana Next Buying Zone on WatchCRYPTO:SOLUSD is correcting the 5 waves advance from April low within a 3 waves ZigZag structure and as price slipped to a new marginal low beneath last week’s support, signaling potential weakness toward equal legs area$122 - $111 before buyers look to step in again.
Keeping an eye on reactions in this zone—could set up for a bullish reversal once demand kicks in!

FARTCOIN Loading The BeansCRYPTO:FARTCOINUSD after the initial bounce failed, the correction against the March low is still unfolding within a 3-swing Zigzag, targeting the equal legs zone at $0.75–$0.57 — where bulls are expected to step in for the next blast higher.
Load the beans!! Time to fart!! 💨

VADER Enters Buying AreaDon’t Sleep on MEXC:VADERUSDT
It's currently in the process of doing a 3 waves pullback to correct the previous cycle and it reached the $0.044–$0.032 equal legs zone.
A bullish reaction could kick in next week — eyes open, structure’s still in play.
