American Airlines Stock Chart Fibonacci Analysis 061625Trading Idea
1) Find a FIBO slingshot
2) Check FIBO 61.80% level
3) Entry Point > 10.6/61.80%
Chart time frame:B
A) 15 min(1W-3M)
B) 1 hr(3M-6M)
C) 4 hr(6M-1year)
D) 1 day(1-3years)
Stock progress:A
A) Keep rising over 61.80% resistance
B) 61.80% resistance
C) 61.80% support
D) Hit the bottom
E) Hit the top
Stocks rise as they rise from support and fall from resistance. Our goal is to find a low support point and enter. It can be referred to as buying at the pullback point. The pullback point can be found with a Fibonacci extension of 61.80%. This is a step to find entry level. 1) Find a triangle (Fibonacci Speed Fan Line) that connects the high (resistance) and low (support) points of the stock in progress, where it is continuously expressed as a Slingshot, 2) and create a Fibonacci extension level for the first rising wave from the start point of slingshot pattern.
When the current price goes over 61.80% level , that can be a good entry point, especially if the SMA 100 and 200 curves are gathered together at 61.80%, it is a very good entry point.
As a great help, tradingview provides these Fibonacci speed fan lines and extension levels with ease. So if you use the Fibonacci fan line, the extension level, and the SMA 100/200 curve well, you can find an entry point for the stock market. At least you have to enter at this low point to avoid trading failure, and if you are skilled at entering this low point, with fibonacci6180 technique, your reading skill to chart will be greatly improved.
If you want to do day trading, please set the time frame to 5 minutes or 15 minutes, and you will see many of the low point of rising stocks.
If want to prefer long term range trading, you can set the time frame to 1 hr or 1 day.
Fibonacci

Ethereum Wave Analysis – 16 June 2025
- Ethereum moving inside sideways price range
- Likely to rise to the resistance level 2754.00
Ethereum cryptocurrency recently reversed up from the support zone between the support level 2435,00 (lower border of the active narrow sideways price range from May), lower daily Bollinger Band and the 38.2% Fibonacci correction of the upward impulse from May.
The upward reversal from this support zone continues the active minor impulse wave 3 of the intermediate impulse wave (3) from last month.
Ethereum can be expected to rise to the next resistance level 2754.00 (upper border of the active sideways price range).

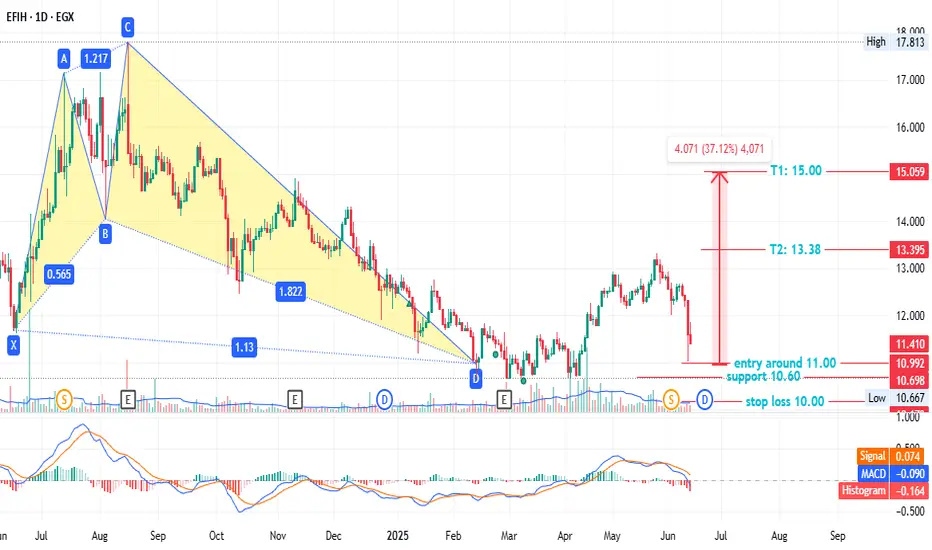
EFIH - anther chance - low risk EGX:EFIH - 1-Day Timeframe
A bullish pattern emerged on Feb 13, but prices adjusted after the 3/2 stock split on Jun 02. Key levels:
- Entry: ~11.00
- Stop loss: 10.00 (7.00% loss)
- Support: 10.60 (6-month low)
- Targets:
- T1: 13.38 (22.24% profit)
- T2: 15.00 (37.12% profit)
This is not investment advice—only my analysis based on chart data. Consult your account manager before investing. Good luck!
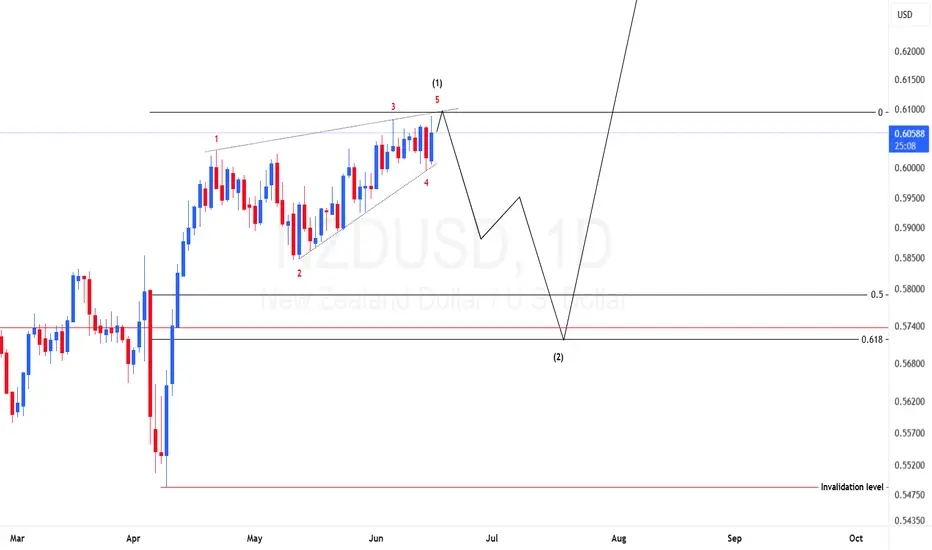
NZDUSD Elliotwaves CountPrice have unfolded the leading diagonal structure and we have seen signs of bullish weakness. If we are correct we should expect price to drop to at least the golden zone before resuming the bullish momentum.
XAUUSD Elliotwaves update: Is wave 4 complete?On our previous view we were expecting a wave c to the upside that will complete wave B of higher degree. It looks like wave B is completed with an ending diagonal. Now what I am anticipating is price to drop to complete wave 4 in higher degree. However, if wave 4 is complete then the move up might be a leading diagonal for wave 1 of 5. But all in all the the current bias is to the downside and therefore to take advantage of the move to the downside one should find areas where price will find resistance for a possible sell opportunity.

LUTS - out of box ( T1 10% VS SL 2% )EGX:LUTS timeframe 1 day
Created Bullish Gartley pattern, so we may see action price in this point.
Entry level around 0.573 ( prices now at 0.557 )
Stop loss 0.54 ( estimated loss 5.55% )
First target at 0.629 ( estimated profit 10.00% )
Second target 0.702 ( estimated profit 22.50% )
Third target 0.754 ( estimated profit 31.55% )
NOTE : this data according to timeframe 1 day.
Also MACD show positive diversion that may support our idea.
Its not an advice for investing only my vision according to the data on chart
Please consult your account manager before investing
Thanks and good luck

GOLD → Hunting for liquidity before continued growthFX:XAUUSD has been correcting since the start of the session. The fundamental background is complicated due to the escalation of the conflict in the Middle East.
The price of gold briefly retreated from a two-month high above $3,450 amid a recovery in the dollar and investor caution. Escalating tensions between Israel and Iran are dampening risk appetite, while markets await decisions from the Fed and the Bank of Japan. Expectations of a dovish Fed continue to support interest in gold, but fresh impetus is needed for further gains.
Technically, the market is bullish. Gold is forming a correction to the key support and liquidity zone amid an uptrend. The price is within the range, and a retest of 3400 could trigger growth.
Support levels: 3408, 3400
Resistance levels: 3446, 3500
A retest of support and liquidity capture amid the current challenging situation (high interest in the metal) and a bullish trend could support the price, allowing gold to continue its growth.
Best regards, R. Linda!

BITCOIN → Buyback bar. Chance of growth to 108,000BINANCE:BTCUSDT is trading in a fairly wide range of 100,600 - 110,400. The market is stagnating due to fundamental uncertainty, but the risks of a decline are quite high...
After the escalation of the conflict in the Middle East, Bitcoin broke the bullish structure on the market and managed to test the local level of 102500, from where a fairly aggressive phase of buying out the fall began within one trading session. The market is defending the structure quite aggressively. The chart shows a local range forming with strong levels at 102500 and 106200. Accordingly, the price may remain in this range for a long time (in which case an intraday trading strategy can be considered). However, if Bitcoin starts to stick to one of the boundaries, then we can consider the price leaving the range, but based on the structure of the uptrend, correction, and the formation of a buyback bar, it would be logical to see an attempt to break through resistance with the aim of continuing growth.
Resistance levels: 106200, 108200, 110400
Support levels: 102500, 100600
On D1, there are no prerequisites for a strong decline. The market is buying up knives and trying to stay afloat (in consolidation). In the medium term, there may be an attempt to retest 102500 - 100600 due to the liquidity pool. But locally, the market may form an attempt to grow to 108200
Best regards, R. Linda!

NZDUSD → Correction and liquidity capture ahead of growthFX:NZDUSD , following a sharp decline during the Pacific-Asian session, is testing the support of the upward trend and the liquidity zone...
The dollar is correcting amid escalating tensions in the Middle East. This is a temporary move, and the market may return to its main trend. The currency pair is forming a false breakdown of support
Against the backdrop of an uptrend and a weak dollar, the currency pair is testing support at 0.6000. The reaction is weak at the moment, but there is a chance for growth if the price consolidates above 0.6020. I do not rule out a retest of the liquidity zone at 0.5989 before growth
Support levels: 0.6000, 0.5989
Resistance levels: 0.6068
The inability to continue falling and the formation of a local reversal structure relative to 0.6000 (price consolidation above 0.6020) may support the market. I do not rule out that the market may decline to the liquidity zone of 0.5989 before rising.
Best regards, R. Linda!

NVDA: Fractal Wave BreakdownBreaking above Rounding Top Pattern after rejections.
Wave transformed from pullback to impulsive one, which implies that the emerging structure needs to be routed to relative cycle.
Waveform
Referral structure looks like compressed version of decline after ATH.
As if the movement of big magnitude that pierces through SL levels, causes "shockwaves" that resets frequency of reversals of forthcoming waves.
Fibonacci interconnection of ATH and Bottom

USD/CAD Plunges Towards Initial SupportUSD/CAD broke below key support last week with price attempting to mark a third consecutive weekly loss. A break of multi-year uptrend threatens further losses here with confluent support now within striking distance at 1.3504/23- a region defined by the 1.618% extension of the February decline and the 78.6% retracement of the late-2023 advance. Note that channel support converges on this threshold over the next few weeks- risk for possible exhaustion / price inflection into this zone.
Resistance now back at 1.3720/95 with bearish invalidation steady at 1.3958/77. A break below this pivot zone exposes the 2024 LWC at 1.3360 and the 2023 LWC at 1.3218.
-MB

EURUSD IdeaHere we are waiting for the price to come to our supply zone at 1.16117-1.16344 from where we may enter sell according to the required market structure form .
i will provide the confirmation in thegroup before i place my order .
Please follow to support me !

$ORCL Overextended After Hitting 423.6% Fib ExpansionOracle had a post earnings run up not ever seen before in the Companies history. As of now price has moved up nearly ~$100 since the April 8th lows, and now sit at the 423.6% expansion level off a 78.6% retracement. Time to look for Oracle to come in.

Oil (WTI) – Geo-Political Concerns Drive SentimentA quickly escalating conflict in the Middle East between Israel and Iran has seen Oil (WTI) volatility increase dramatically as the focus for traders has shifted overnight from worries about an on-going lack of demand due to a slowing global economy over to major supply concerns moving forward from this oil rich region.
This shift has seen Oil trade from lows of 60.17 on May 30th, to an early Monday high of 76.31, as weekend attacks by Israel on Iran's energy infrastructure introduced more uncertainty at the start of this new trading week regarding Israel's future strategy in this conflict. Prices have since settled down and moved back towards 72.80 (0830 BST) at time of writing but looking forward traders may need to balance the potential for further escalation/duration of this conflict against extra Oil production/supply from OPEC+ and the US.
Also important for Oil prices across the week could be the outcome of the Federal Reserve (Fed) Interest Rate Decision (Wed 1900 BST) and Press Conference (Wed 1930 BST). No change to interest rates is expected, but the updates from Fed policymakers to their inflation and interest rate expectations for the rest of 2025 could have a major impact on risk sentiment, the dollar and anticipated Oil demand.
Technical Update: Utilising Bollinger Bands
A rise in tensions in the Middle East last week prompted a sharp acceleration higher in the price of Oil. This saw price volatility increase, reflected by the widening upper and lower Bollinger bands and prices trading to levels last seen in late January 2025, as the chart below shows.
Traders will now likely be wondering if this type of price strength can continue, or if prices can enter a correction phase, even possibly a more extended period of price weakness.
Much will clearly depend on future market sentiment and price trends, and on any easing or escalation in geo-political tensions. However, with this in mind let's consider what may be the relevant support and resistance levels .
Potential Resistance Levels:
As the chart shows below, interestingly, last weeks price strength stalled against 75.99, which is equal to the February 3rd session high and with a setback in price developing from it so far today, this might be viewed by some as a potential first resistance.
As such, while not a guarantee of further price strength, closing breaks above 75.99 may be a sign of continued upside momentum towards 81.01, which is the January 15th price high and a potential next resistance focus for traders.
Potential Support Levels:
After such a strong advance in price, it might be harder to establish support levels, although, Fibonacci retracement levels on the recent May 30th to June 16th upside move in price, might prove useful. These retracement levels are highlighted on the chart below.
The 38.2% Fibonacci retracement of the price strength stands at 70.12 and this might prove to be a possible first support focus, if price weakness is seen over coming days. Closing breaks below 70.12, if seen, may then lead to declines towards 66.32, the deeper 61.8% Fibonacci retracement level.
The material provided here has not been prepared
accordance with legal requirements designed to promote the independence of investment research and as such is considered to be a marketing communication. Whilst it is not subject to any prohibition on dealing ahead of the dissemination of investment research, we will not seek to take any advantage before providing it to our clients.
Pepperstone doesn’t represent that the material provided here is accurate, current or complete, and therefore shouldn’t be relied upon as such. The information, whether from a third party or not, isn’t to be considered as a recommendation; or an offer to buy or sell; or the solicitation of an offer to buy or sell any security, financial product or instrument; or to participate in any particular trading strategy. It does not take into account readers’ financial situation or investment objectives. We advise any readers of this content to seek their own advice. Without the approval of Pepperstone, reproduction or redistribution of this information isn’t permitted.

OKLO eyes on $72.37: Golden Genesis fib that should give a DIP OKLO going nuclear into a Golden Genesis fib at $72.37
Looking for a Dip-to-Fib or a Break-n-Retest new longs.
Most likely a few orbits around this ultra-high gravity fib.
.
Last Plot caught break and sister Genesis Fib
.
Older Plot caught the perfect Dip-to-Fib buys:
.
Hit the BOOST and FOLLOW to catch more such EXACT trades.
=======================================================

KAYNES | Buy @LTP | SL below 5000 | Targets 6250, 6835, 7760Disclaimer:
This is not financial advice. Please do your own research or consult with a financial advisor before making any investment decisions. Investments in stocks can be risky and may result in loss of capital.

gold for long 30m*The content on this analysis is subject to change at any time without notice, and is provided for the sole purpose of assisting traders to make independent investment decisions.

btc for long 30m*The content on this analysis is subject to change at any time without notice, and is provided for the sole purpose of assisting traders to make independent investment decisions.

dxy for short 30m*The content on this analysis is subject to change at any time without notice, and is provided for the sole purpose of assisting traders to make independent investment decisions.

EURUSD 4H: Bullish Trend & Key Support TestChart Overview:
The EURUSD 4-hour chart displays a clear bullish bias, trading within a well-defined ascending channel. After making new highs, price is now retracing to test crucial support, presenting a potential trend continuation opportunity.
Trend & Structure:
Since April, EURUSD has maintained a strong uptrend, consistently respecting an ascending channel. An early May correction saw an "internal break," but a subsequent "MSS" (Market Structure Shift) confirmed the bullish trend's resumption, pushing price to a new local high at 1.16321 and above.
Current Price Action & Immediate Support:
Price is currently undergoing a healthy retracement from its recent peak. The primary focus is the "Immediate Support Area" between 1.14416 and 1.14663. This zone is significant due to a confluence of factors:
The 0.5 & 0.618(Golden Ratio) and 0.71 Fibonacci retracement levels of the latest bullish swing.
Prior resistance that has potentially flipped into support. The lower boundary of the overarching ascending channel. Below this, a "Key Level" around 1.1100-1.1150 is identified as a deeper, secondary support.
Potential Scenarios & Outlook:
Bullish Continuation: A strong bounce and confirmation from the "Immediate Support Area" would signal renewed buying pressure. This would likely see price target the recent high (1.16321) and the upper channel boundary, resuming the uptrend.
Bearish Rejection: A decisive break down below the "Immediate Support Area" and the ascending channel's lower boundary would invalidate the immediate bullish setup, potentially leading to a test of the "Key Level."
Conclusion:
EURUSD is at a pivotal point within its ongoing bullish trend. Traders should closely monitor price action at the "Immediate Support Area." A successful hold and rebound here would reinforce the bullish outlook, while a clear break below would warrant caution and re-evaluation.
Disclaimer:
The information provided in this chart is for educational and informational purposes only and should not be considered as investment advice. Trading and investing involve substantial risk and are not suitable for every investor. You should carefully consider your financial situation and consult with a financial advisor before making any investment decisions. The creator of this chart does not guarantee any specific outcome or profit and is not responsible for any losses incurred as a result of using this information. Past performance is not indicative of future results. Use this information at your own risk. This chart has been created for my own improvement in Trading and Investment Analysis. Please do your own analysis before any investments.

Beyond the News: Why I Trust the Charts When Trading GoldBased on the current structure, I believe gold is in the fifth wave of a larger Elliott Wave formation. On the higher time frame, the price action appears to be contained within a channel that resembles a leading diagonal pattern—where Wave 1 is typically the longest. From this perspective, I anticipate a potential retracement to the 0.618 Fibonacci level of the most recent upward move, or a test of the lower boundary of the channel before a reversal may occur.
My trading plan involves two potential entry strategies:
Enter at the 0.618 Fib retracement with a stop-loss set near the 0.881 level.
Wait for a bounce off the lower channel, followed by a pullback and a breakout above the start of the pullback before entering the position.
While no trader can be right all the time, having a structured plan with predefined take-profit and stop-loss levels is key to effective risk management and long-term survival in the markets.
Why I Favor Technical Over Fundamental Analysis
For those wondering why I rely more on technical analysis—especially Elliott Wave Theory—over fundamental news, here’s my reasoning:
I’ve found that news and earnings-based trades often behave irrationally. A company may report strong earnings and guidance, only to see its stock sell off, fake a rally the next day, and then sell off again. Conversely, a company with poor earnings may drop ahead of the report, only to rally immediately after. These inconsistencies made it difficult to build a reliable strategy based solely on fundamental data.
Over time, I observed that despite news events, the market often completes its technical structure—such as Elliott Wave formations and Fibonacci cycles—before fully reacting to news. In these cases, fundamental developments tend to accelerate or confirm the direction already implied by the technical setup, rather than override it.
Gold is no exception. While it's common to assume that the S&P 500 (ES) and gold move in opposite directions due to risk-on/risk-off dynamics, I’ve noticed that they can trend in the same direction when their respective Elliott Wave structures align. This doesn't eliminate the inverse correlation concept entirely, but it highlights the importance of integrating technical analysis into a fundamentally driven view for more precise entries and exits.
Ultimately, I view fundamentals as the fuel, and technicals as the engine that defines the path.

GOLD UPDATE .......Hello Traders, here is the full analysis for this pair,
let me know in the comment section below if you have any questions,
the entry will be taken only if all rules of the strategies will be
satisfied. I suggest you keep this pair on your watch list and see if
the rules of your strategy are satisfied.
Dear Traders,
If you like this idea, do not forget to support it with a like and follow.
PLZ! LIKE COMMAND AND SUBSCRIBE

USDCHF → Retesting resistance will lead to a declineFX:USDCHF , having failed to reach its global target after breaking through support, is turning back to retest the zone of interest at 0.8157. A fall in the dollar could trigger a decline in prices...
After breaking through support and falling to 0.8055, a correction is forming towards the zone of interest and liquidity at 0.8157. After reaching the local target, the price may return to the global target (liquidity zone) at 0.8042.
The dollar returned to its downward phase at the opening of the session, to which the forex market reacted accordingly. Most likely, bearish pressure may also affect the USDCHF currency pair, which continues to follow the downward trend.
Resistance levels: 0.8157
Support levels: 0.8055, 0.8042
A retest of resistance amid high volatility could form a false breakout (liquidity capture) before the decline continues within the downtrend.
Best regards, R. Linda!
