ADA | Trade Setup📌 After the reaction from the bearish target zones (blue), we've now activated a bullish sequence (yellow) in $ADA.
📊 Valid entries are currently forming during a potential B-C correction.
Trademanagement:
I'm placing long orders at each level.
Once the trade reaches a 2 R/R, I’ll move the stop-loss to break-even.
From a 3 R/R onward, I’ll start locking in profits.
Once I’ve locked in my first profits, I’ll share the next profit targets with you.
Fibonacci

Bitcoin |Market updateWe just broke through the bull flag after a 3-wave correction from the last impulsive move.
📊Macro picture:
With the break of the high at 109k, we were able to invalidate the bearish scenario (marked in yellow). We've also almost broken the high at 110k, above which there's still massive short liquidity
I expect Bitcoin to break its all-time high within the next 11 days due to the global liquidity, which we are still continuously following.
I'm not going short or long on #BTC right now, as I don't see any valid setups at the moment.
💡 But it's a different story with altcoins -> Check out my other recent posts

TESLA // Fibonacci numbers are used in the chart. The movement of prices within the channel should be monitored.

AAPL // I used Fibonacci numbers. 144 is our ema support point. Let's look for closings above the green line for the trend.

EURGBP - Expecting Bullish Continuation In The Short TermH4 - We have a clean bullish trend with the price creating a series of higher highs, higher lows structure.
This strong bullish momentum is followed by a pullback.
No opposite signs.
Until the two Fibonacci support zones hold I expect the price to move higher further.
If you enjoy this idea, don’t forget to LIKE 👍, FOLLOW ✅, SHARE 🙌, and COMMENT ✍! Drop your thoughts and charts below to keep the discussion going. Your support helps keep this content free and reach more people! 🚀
--------------------------------------------------------------------------------------------------------------------

Oil (WTI) – Preparing for Potential Fresh VolatilityThe price of Oil (WTI) fell dramatically last week, from a high of 78.88 on Monday June 23rd to a low of 65.21 on Tuesday June 24th, as a ceasefire was first agreed and then held between Israel and Iran. This shifted the focus for traders back to US trade talks and looming tariffs, the direction of US economic growth and the potential for another OPEC+ production increase. Although, it must be said that nervousness about the sustainability of the ceasefire is still drawing the focus of traders this week and may continue to do so.
In terms of trade, Oil prices jumped higher yesterday as a trade deal between the US and Vietnam was announced, but the question remains, could this rally be short lived?
President Trump stated on Tuesday that he doesn’t expect to delay his July 9th tariff deadline, which could see higher import penalties reimposed on key trading partners, such as Japan and the EU. While it seems that traders may still be unsure whether he really means this, any potential impact on Oil prices could increase the closer we move to the deadline.
Today’s data releases could provide some key insights into the health of the US economy, with Non-farm payrolls released at 1330 BST and the US ISM Services PMI due at 1500 BST. Traders expect jobs growth to continue to moderate, so any bigger downside surprises could increase Oil price volatility, and the direction of service activity (bars, restaurants etc), the main driver of US growth for many months, may also be crucial for sentiment. Traders may be watching for whether there has been any major deterioration in this services PMI reading, back towards, or below 50, which is the dividing line between economic contraction and expansion.
Then, Sunday’s (July 6th) OPEC+ meeting, where the group is expected to agree to an August supply increase for a fourth month in a row, moves into focus. Depending on this OPEC+ decision and any tariff or geo-political developments over the weekend, Oil prices could potentially open up at very different levels on Monday morning.
Technical Update: Breaking Higher From Range?
Following the aggressive sell-off in the price of Oil from the 78.88 June 22nd high into the 65.21 June 24th low, a period of stability materialised as traders assessed the developing geo-political backdrop.
This saw price activity held by support offered by the 65.21 price low and resistance by the 67.54 June 26th high. However, as the 4 hourly chart above shows, the latest activity has now seen prices move out of this range, with a closing break above the previous 67.54 high.
While a break higher from such a sideways range in price is not a guarantee of continued upside, traders may now be viewing this type of activity as reflecting potential for a more extended phase of price strength.
Next Possible Resistance Levels.
If further price strength is to emerge, it might now suggest possibilities to test the 70.48 level, which is equal to the 38.2% Fibonacci retracement of the June 22nd to June 24th decline.
Closing breaks above this resistance may then lead to further attempts at price strength towards 72.08, which is the higher 50% retracement level.
Next Possible Support Levels
While some traders might view a move back into the old sideways price range, which would be represented by closes back under the 67.54 recent high, as marking the possibility of increasing downside pressure again, it might in fact be breaks under the 66.98 level, which is equal to half latest strength, that indicates the potential of further price declines.
Such downside closing breaks may well suggest potential to retest the 65.21 June 24th low trade, possibly further if this in turn gives way.
The material provided here has not been prepared accordance with legal requirements designed to promote the independence of investment research and as such is considered to be a marketing communication. Whilst it is not subject to any prohibition on dealing ahead of the dissemination of investment research, we will not seek to take any advantage before providing it to our clients.
Pepperstone doesn’t represent that the material provided here is accurate, current or complete, and therefore shouldn’t be relied upon as such. The information, whether from a third party or not, isn’t to be considered as a recommendation; or an offer to buy or sell; or the solicitation of an offer to buy or sell any security, financial product or instrument; or to participate in any particular trading strategy. It does not take into account readers’ financial situation or investment objectives. We advise any readers of this content to seek their own advice. Without the approval of Pepperstone, reproduction or redistribution of this information isn’t permitted.

GOLD → Attempt to consolidate above 3350 for growth to 3400FX:XAUUSD , after retesting resistance at 3347, is breaking through the key level, while bulls are trying to hold their ground above support. There is potential for growth to 3400.
Gold retreated from its weekly high of $3366 ahead of key US employment data (NFP), which could set a new direction for the movement. But technically, this looks like a correction to consolidate above the level before continuing to rise. After three days of growth, the price faced selling amid a recovery in the dollar and profit-taking. Weak employment data (especially below 100,000) could reinforce expectations of a Fed rate cut as early as July and support gold. Conversely, a strong report will strengthen the dollar and put pressure on the metal. The market is bracing for high volatility
Resistance levels: 3363, 3393, 3400
Support levels: 3347, 3336, 3311
The price has entered a new range of 3345-3400. Consolidation is forming above the support level before a possible rise. I do not rule out another retest of 3345-3336 (liquidity zone) before realization and a rally to 3400.
Best regards, R. Linda!

AMD: Wave DimensionsProjection via Historic Wave Dimensions
Fractal Wave Marker with settings: core period of 60 and 1 Phi Scaling on1h TF AMD chart
From point of 3rd degree wave's reference:
If resistance curve is violated:
Mapping a cycle:

Gold & $3400Gold is under the resistance at $3400 for a long time, and if can not break that then downside movement will come.

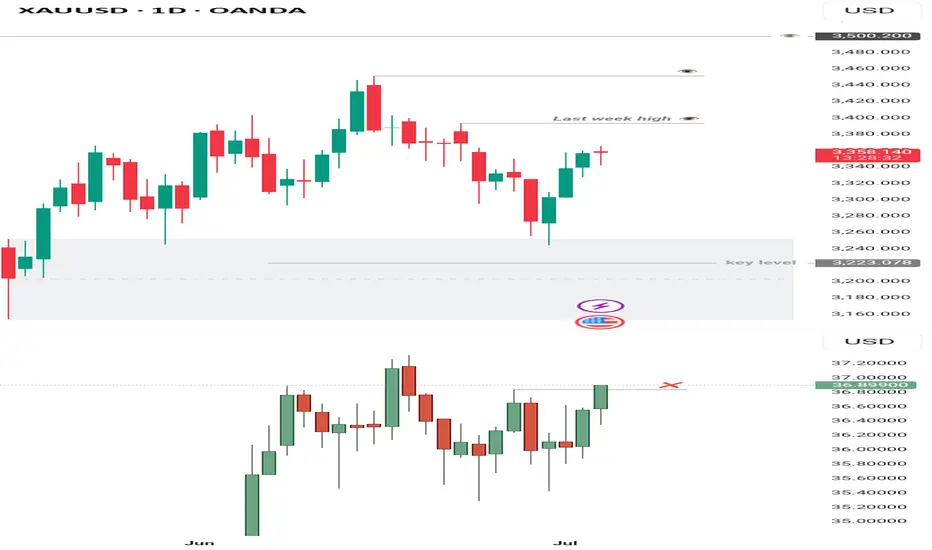
Gold Analysis – Daily Outlook
I initially anticipated a deeper move toward 3225 — the 25–30% retracement zone of the discount array — but price bounced quickly during Monday’s open, then confirmed a market structure shift by breaking above 3350. However, the buy signal wasn’t convincing at the time, as Silver lagged and leaned bearish.
Following the latest 4H chart, Silver has now invalidated the short idea by trading above 36.83, which offers stronger confirmation for the bullish bias — far clearer than what was seen on Monday.
Retracement might occur around last week’s high at 3394, offering a possible discount re-entry point before further upside. Still, price could head straight toward ATH, so keeping 3394 in view remains wise.
BTC Breakdown Escalates Bearish MomentumBitcoin has officially broken below the critical 104K support level, invalidating the recent short-term bullish structure. The price action reflects a clear shift in market sentiment, confirmed by the bearish EMA/SMA crossover and a firm rejection from the strong supply zone between 110K–111.8K.
This rejection formed a clean lower high around 110K, followed by a decisive drop below the weak supply area and failure to hold 104K a key level previously acting as a demand floor. The current structure now favors downside continuation, with the 98K zone as immediate focus.
If bearish momentum persists, attention will shift toward the Weak Potential Reversal Zone and eventually the Recommended Buy Back Zone around the 84K–86K area. This zone aligns with a historical support range and may offer high-probability entries for medium-term accumulation.
Until price reclaims the 104K–105.5K region, rallies are likely to be sold off within the supply zones. Short-term traders may look to trade the breakdown toward the highlighted support levels, while long-term investors should monitor price reaction within the buyback region.

XRPUSDT → Resistance retest. Coin inside the flatBINANCE:XRPUSDT is rising towards resistance at 2.3288 due to a shift in the fundamental background to positive and a rally in Bitcoin, but there is always a but...
On the daily chart, XRP is trading below strong trend resistance, and there is also a fairly strong and voluminous liquidity pool at 2.3300 ahead, which could provide strong resistance. Bitcoin is also approaching its critical level of 110500, which may temporarily hold back growth, and a correction in the flagship could trigger a correction in the rest of the market...
Focus on resistance and the liquidity pool at 2.3288. A sharp approach and capture of liquidity without the possibility of continuing growth could lead to a correction by half or the entire local range (to 2.16).
Resistance levels: 2.3288, 2.357, 2.45
Support levels: 2.25, 2.213, 2.16
If the retest of resistance at 2.3288 ends in a false breakout, then subsequent consolidation below the level could trigger a correction to the above support and interest zones.
Best regards, R. Linda!

AUDCHF AUDCHF is preparing to break through support and fallWeak market structure. Gradually declining lows and no reaction to support at 0.5211. Buyers are trying to keep the price above 0.5211, but under market pressure their strength is weakening.
Relative to 0.5211, we see the formation of consolidation, which is of a “pre-breakdown” nature.
Accordingly, a break below the 0.5211 support level could trigger the activation of buyers' SL orders, leading to liquidation and a downward price distribution.
Potential targets include 0.518 and 0.5164.

GOLD → Retesting resistance may lead to a breakout.FX:XAUUSD breaks the downward resistance line on the senior timeframe and tests the upper limit of the trading range amid the falling dollar and Powell's speech. The metal may continue its upward movement.
The dollar's rise was short-lived after Fed Chairman Jerome Powell hinted at an imminent interest rate cut, but not in July... The probability of a rate cut in July fell to 22%, and in September to 72%.
Markets are awaiting fresh employment data (ADP and Nonfarm Payrolls), which could influence the prospects for rate cuts. Weak reports could revive interest in gold, but for now, the asset remains under pressure due to the short-term strengthening of the dollar and uncertainty surrounding Fed policy.
Technically, if the pre-breakout structure remains intact and gold continues to attack resistance within the local range of 3347-3330 (3335), the chances of further growth will be high...
Resistance levels: 3347, 3358
Support levels: 3336, 3316, 3311
The global trend is upward, and locally, the price is also returning to growth. If the bulls can maintain the current trend, break through the resistance at 3347, and hold their ground above this level, then the next target will be 3390-3400. I do not rule out a correction to 3325, 3316 (liquidity hunt) before the growth continues.
Best regards, R. Linda!

PNB: Weekly Rounding Bottom Breakout! 🚀 PNB: Weekly Rounding Bottom Breakout! 🚀
📉 CMP: ₹111.16
🔒 Stop Loss: ₹99
🎯 Targets: ₹117 | ₹126 | ₹133
🔍 Why PNB Looks Strong?
✅ Technical Breakout: Rounding bottom breakout confirmed on weekly charts
✅ Retest Support: Successful retest at 40 EMA, strengthening bullish bias
✅ Sector Boost: With rate cuts supporting banking, PNB as a laggard may catch up with upside momentum, especially with improving results
💡 Strategy & Risk Management:
📈 Staggered Entry: Ideal to accumulate in phases
🔒 Strict SL: Maintain stop loss at ₹99 to manage downside risk
📍 Outlook: Strong technical setup + sector tailwind = promising swing and positional trade opportunity.
📉 Disclaimer: Not SEBI-registered. Please do your own research or consult a financial advisor before investing.
#PNB #BankingStocks #BreakoutTrading #TechnicalAnalysis #SwingTrading #StockMarketIndia #InvestmentOpportunities

AUDUSD → Pre-breakout consolidation for trend continuationFX:AUDUSD may continue its upward trend. After another local distribution, the currency pair is consolidating and may repeat the cycle
The dollar index continues to fall, the global trend is clear, and the price is testing multi-year lows. After yesterday's speech by Powell, the decline may intensify amid expectations of a rate cut, which will only support AUDUSD.
AUDUSD is moving within an uptrend, stopping below resistance at 0.6583, but is not going to fall.
There was a false breakout (the zone was tested), the structure is not broken, and the price continues to squeeze towards resistance, which could lead to a breakout and growth
Resistance levels: 0.6583
Support levels: 0.6566, 0.6556
There is potential accumulation in the market, and the market is choosing growth against the backdrop of a falling dollar as its direction. Accordingly, the currency pair is one step away from a possible realization phase. Thus, if the price breaks 0.6583 and consolidates above this zone, it may continue to grow in the short and medium term.
Best regards, R. Linda!

BTC with potential for $115,000/$120,000🔍 Market structure (Price Action)
📈 Trend:
The market previously formed higher highs (HH) and higher lows (HL) – a classic uptrend.
Then there was a correction and a lower high (LH) and lower low (LL) appeared – a potential change in the trend to a downtrend.
The last two lows are again HL (Higher Lows) – suggesting an attempt to return to the uptrend.
🔄 Key support and resistance levels
✅ Resistance (green horizontal lines):
117.469 – local resistance and potential breakout target from the current range.
115.802 – confirmed resistance from previous consolidations.
111.814 – strong local resistance (LH – Lower High formed there).
109.341 – current resistance, the price is currently testing it.
🛑 Support (red horizontal lines):
105.370 – local support, price reacted at this level in recent days.
102.650 – important support, level of previous HL.
100.095 – consolidation level before breaking out upwards.
98.213 – last LL – very important level in the context of defending the structure.
🧭 Structure of peaks and troughs
HH: Higher High – confirmed the previous uptrend.
LH: Lower High – first warning about changing the structure to down.
LL: Lower Low – confirmed a potential change to downside.
HL (x2): two more higher lows – suggest a possible return to growth.
📊 Stochastic RSI (at the bottom of the chart)
The oscillator is currently in the overbought zone (>80), approaching a downward crossover.
It suggests a possible short-term halt in growth or correction.
But in strong trends it may "stick" to the upper range.
📌 Potential scenarios:
🟢 Bullish:
If the price breaks above 109.341, it may test 111.814 and then 115.802.
Continuation of the HL → HH formation will confirm a trend reversal and further growth.
🔴 Bearish:
If the price does not stay above 109k and breaks below 105.370, there is a risk of a test of 102.650 and lower.
A break of 100.095 and especially 98.213 will negate the growth structure.
🧠 Conclusions:
The market is at a key decision point - HL formation vs. resistance zone.
Buyers' strength will be confirmed only after breaking 111-112k.
Stochastic RSI warns of potential pullback or consolidation.

$10 is looking realistic... if Mr. T doesn't mess it up lolWe have a lot of $10 call options on every expiration date for the next few months, meaning this move might take a while to play out. Unsure of exact date if its earnings call or news but $10 seems to be where the focus is.
If tariffs begin or effect Brazil negatively then this stock could plunge on low growth anticipation.
Watch very very closely on how price reacts to $9 IF we even go down there.

I have shorted gold as expected and held on patientlyEven under the influence of the ADP data, which is bullish for the gold market, gold has not effectively broken through 3350, and even showed signs of falling back after rising several times. The resistance above is becoming more and more obvious, which may further weaken the market's bullish sentiment and confidence, thereby strengthening the dominance of the bears.
Although gold has not effectively fallen yet, from the perspective of the gold structure, even if gold wants to rise, it still needs to be backtested and support confirmed before rising, and the current retracement is far from enough, so gold still has a need for structural retracement; and before the NFP market, gold rose slowly but was far from enough to break upward, and there was no volume support, so the illusion of gold rising may be to lure and capture more bulls;
Therefore, out of caution, I try to avoid chasing gold at high levels; and I believe that shorting gold is still the first choice for short-term trading at present. And I have executed short trades in the 3340-3350 area according to the trading plan, and held it patiently. I hope that gold can retreat to the 3320-3310-3300 area as expected.

HINO LongHino broke its downward channel line in November 24. It posted a high of 545 in Jan 25 and came back to retest the level which broke the downward channel (~300).
Now it is exactly at its Fib 0.236 level, crossing which, it will pace up and move towards its next levels.
Next levels are: 545, 589, 721 and 853 in short to medium term.
Long terms target can be its all-time high level of 1274.
Its not a buy / sell call, just my personal opinion.
Daily, weekly and Monthly RSI are all at or around 60 that show positive momentum.
Moreover, the increasing volumes since it broke downward channel showing active players ;)
One thing to note that its free float is very low, that will cause its very fast move upward (whenever it may be)

Analysis on circle using tpo and regular chart longs and shortMust watch video giving 2 really nice Risk reward entries on the Newley listed stock Circle
In this video I highlight a region using limited data of where to get filled if you missed the IPO and want to buy some circle .
We are currently in a no trade zone for buyers as I anticipate that price will gravitate down to the .786/.886 level over time .
In this video I also use the TPO chart "Time price opportunity" and demonstrate what i am looking for from using this type of chart to add to my confluences for a high probability trade .
Also identified in the chart is a short trade off of the weekly pivots and the value area high of the range .
Thankyou for watching and i welcome any questions

AERO Long Swing Setup – Strong Pullback into Fibonacci SupportAERO has shown notable strength in recent months and is now retracing into a key support zone, aligning with the 38.2% Fibonacci level. The $0.75–$0.80 area offers a solid long swing opportunity.
📌 Trade Setup:
• Entry Zone: $0.75 – $0.80
• Take Profit Targets:
o 🥇 $1.04 – $1.32
o 🥈 $1.60 – $2.05
• Stop Loss: Daily close below $0.70

How much higher for Platinum futures In this video I look at the current price of platinum on a higher tf and forecast where I believe the cool down to this rally might begin.
Using tools like the fib extension, volume profile and speed fan we are able to highlight a major reaction zone ahead at $1600 region .
Set alerts at these key levels for what might prove to be a solid short entry or a rejection , retest and claim for higher levels like the 1.618 ext .
