Its shopping time broToday is Blessed-Friday-sell on BTC. Buy it or miss it.
Now I do not want to listen,
"Oh, Abdul, we missed it. Next time, I will follow you for sure."
:)
Fibonacci

SUI — Trading with Geometry: Why Harmonics Work So WellSUI has been respecting technical levels with remarkable consistency. After bouncing from the $2.8467 low, it surged sharply — completing a clean Cypher Harmonic Pattern. This led to a high-probability short setup at the 0.786 Fibonacci retracement (Point D) around $3.5573.
🎯 Trade Setup Breakdown
Pattern: Cypher Harmonic
Entry (Point D): $3.5573 (0.786 retracement of XC)
Target: $3.1191 (0.618 retracement of CD)
Stop-Loss: Above Point X
The 0.618 fib retracement of the CD leg coincides with a significant key low from May 6, 2025, adding structural confluence. This is an ideal level to monitor for absorption, reaction, or potential reversal behaviour.
🧠 Educational Insight: How to Trade Harmonic Patterns Like a Pro
Harmonic patterns aren't just visually appealing — they represent high-probability setups based on market structure, Fibonacci geometry, and behavioural cycles. The most critical part of every harmonic pattern?
You enter at Point D.
Whether the pattern is bullish or bearish, Point D is your trigger:
In bearish patterns (like this Cypher), you short from Point D.
In bullish patterns, you long from Point D.
This works because Point D marks the exhaustion of the corrective leg, where trapped traders and liquidity often sit. The structure often aligns with supply or demand zones, order blocks, or FVGs (Fair Value Gaps).
💡 Important: Harmonic patterns are most effective on higher timeframes — 4H and above. On lower timeframes, noise increases and reliability drops significantly. For clean execution and meaningful structure, stay with mid to high timeframes.
Here’s how to trade it effectively:
✅ Wait for the full pattern to form — don’t front-run
✅ Use fib levels and structure confluence to validate Point D
✅ Use order flow tools (like Exocharts) to confirm absorption or volume shift
✅ Enter on Point D with your stop-loss just beyond X
✅ Take profits at common retracement levels like the 0.382 or 0.618 of the CD leg
Patience is key. Harmonic traders wait for the market to complete the cycle — then strike with a plan.
📌 Final Thoughts
SUI is delivering clean harmonic respect, and this setup is no exception. Whether you're already short or waiting for further confirmation, keep an eye on volume, liquidity zones, and reaction levels around $3.1191. If this zone holds, it may serve as a pivot for the next move.
Pattern. Precision. Patience. That's how you catch high-probability trades like this.
_________________________________
💬 If you found this helpful, drop a like and comment!
Want breakdowns of other charts? Leave your requests below.

HFCL Long Trade Setup📊 Price Action & Trend Analysis
Analyzing market trends using price action, key support/resistance levels, and candlestick patterns to identify high-probability trade setups.
Always follow the trend and manage risk wisely!
Price Action Analysis Interprets Market Movements Using Patterns And Trends On Price Charts.
👉👉👉Follow us for Live Market Views/Trades/Analysis/News Updates.

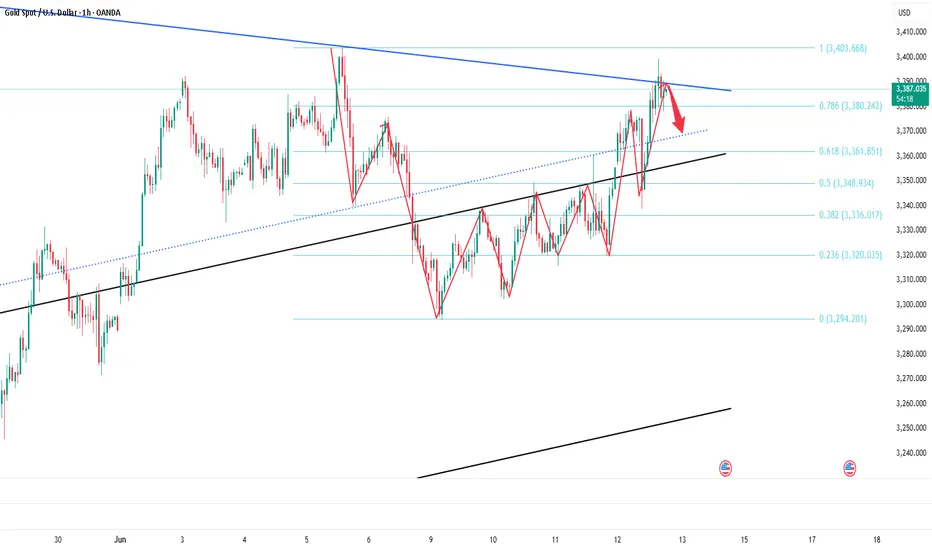
GOLD → Geopolitical risks are driving gold prices up. To ATH?FX:XAUUSD is updating its interim highs as it retests resistance at 3435 amid escalating tensions in the Middle East. Economic risks are on the rise...
Gold rose 1.5% on Friday in Asian trading as investors sought refuge from escalating tensions between Israel and Iran. The price approached 7-week highs and could reach $3,500 if the conflict intensifies. The US and Israel have warned of serious consequences, while Iran has promised to respond. Geopolitics has overshadowed economic news, and markets are pricing in the possibility of a Fed rate cut in September.
Technically, the price is emerging from a local consolidation and testing a fairly important resistance level, forming a false breakout and correction. But this does not mean that the price will fall...
Resistance levels: 3425, 3435, 3461
Support levels: 3408, 3400, 3377
If gold consolidates above 3425 and continues to storm the resistance, growth may continue, and at the moment, there is a fairly high probability of a retest of the ATH. However, the ideal scenario would be a retest of the zone of interest 3408 - 3400 and the capture of liquidity before continuing growth.
Best regards, R. Linda!

TELEKOM MALAYSIA going to rm8based on research report by
2025-06-13 TM
TELEKOM MALAYSIA BHD
6.60 8.15 +1.55 (23.48%) BUY RHB-OSK
now retracing to 0.618
predicting that it will go for the third wave untul 1.618 at RM8

BTC 1H105800 maybe is the target but we have so many come backs until we hit it .
the 108k and then 105k path is more likely to happen.
𓄀𝓈𝓉𝒶𝓎 𝓉𝓊𝓃ℯ𝒹 𓃓

Gold 3rd DegreeOANDA:XAUUSD is likely headed for another high and a daily close of $3420 as highlighted in the previous idea under it's notes. 3rd Top.

EUR/USD - Daily highs taken, now what?Introduction
The EUR/USD made a strong move higher today, establishing a clear uptrend on the 4-hour chart. With this latest push, it swept the daily liquidity above the previous high. The question now is whether the EUR/USD will continue moving higher or if there are opportunities for long entries at lower levels.
Liquidity Sweep
EUR/USD has taken out liquidity above the daily highs, where many stop losses are typically positioned. These stops have now been removed from the market. This area could potentially act as a support and resistance flip. However, if we see a 4-hour candle close below the previous daily high, further downside becomes likely.
Where Can We Look for Buys?
During the recent 4-hour move higher, significant progress was made. This upward movement created a daily Fair Value Gap (FVG) between $1.149 and $1.145. This FVG aligns perfectly with the golden pocket Fibonacci level, drawn from the swing low to the swing high. As a result, this zone forms a strong area of confluence for potential buy positions to target a retest of the highs.
Conclusion
Although we are currently breaking above the previous high, this move has yet to be confirmed as sustainable. Holding above this level is crucial. If a 4-hour candle closes below the previous high, it becomes likely that we will revisit the daily FVG and golden pocket Fibonacci zone.
Disclosure: I am part of Trade Nation's Influencer program and receive a monthly fee for using their TradingView charts in my analysis.
Thanks for your support.
- Make sure to follow me so you don't miss out on the next analysis!
- Drop a like and leave a comment!

Stick to shorting gold and aim for the target area.Gold has not broken through 3400 after accelerating its rise, and the upper suppression effect still exists; currently gold is fluctuating in a narrow range below 3390, showing signs of stagflation to a certain extent. Therefore, the accelerated rise of gold is not for the short-term impact of 3400, but for a deep retracement, eliminating more scattered funds in the market by sweeping up and down.
So in the short term, I think it is difficult for gold to continue to break upward under the suppression of the resistance area near the short-term high of 3402, but to test the lower support area of 3375-3365 before breaking upward. So I have shorted gold as scheduled according to the short trading plan mentioned above, and aimed at the lower target area of 3375-3365.
At present, our short position has made a certain profit, but I still look forward to profiting from gold hitting TP! Let us look forward to gold falling back to the target area as expected!
NQ Power Range Report with FIB Ext - 6/13/2025 SessionCME_MINI:NQM2025
- PR High: 21915.75
- PR Low: 21861.75
- NZ Spread: 120.5
No key scheduled economic events
Session Open Stats (As of 12:45 AM 6/13)
- Session Open ATR: 389.53
- Volume: 66K
- Open Int: 267K
- Trend Grade: Neutral
- From BA ATH: -4.9% (Rounded)
Key Levels (Rounded - Think of these as ranges)
- Long: 22096
- Mid: 20383
- Short: 19246
Keep in mind this is not speculation or a prediction. Only a report of the Power Range with Fib extensions for target hunting. Do your DD! You determine your risk tolerance. You are fully capable of making your own decisions.
BA: Back Adjusted
BuZ/BeZ: Bull Zone / Bear Zone
NZ: Neutral Zone

GBP/JPY Bearish Pullback to Key Fibonacci LevelsGBP/JPY shows a strong bearish move followed by a consolidation near the 0.236–0.382 Fibonacci retracement zone. I’m monitoring this area closely as price retests the 0.5 (194.648) and 0.618 (194.855) Fibonacci levels — classic zones for bearish continuation setups.
This setup suggests that price may reject the 0.618 zone, especially if volume and candle structure confirm resistance. My trade idea is based on short entries near 0.5–0.618 with a potential continuation toward 193.33 (-0.25) and 192.68 (-0.618 extension).

eurusd long 1h*The content on this analysis is subject to change at any time without notice, and is provided for the sole purpose of assisting traders to make independent investment decisions.

bitcoin for long *The content on this analysis is subject to change at any time without notice, and is provided for the sole purpose of assisting traders to make independent investment decisions.

EURCHF Wave Analysis – 12 June 2025- EURCHF reversed from the resistance zone
- Likely to fall to support level 0.9300
EURCHF currency pair recently reversed down from the resistance zone between the key resistance level 0.9410 (which has been reversing the price from April), the upper daily Bollinger Band and the 50% Fibonacci correction of the downward impulse from April.
The downward reversal from this resistance zone stopped the (c)-wave of the previous ABC correction ii.
Given the overbought daily Stochastic, EURCHF currency pair can be expected to fall to the next support level 0.9300 (which stopped earlier waves b and ii).

Ethereum Name Servise ENS price analysisFor the second day in a row, trading volumes on the CRYPTOCAP:ETH futures market have exceeded those of CRYPTOCAP:BTC
(Is the market alpha returning or are profits being locked in? Write your thoughts in the comments ?)
💡 And we will write an analysis of the possible movement of the NYSE:ENS price — this is the #Ethereum Name Service management token, which is used to manage the protocol and influence pricing decisions for its .eth addresses and price oracle.
👌 Currently, all forces are preventing the OKX:ENSUSDT price from consolidating above $23.6. But when that happens, it will be a very safe level to buy on a retest.
📊 More risky, but with greater earning potential, are purchases at $17.50 and $14.50.
Set your “buckets” for purchases and wait for them to “fill up.”
And then, who knows, maybe in 2025, the price of NYSE:ENS will reach its ATH.
_____________________
Did you like our analysis? Leave a comment, like, and follow to get more

BGC LongEquity Play. I plan to get a few shares of this stock since it's cheap, and run a covered call strategy up to 10, hopefully it stays above that level.

Signs of reversalBTC hit its technical target after breaking below its range at the resistance of the January ATH. The hourly RSI is showing signs of reversal.


SP500: Recursive Historic PatternAs a part of my research on fractal phenomena, I'm collecting recursive patterns directly to better understand the emerging structural landscape.
Documenting systemic behavior
Sharp drop
Distinctive growth cycle
Putting this out as current price is near all time high.

Waiting DOGE to hit ATHDoge is showing reversal signs. My first target is ATH (all-time high), which is just 163% away. The next goal is at least a 3x from there. Right now, we're in the weekly overbought zone (OB). If we break through it, the idea is invalidated.

USD/CHF 4H Analysis – Bearish Continuation Setting Up?USD/CHF is currently forming a textbook symmetrical triangle consolidation pattern just below key EMAs (20, 50, and 200), signaling potential exhaustion in bullish momentum. Price is compressing against the upper boundary of the triangle, failing to sustain above the 0.382 Fib retracement level (0.82302), which is aligned with the 50 EMA – a known area of dynamic resistance.
This consolidation follows a clear bearish leg from the swing high at 0.83472, which suggests this triangle is likely a continuation pattern. A clean break below the ascending trendline support would confirm bearish continuation, with a measured move target near the 0.81068 level, which aligns with the -0.27 Fib extension.
🔍 Key Technical Levels:
Resistance: 0.82302 (0.382 Fib), 0.82525 (0.5 Fib), 0.82753 (0.618 Fib)
Support: 0.82026 (0.236 Fib), 0.81579 (Swing Low), 0.81068 (Bearish Extension Target)
📌 Watch for:
A decisive break and close below triangle support
Volume spike or bearish engulfing candle for confirmation
RSI is neutral but leaning slightly bearish; room for downside
🎯 Bearish Bias
📍 Tag: #USDCHF #ForexAnalysis #WrightWayInvestments

XAU/USD 1H – Clean Impulsive Setup UnfoldingGold has completed a clean Wave (2) correction, bottoming at $3,292.30, respecting both structural demand and fib confluence. Price is now showing early signs of Wave (3) development to the upside.
📌 Key Structure:
Wave (1) High: $3,403.30
Wave (2) Low: $3,292.30 (confirmed higher low structure)
Market is now consolidating slightly above the 0.5 fib level ($3,324.45), with bullish structure still intact.
📈 Technical Confluence:
Price is holding the internal bullish trendline
RSI is neutral but building potential upside momentum
Price action is forming higher lows, indicating strength post-correction
🎯 Next Bullish Targets:
$3,366.08 (0.236 fib level of Wave (2) correction)
$3,403.30 (Wave (1) high retest)
Final Wave (3) extension zone: $3,445 – $3,500
📉 Invalidation Level:
A break and close below $3,292.30 would invalidate this Wave (2) bottom and open the door for a deeper correction.
✅ Bias:
Bullish, as long as price holds above the 0.618 – 0.705 fib zone. A strong push from this area could confirm the next leg of Wave (3).
@WrightWayInvestments
@wrightwayinvestments
@wrightwayinvestments

USD/CAD Breaks Through Multi-year Trend Support USD/CAD broke through a key pivot zone last week at 1.3721/94- a region defined by the 38.2% retracement of the 2021 advance and the 61.8% retracement of the late-2023 advance. The subsequent decline is now extending more than 2.9% off the May highs with initial support within striking distance.
Weekly momentum has now dropped to the lowest levels since 2021 and a break of the 2021 uptrend (2022 trendline) threatens further losses ahead. Initial weekly support rests at the 1.618% extension of the February decline / 78.6% retracement of the late-2023 advance near 1.3504/23. Note that basic channel support converges on this threshold over the next few weeks and further highlights the technical significance of this zone (area of interest for possible downside exhaustion / price inflection IF reached). Subsequent support rests with the 2024 low-week clow (LWC) at 1.3360 and the 2023 LWC at 1.3218.
Weekly resistance is now eyed back at 1.3721 & 1.3795. Broader bearish invalidation is now lowered to the 52-week moving average / 2022 swing high near ~1.3961/78- a breach / close above the yearly channel would ultimately be needed to suggest a more significant low is in place.
Bottom line : USD/CAD has broken below multi-year uptrend support and threatens further losses in the weeks ahead. From a trading standpoint, look to reduce portions of short-exposure / lower protective stops on stretch towards 1.3523 IF reached- rallies should be limited to 1.3795 IF price is heading lower on this break with a close sub-1.35 needed to fuel the next major leg of the decline.
-MB
