BVOL (Bitcoin Historical Volatility Index) Weekly TF 2025 Summary:
BVOL (Bitcoin Historical Volatility Index) remains compressed near historic lows. This analysis explores the potential for a volatility expansion cycle, key Fibonacci retracement levels, and how shifts in volatility may precede directional moves in BTC and the broader crypto market.
Chart Context:
Timeframe: Weekly (1W)
Current BVOL: ~13.23
Historical Support Zone: ~11.76–15 (consolidation base since 2022)
Resistance Area: ~25–35 (marked breakout threshold)
Fibonacci Retracement (from peak ~192.79):
23.6% = 56.17 → 2nd TP
38.2% = 89.01 → 3rd TP
48.6% = 99.74 → Intermediate fib zone
61.8% = 123.63 → Cycle expansion cap (potential BTC top region)
100% = 192.79 → All-time spike (rare volatility events)
Key Technical Observations:
Consolidation Floor: Since mid-2022, BVOL has hovered near extreme lows often a prelude to sharp directional moves.
Support-turned-Resistance: Past volatility surges often topped near fib clusters (23.6%, 38.2%, 61.8%). These will likely act as TP zones during volatility spikes.
Expected Path:
Base breakout above 25 → TP1 = 35
Acceleration phase → TP2 = 56–60
High volatility climax → TP3 = 85–89
Volatility Trend Commentary:
Current Phase: Low volatility compression, common in accumulation phases.
Volatility Expansion Signal: A break above the 25–35 band may signal the start of a high-volatility impulse (typically aligned with large BTC directional moves).
Dotted Paths on the chart reflect the two key expansion possibilities:
Straight rally up to TP3 (85)
Mid-stage pullback post-TP2 (bear trap scenario)
Macro Correlation:
BVOL vs BTCUSD: Historically, BVOL lows precede strong BTC trends — both bull and bear cycles.
BVOL vs BTC.D: BVOL surges often shift dominance; either BTC leads during volatility or altcoins rotate post-BTC move.
BVOL vs TOTAL / TOTAL2 / TOTAL3:
Volatility compression in BVOL is directly tied to range-bound TOTAL3.
Total:
Total2:
Total3:
BVOL expansion is often mirrored by strong TOTAL2 & TOTAL rallies.
Confluence seen between BVOL TP zones and critical fib levels in TOTAL charts.
Bias & Strategy Implication:
Volatility Expansion Expected: Current structure is unsustainable; expansion is highly probable in coming weeks/months.
Watch BTC Price Action: If BTC breaks key levels while BVOL rises → Confirmed trend.
Portfolio Strategy: Prepare for volatility-driven liquidation zones. Use BVOL to gauge position sizing and risk.
Notes & Disclaimers:
This analysis is part of the BitonGroup Macro Series.
BVOL is not a directional indicator but a volatility proxy. use in combination with price and dominance metrics.
Always combine volatility forecasts with proper stop-loss and leverage management.
Fibonacci

SHIBUSDT soon after breaking red trendline can pump hard On this pump for market we may not have a new ATH for coins like SHIBUSDT or we may have(10% possible).
But as we can see price had a huge amount of fall and now with simple touch near previous daily high we earn good +200% profit.
DISCLAIMER: ((trade based on your own decision))
<<press like👍 if you enjoy💚

Dollar Falling Ends Soon? Look What Pattern Is Forming!”Asset: U.S. Dollar Index (DXY)
Timeframe: 1D (Daily Chart)
Methodology: Elliott Wave + FVG (Fair Value Gap) + Price Action
DXY has completed an impulsive 5-wave bearish structure, now entering a high-probability reversal zone marked by strong buyer interest around the Wave 5 bottom.
📌 Key Insights:
Wave 5 approaching demand zone (Buyers' area)
Price inside Fair Value Gap (FVG) – potential order block
Bullish reversal expected from here
Forecast: A breakout into an ascending channel, confirming reversal
💡 If Wave 5 holds, we may see a sharp upside rally aligning with smart money accumulation + Elliott Wave psychology.
🔔 Watch for bullish confirmations near 97.50–98.00 for a potential long setup targeting the 104–107 zone.

LULU eyes on $243-248: Decent Support to buy after Earnings DumpLULU earnings report caused a severe dip in price.
It is now testing a serious support at $243.81-248.17
Look to hold, or stab below and come back above.
.
Last Plot that gave PERFECT entry and exit:
.

XAUUSD Video Analysis Brief – Weekly Forecast Summary (2025)This video summarizes the key scenarios and technical outlook for Gold (XAUUSD) on the weekly timeframe, integrating both Fibonacci-based projections and macro fundamentals.
Core Setup
Gold is currently positioned near the 161.8% Fibonacci extension (~$3,276).
A breakout toward $3,500 is possible before a potential corrective move.
Scenario 1: Bullish Continuation
Gold breaks above $3,435 → rallies to $4300 → continues toward major Fibonacci targets:
TP: $4,320, which is the Fibonacci level 261.8%
Scenario 2: Correction First
Gold fails to hold above $3,435 → triggers a healthy correction to:
TP1: $2,920
TP2: $2,650
If support 161.8% level holds in the correction zone, a renewed bullish phase is expected.
Macro Alignment
Central bank gold buying (notably BRICS) supports the long-term bid.
Fed policy leaning dovish → tailwinds for gold.
Inverse correlation with DXY:
DXY below 98.95 → bullish for gold
DXY above 100 → signals correction
Effect on Altcoins
If correction is risk-on driven, capital may rotate into altcoins.
If triggered by macro stress or USD strength, alts may fall alongside gold.
This analysis offers a multi-scenario framework to navigate the next major moves in gold, with key levels to watch for traders, investors, and macro analysts alike.

AMSC eyes on $29.20/40: Key Resistance holding BreakOut to $35AMSC has been grinding upwards in a nice uptrend.
Currently testing a serious resistance $29.20-20.40
Break should continue grind to next res around $35

CRWD watch $450 then 437: Supports to buy after Earnings dumpCRWD ran up into the earnings report then sold the news.
Initial drop hit a minor support zone $449.08-451.81
May well drop to semi-major support $436.67-437.51

EURAUD - Short Term Buy IdeaM15 - Strong bullish move.
No opposite signs.
Currently it looks like a pullback is happening.
Expecting further continuation higher until the two Fibonacci support zones hold.
If you enjoy this idea, don’t forget to LIKE 👍, FOLLOW ✅, SHARE 🙌, and COMMENT ✍! Drop your thoughts and charts below to keep the discussion going. Your support helps keep this content free and reach more people! 🚀

gold 15m for long *The content on this analysis is subject to change at any time without notice, and is provided for the sole purpose of assisting traders to make independent investment decisions.

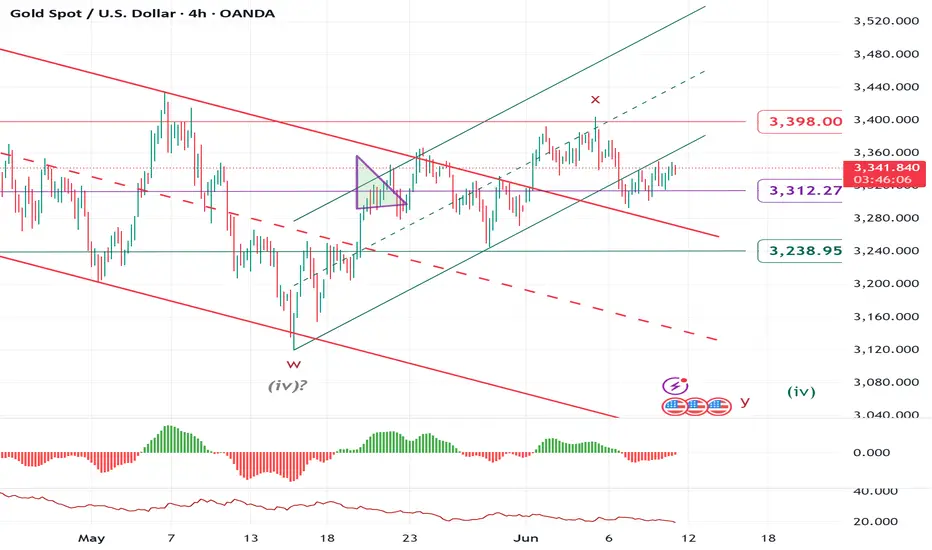
ELLIOTT WAVE XAUUSD H4 update
EW Trade Set Up H4
subminuette wave (iv):
downward price movement from 22 april high at 3500 area looks a sideway correction unless an impulsive movement start breaking up 3350 level first and then 3400 level shortly.
key levels (area)
3400
3350
3312 POC
3290
3240
EURUSD SHORTAccording to natural market structure theory, I observed a gradual increase in volume starting from May 29, which led to a rebound around June 5. However, the uptrend has since lost momentum.
The recent price action has approached the zero line of the descending Fibonacci retracement. This movement, combined with a possible liquidity grab, suggests that the market may shift downward. The target price area is near the 0.5 Fibonacci level, but further observation is needed to confirm this scenario. OANDA:EURUSD

Trend Break + Earnings Strength = ROHLTD Watch!Royal Orchid Hotels Ltd (ROHLTD) has caught the market’s attention recently with a powerful breakout move on the charts, supported by strong fundamentals. The company operates a growing chain of hotels across India under the Royal Orchid and Regenta brands. With domestic tourism booming and business travel recovering steadily, the company is well-positioned to benefit from rising demand in the hospitality sector.
From a technical perspective, the stock had been under a downward-sloping trendline for several months, consistently facing resistance. However, in the latest session, ROHLTD managed to break this trendline with a strong bullish candle and a noticeable increase in volume.
📈 The breakout occurred with volume confirmation, indicating genuine buying interest.
📍 The key breakout level is ₹403 — a daily close above this confirms strength.
🟩 A strong support (reversal) zone lies between ₹365–₹377, where buyers are expected to step in on dips.
🎯 Upside price targets in the near-to-mid term are ₹428, ₹450, ₹485, and possibly ₹545.
On the fundamental side, the company shows healthy financial performance. Revenues have been consistently growing and currently stand above ₹300 crore annually. Profit margins are stable, and the company is maintaining solid profitability.
💰 The Return on Equity (ROE) is around 25%, reflecting efficient capital use.
💸 The company is free cash flow positive, which adds to financial strength.
⚖️ Debt levels are moderate, with a manageable debt-to-equity ratio.
🧮 The stock may appear slightly overvalued near ₹398–₹400, but the strong business outlook and asset-light expansion model justify the premium to some extent.
ROHLTD is also strategically expanding into new cities using a franchise and management contract model, which reduces capital expenditure and increases scalability. This positions the company well for long-term growth without over-leveraging its balance sheet.
For swing traders, the breakout provides an opportunity to enter above ₹403 with a stop loss below ₹360. The targets to watch would be ₹428, ₹450, and ₹485 in the coming weeks. For long-term investors, gradual accumulation near ₹365–₹380 on dips could be a smart strategy, with the potential to reach ₹500+ over the next 6–12 months, provided the company maintains its growth momentum.
In conclusion, ROHLTD is a rare case of a technical breakout aligning with strong fundamentals. While near-term volatility may persist, the overall trend appears bullish, making it a solid candidate for both traders and investors keeping a mid- to long-term view.
Disclaimer: lnkd.in

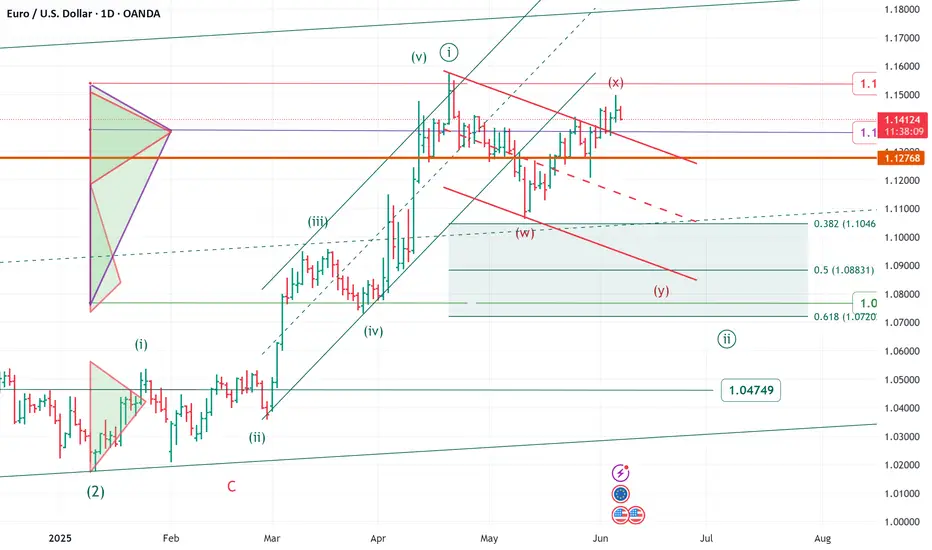
Elliott wave daily EURUSD update
Elliott wave daily EURUSD update
The price movement of the last few weeks requires a change
and update of the wave count
______________________________________
upward movement from area 1.018/genuary 2025 to area 1.1580/april 2025
looks impulsive - minute wave ((i)).
we are now in a corrective minute wave ((ii))
zigzag or flat or any double
target area 1.1040/1.0800 area
in the very short term level to monitor 1.1500 area
over 1.1500 area a flat correction more likely ( to area 1.1570)
note
FX option expiries for 6 June 10am New York cut
1.1500 (EUR 3.19bn)
1.1400 (EUR 2.38bn)
1.1300 (EUR 1.28bn)
FOREXLIVE
SPX'S BULLS !6200 Will get touched easily soon !
because the much vol up there waiting to be hunted at 6100+
𓄀𝓈𝓉𝒶𝓎 𝓉𝓊𝓃ℯ𝒹 𓃓

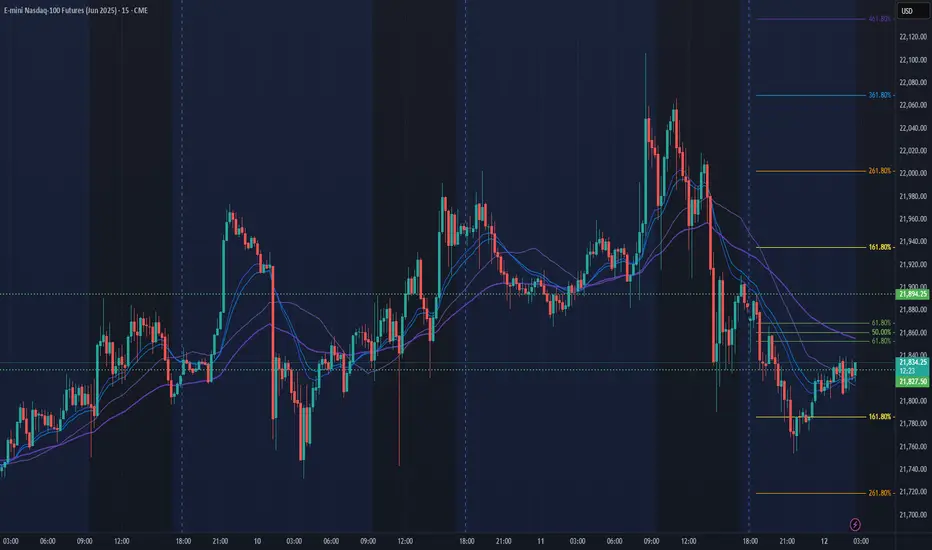
NQ Power Range Report with FIB Ext - 6/12/2025 SessionCME_MINI:NQM2025
- PR High: 21894.25
- PR Low: 21827.25
- NZ Spread: 150.0
Key scheduled economic events:
08:30 | Initial Jobless Claims
- PPI
13:00 | 30-Year Bond Auction
Session Open Stats (As of 12:25 AM 6/12)
- Session Open ATR: 376.45
- Volume: 24K
- Open Int: 268K
- Trend Grade: Neutral
- From BA ATH: -3.6% (Rounded)
Key Levels (Rounded - Think of these as ranges)
- Long: 22096
- Mid: 20383
- Short: 19246
Keep in mind this is not speculation or a prediction. Only a report of the Power Range with Fib extensions for target hunting. Do your DD! You determine your risk tolerance. You are fully capable of making your own decisions.
BA: Back Adjusted
BuZ/BeZ: Bull Zone / Bear Zone
NZ: Neutral Zone
Room for Further Strength as Price Approaches ResistanceOn the 1-hour timeframe, I estimate that XAUUSD is currently forming wave c of wave b of wave (a). This implies that XAUUSD still has the potential to strengthen, testing the 3379 level and possibly retesting the resistance area at 3403. However, caution is warranted going forward, as this outlook reflects the bearish scenario for XAUUSD.
