FLOKI Isn’t Missing the Party🚀 CRYPTO:FLOKIUSD Price has broken above the May peak, confirming a bullish continuation. With momentum building, price is now eyeing the next upside target near $0.00018.
#elliottwave #memecoins #altseason
Fibonacci

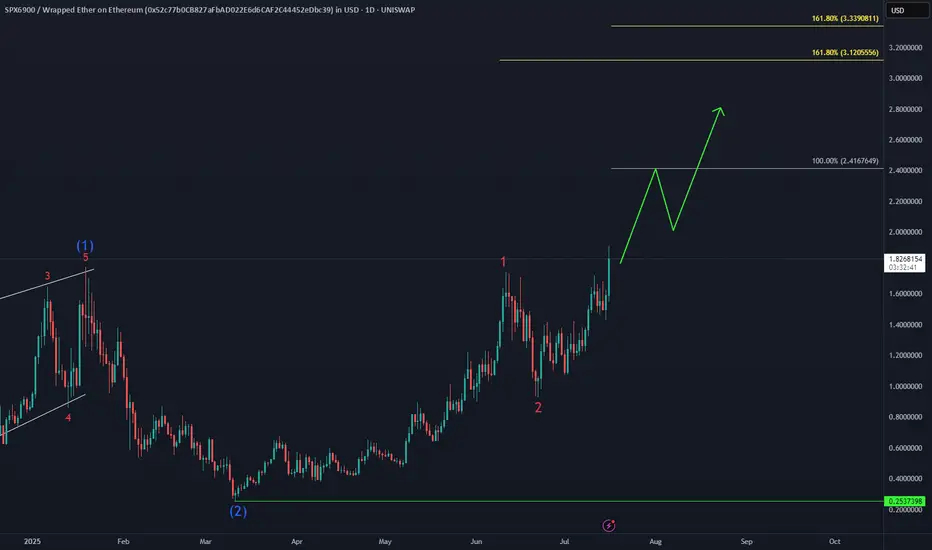
#SPX6900 Bullish SequenceThe Gate Is Open – Send It 🚀🚀🚀
UNISWAP:SPXWETH_52C77B.USD just smashed into a new all-time high, unlocking the next bullish targets at $2.4 and $3.1.
fuboTV $5.00 price target Positive Divergence Multi time frameMy trade on fuboTV has a $5.00 price target. With positive divergence multiple time frames 15,1hr, 4hr. An RSI scoop where the hrly RSI with a length setting of 36 shows upward momentum? The Chande momentum oscillator with a setting of 24 indicates the price may not stall at $4.50.

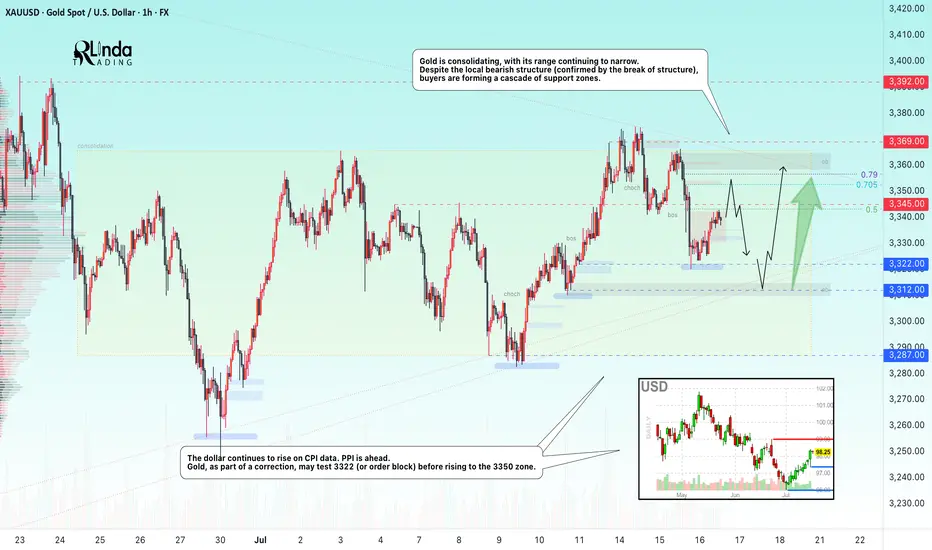
GOLD → Borders are shrinking. Consolidation continues...FX:XAUUSD is adjusting amid controversial CPI data and confirming the local bearish market structure. The PPI is ahead, and gold is consolidating, with its boundaries continuing to narrow...
Gold is recovering slightly but remains under pressure amid rising bond yields and a stronger US dollar. Higher inflation in the US reduces the chances of a quick Fed rate cut. Traders are cautious ahead of the PPI data release. If producer inflation exceeds forecasts, the dollar may rise again, putting further pressure on gold
Technically, we see consolidation in a symmetrical triangle pattern. Trading within the consolidation has a negative side - low volatility and unpredictable movements. The purpose of such movements is accumulation. However, decisions can be made based on relatively strong levels. In the current situation, we are seeing a rebound from 0.5 Fibonacci (I do not rule out a retest of the 0.7 zone before correction). The price may head towards the liquidity zone of 3322 before rising to the upper boundary of the consolidation and the zone of interest of 3350-3360.
Resistance levels: 3345, 3353, 3369
Support levels: 3322, 3312, 3287
The problem is that the price is in a consolidation phase. That is, technically, it is standing still and moving between local levels. You can trade relative to the indicated levels. Focus on PPI data. At the moment, gold is in the middle of a triangle and is likely to continue trading within the boundaries of a narrowing channel due to uncertainty...
Best regards, R. Linda!
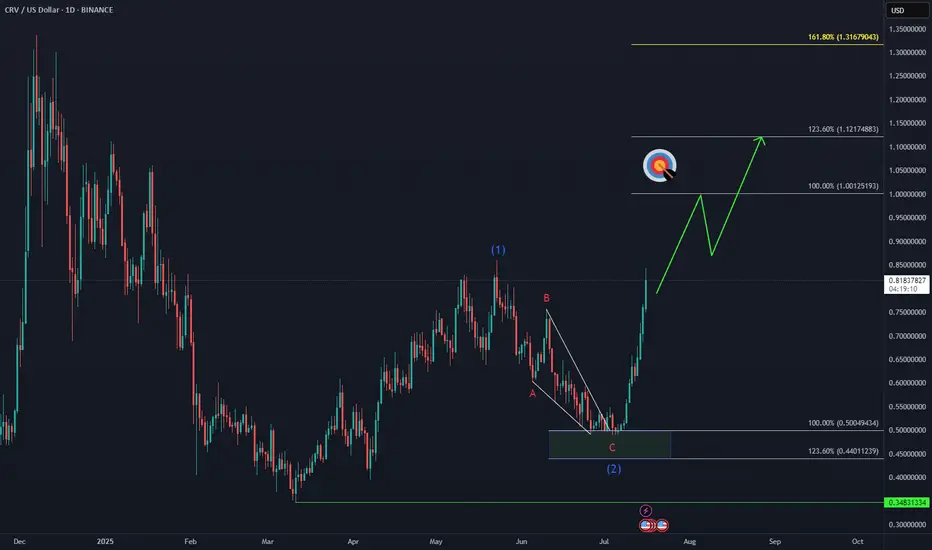
CRV Marching Toward Target📈 CRYPTO:CRVUSD is approaching a key breakout level, with bulls aiming to surpass the May peak and reach the $1.00 initial target.
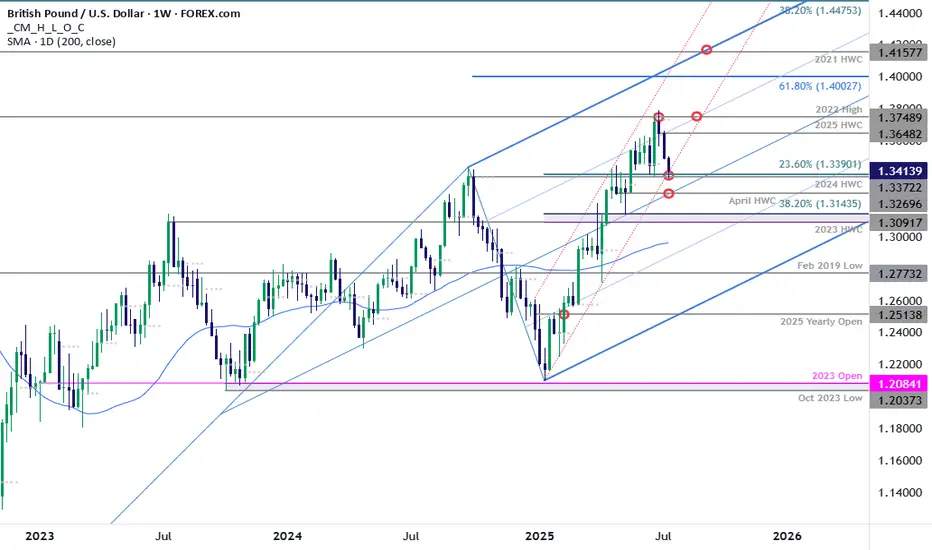
GBP/USD Plunges to Make-or-Break SupportSterling is poised to mark a third consecutive weekly decline after turning from resistance at multi-year highs. The decline takes price into critical support at the yearly trendline- this is a make-or-break level for the bulls.
GBP/USD is testing confluent support today at 1.3372/90- a region defined by the 2024 high-week close (HWC) and the 23.6% retracement of the yearly range. Looking for a reaction off this mark with a weekly close below the April HWC / median-line at 1.3270 ultimately needed to suggest a more significant high is in place / invalidate the yearly uptrend. Subsequent support rests with the 2023 HWC / 38.2% retracement at 1.3091-1.3143 and the 52-week moving average, currently near ~1.2980.
Weekly resistance now eyed at the yearly high-week reversal close at 1.3648 with a breach / close above the 2022 high at 1.3749 still needed to mark resumption of the broader Sterling up trend. Subsequent resistance objectives eyed at the 61.8% extension of the 2022 advance at 1.4003 and the 2021 HWC at 1.4158.
Bottom line: Sterling is attempting to break below the yearly uptrend and the focus is on the weekly close with respect to 1.3372/90- risk for price inflection here. From a trading standpoint, a good zone to reduce portions of short-exposure / lower protective stops- rallies should be limited to 1.3648 IF price is heading lower on this stretch with a close below 1.3270 needed to suggest a reversal is underway.
-MB
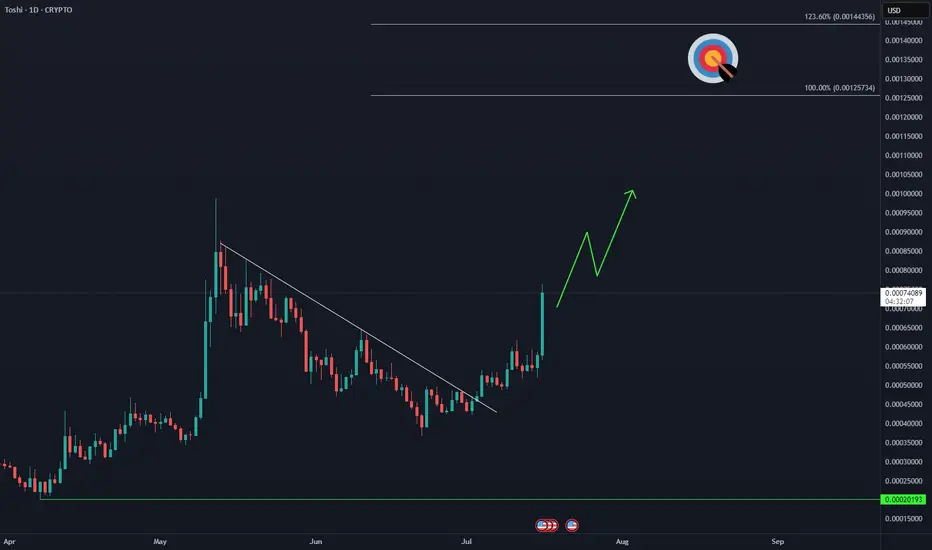
TOSHI Bulls on the Move🚀 COINBASE:TOSHIUSD is showing signs of acceleration, aiming to break above the May peak and extend toward the $0.0012 target zone.
#btc #btcusd #elliottwave short sell setup wave 4 16Jul24This count is based on my assumptions so anything can happen not a trading or financial advice just for educational purposes only kindly do your own ta thanks trade with care good luck.

Bitcoin positive diversion to $131,000Using fibonacci retracements for price targets based off of positive divergences on the 15 min time frame and hourly time frame. I am utilizing 2 ioscilating indicators: RSI length is 36 with smma at 50 and the Chande momentum oscillator with a length of 24. My conservative estimate is $131,000 for a safe trade close. $132,400 exact area for pullback to $128,500?

GBPJPY in Premium Zones of 2008 Financial Crisis - {17/07/2025}Educational Analysis says that GBPJPY (FX pair) may give trend Trading opportunities from this range, according to my technical analysis.
Broker - FXCM
So, my analysis is based on a top-down approach from weekly to trend range to internal trend range.
So my analysis comprises of two structures: 1) Break of structure on weekly range and 2) Trading Range to fill the remaining fair value gap
Will Jpy start to lose value like it is doing since 2019 or it will do free fall same like 2008 crisis.
Let's see what this FX pair brings to the table for us in the future.
Please check the comment section to see how this turned out.
DISCLAIMER:-
This is not an entry signal. THIS IS FOR EDUCATIONAL PURPOSES ONLY.
I HAVE NO CONCERNS WITH YOUR PROFIT OR LOSS,
Happy Trading.

DOGEUSDT: Time For Bulls To Rule! The Dogecoin is currently trading at a key buying level, making it a potential opportunity to buy. However, we need confirmation before making a purchase or entering a trade. This trade could take time to develop as we are currently in the accumulating phase. To be certain of the price direction, we need to enter the distribution phase. While a single swing trade could be a target, you can set your own risk management parameters.
Good luck and trade safely!
Team Setupsfx_

Bitcoin Wave Analysis – 16 July 2025- Bitcoin reversed from a support area
- Likely to rise to resistance level 122770.00
Bitcoin cryptocurrency recently reversed up from the support area located between the key support level 115000.00 and the support trendline of the daily up channel from June.
This support area was further strengthened by the 38.2% Fibonacci correction of the sharp upward impulse from July.
Given the clear daily uptrend and the strongly bullish sentiment seen across cryptocurrency markets today, Bitcoin cryptocurrency can be expected to rise to the next resistance level 122770.00 (top of the previous impulse wave i).

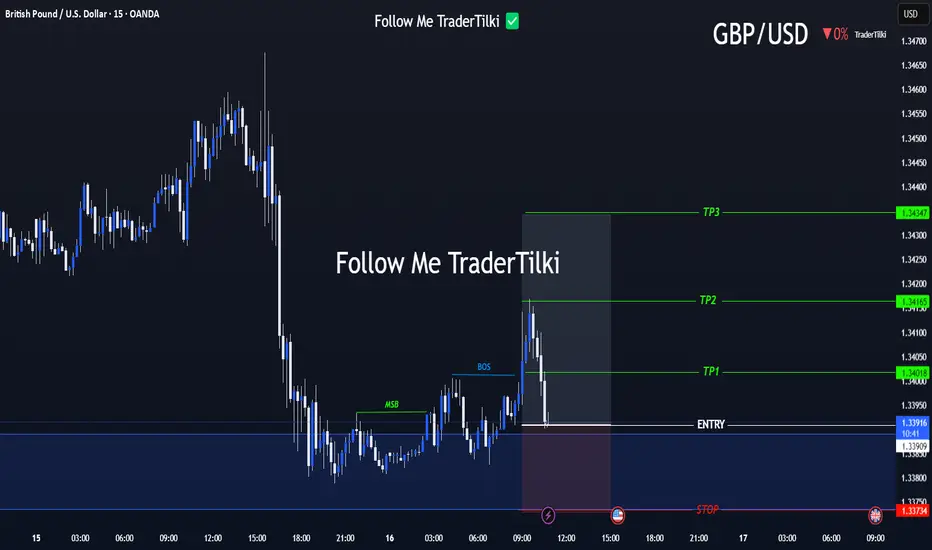
Strategic Entry, Clear Targets: The GBPUSD Game Plan Is Set📢 Hello Guys,
I've prepared a fresh GBPUSD signal for you:
🟢 Entry Level: 1.33918
🔴 Stop Loss: 1.33734
🎯 TP1: 1.34018
🎯 TP2: 1.34165
🎯 TP3: 1.34347
📈 Risk/Reward Ratio: 2,40
------
Your likes and support are what keep me motivated to share these analyses consistently.
Huge thanks to everyone who shows love and appreciation! 🙏
Patanjali Foods: A Potential Reversal Brewing Near Demand Zone?The price has now retraced back into a key value zone between 1,610 - 1,635, which has previously acted as a strong base. This zone also coincides with high volume activity on the visible range volume profile - suggesting accumulation interest.
Technically, the stock is near the 0% Fibonacci extension with multiple confluences of past support and volume, forming a potential base.
If this holds, look for retracement targets:
• First bounce zone: ₹1,687 (50% Fib)
• Further recovery: ₹1,745–₹1,775 (Fib 61.8–78.6%)
Long-term: ₹1,861 (161.8% Fib extension), ₹2,016 (261.8%)
Fundamentals Snapshot:
• Market Cap: ~₹58,000 Cr
• P/E: ~34x | P/B: ~3.8x
• Promoter Holding: 80.82% (No pledging)
• Debt-to-Equity: ~0.25
• ROCE: ~13.2% | ROE: ~10.4%
• FII Holding: 3.6%, DII Holding: 6.3%
Patanjali’s brand strength in edible oils, packaged foods, and growing FMCG integration offers secular demand visibility. The recent correction seems sentiment-driven, not structural.
Keep in Focus:
A decisive close above 1,660 could indicate a short-term reversal.
This chart is for educational use only and not a buy/sell recommendation.

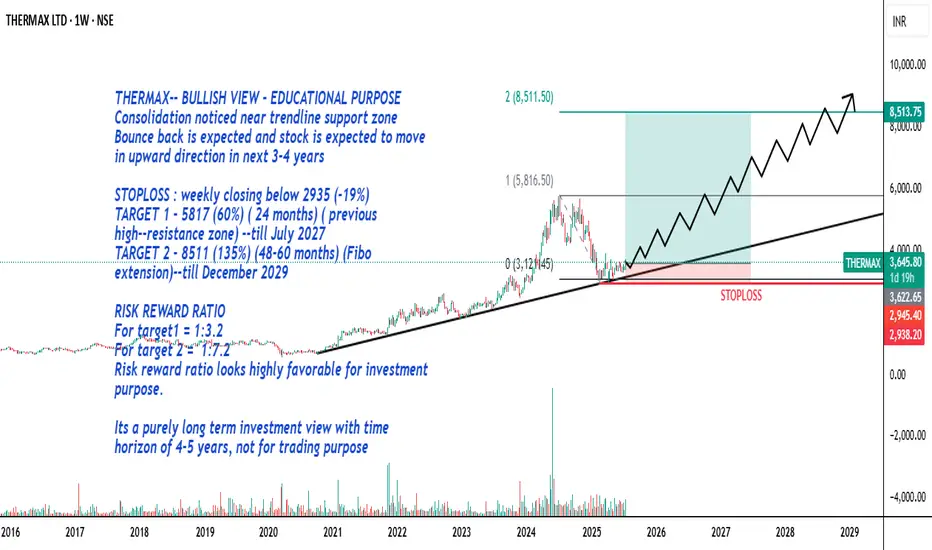
THERMAX-- BULLISH VIEW - EDUCATIONAL PURPOSE
Consolidation noticed near trendline support zone
Bounce back is expected and stock is expected to move in upward direction in next 3-4 years
STOPLOSS : weekly closing below 2935 (-19%)
TARGET 1 - 5817 (60%) ( 24 months) ( previous high--resistance zone) --till July 2027
TARGET 2 - 8511 (135%) (48-60 months) (Fibo extension)--till December 2029
RISK REWARD RATIO
For target1 = 1:3.2
For target 2 = 1:7.2
Risk reward ratio looks highly favorable for investment purpose.
Its a purely long term investment view with time horizon of 4-5 years, not for trading purpose
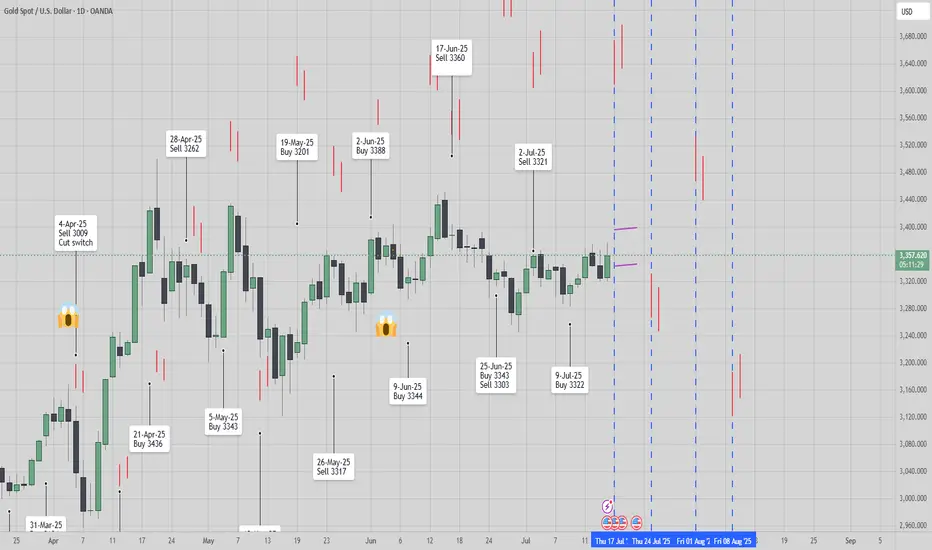
[ TimeLine ] Gold 17 July 2025📆 Today is Wednesday, July 16, 2025
📌 Upcoming Signal Dates:
• July 17, 2025 (Thursday) — Single-candle setup
• July 17–18, 2025 (Thursday–Friday) — Two-candle combined range
🧠 Trading Plan & Notes
✅ Gold recently moved in a wide range between 3365 to 3282, and by the time this signal is published, we’re seeing signs of a strong reversal.
✅ I will be trading both the July 17 and July 17–18 signals as part of my ongoing live research and strategy development.
✅ The same timeframe and signal approach also applies to other instruments such as BTC, US Index, and several commodity pairs.
⚠️ If you’re feeling cautious or risk-averse, it’s perfectly fine to skip the July 17 single-candle setup and wait for the 2-day range (July 17–18) for added confirmation.
📋 Execution Plan
🔹 Range Formation:
• Wait for the Hi-Lo range from the selected candle(s) to fully form.
• Ranges will be marked with purple lines on the chart.
• After market close, the chart will be updated with 60-pip buffer zones, Fibonacci retracement levels, and supporting indicators.
🔹 Entry Trigger Rule:
• Entry only if price breaks out beyond the defined range, including the 60-pip buffer.
🔹 Risk Management – Recovery Strategy:
• If Stop Loss (SL) is hit, the trade will be cut/switch, and position size doubled on the next valid breakout signal to aim for recovery.
📉📈 Chart Reference
🔗 Copy & paste into TradingView: TV/x/6x8VJKs1/
📌 Stay disciplined, trust the process, and let the chart guide your decisions.
🛡️ Manage your risk — protect your capital.
[ TimeLine ] Gold 2 July 2025📆 Today is Sunday, June 29, 2025
📌 Upcoming Gold Signal Dates:
• July 2, 2025 (Wednesday) — Single-candle setup
• July 2–3, 2025 (Wednesday–Thursday) — Two-candle combined range
🧠 Trading Plan & Notes
✅ Gold recently experienced a sharp bearish reversal of ~2000 pips, dropping from the recent high at 3451 to 3251, after failing to hold above the key psychological support at 3300.
✅ I will personally be trading both the July 2 and July 2–3 signals as part of my live research and development strategy.
⚠️ If you’re feeling cautious or risk-averse, it's perfectly reasonable to skip the July 2 single-candle setup and focus instead on the 2-day range (July 2–3) for greater confirmation.
📋 Execution Plan
🔹 Wait for the Hi-Lo range to fully form based on the selected candle(s):
• Ranges will be initially marked with purple lines on the chart.
• After the market closes, I’ll update the chart with 60-pip buffer zones, Fibonacci levels, and other supporting indicators.
🔹 Entry Trigger Rule:
• A trade is executed only when price breaks out beyond the defined range plus a 60-pip buffer.
🔹 Risk Management – Recovery Strategy:
• If Stop Loss (SL) is hit, we will cut/switch the position and double the size on the next valid breakout setup to potentially recover the loss.
📉📈 Chart Reference
🔗 Copy & paste this into your TradingView URL: TV/x/zKeXpt67/

Gold Roadmap: Next Stop $3,325 After Ascending Channel Break?Gold ( OANDA:XAUUSD ) failed to touch the Potential Reversal Zone(PRZ) in the previous idea , and I took the position at $3,351 = Risk-free.
Gold is moving in the Resistance zone($3,366-$3,394) and has managed to break the lower line of the ascending channel .
In terms of Elliott Wave theory , with the break of the lower line of the ascending channel, it seems that gold has completed the Zigzag correction(ABC/5-3-5) .
I expect Gold to trend downward in the coming hours and succeed in breaking the Support zone($3,350-$3,325) and attacking the Support line again , and probably succeeding in breaking this line this time.
Note: Stop Loss (SL) = $3,396
Gold Analyze (XAUUSD), 1-hour time frame.
Be sure to follow the updated ideas.
Do not forget to put a Stop loss for your positions (For every position you want to open).
Please follow your strategy; this is just my idea, and I will gladly see your ideas in this post.
Please do not forget the ✅ ' like ' ✅ button 🙏😊 & Share it with your friends; thanks, and Trade safe.

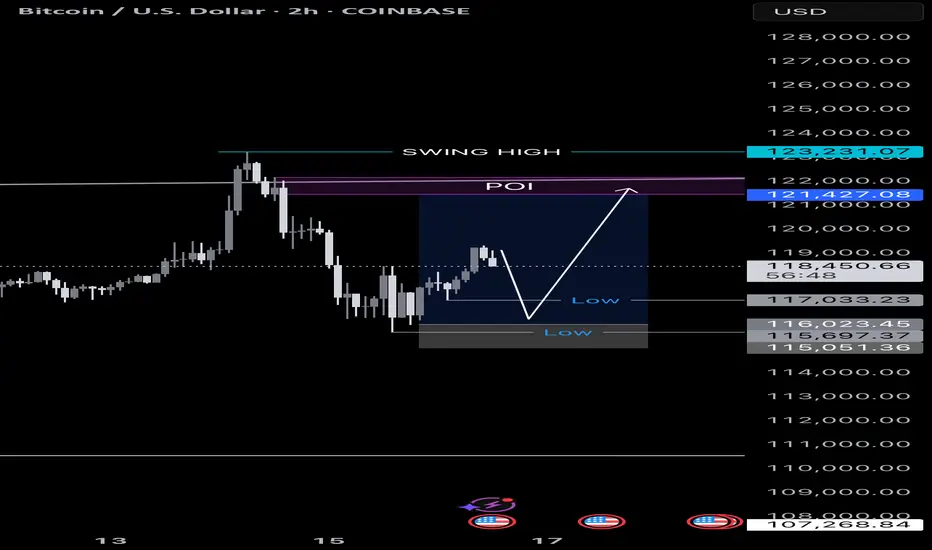
BTC Possible Short-Term Scenario (Long)Sharing my view on the BTC short-term scenario.
Main idea here is to find confluence of the resistance levels using different technicals.

SWING IDEA - NEULAND LABNeuland Lab , a niche API manufacturer with strong export presence and leadership in complex molecules, is offering a technically strong swing trade opportunity from key support levels.
Reasons are listed below :
11,500 zone acting as a crucial support area
Formation of a hammer candle on the weekly timeframe, signaling potential reversal
Reversing from the 0.618 Fibonacci retracement zone – the golden pocket
Taking support at the 50-week EMA , holding long-term trend structure
Target - 14900 // 17600
Stoploss - weekly close below 10215
DISCLAIMER -
Decisions to buy, sell, hold or trade in securities, commodities and other investments involve risk and are best made based on the advice of qualified financial professionals. Any trading in securities or other investments involves a risk of substantial losses. The practice of "Day Trading" involves particularly high risks and can cause you to lose substantial sums of money. Before undertaking any trading program, you should consult a qualified financial professional. Please consider carefully whether such trading is suitable for you in light of your financial condition and ability to bear financial risks. Under no circumstances shall we be liable for any loss or damage you or anyone else incurs as a result of any trading or investment activity that you or anyone else engages in based on any information or material you receive through TradingView or our services.
@visionary.growth.insights

NQ - Long Scalp/SwingYo everyone. Here is what I'm seeing for NWQ today. I'm very bullish because of market structure.
Confirmations:
Bullish 1HR Break of Structure
Intermediate Lows holding
Multiple Bullish FVGs
We may not get an entry lower but we ARE going up.
Happy trading!

Weekly Equities Trade Idea: CRCL Puts (Update)Hello Traders!
I'm providing an update to the CRCL trade idea from Monday July 14th. Here's what I'm watching:
- Price to open within the range from Tuesday July 15th
- Potential imbalance resolve from Monday July 14th at $204.70
- If price breaks Friday July 11th's high at $206.80 the trade is invalidated
Cheers,
DTD

Bitcoin short term moveBTCUSDT
We have swept highs and also swept lows.
Now price is in a minor uptrend.
We can pump from here immediately
Or
Retest 0.718 fib then pump.