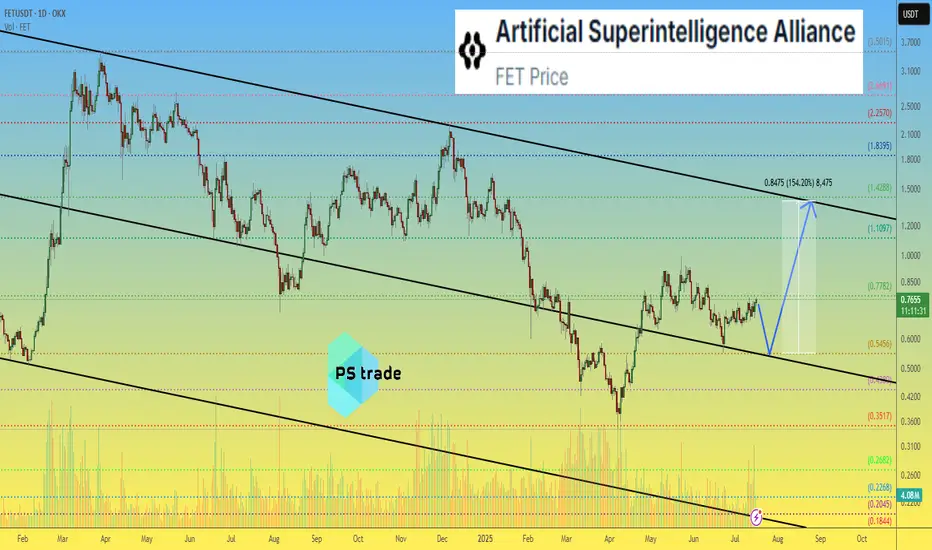
Artificial Superintelligence Alliance - FET price analysis📈 It looks like the price of the combined and updated #FET is trying to consolidate at the top of the channel.
All that remains is to wait for confirmation, i.e., for the OKX:FETUSDT price to stay above $0.55 in the coming days/weeks.
🤖 And then the #ArtificialSuperintelligenceAlliance token (the name is more complicated than the stop word from the movie “Eurotrip” — "hello olds" :) can be purchased for an investment portfolio with a growth potential of at least +150%.
_____________________
Did you like our analysis? Leave a comment, like, and follow to get more
Fibonacci
ETHUSDT 1D Chart Analysis | RSI Strength & Fibonacci TargetsETHUSDT 4H Chart Analysis | RSI Strength & Fibonacci Targets in Play
🔍 Let’s break down the latest ETH/USDT setup — bullish momentum is building with confluences pointing toward key upside targets.
⏳ 4-Hour Overview
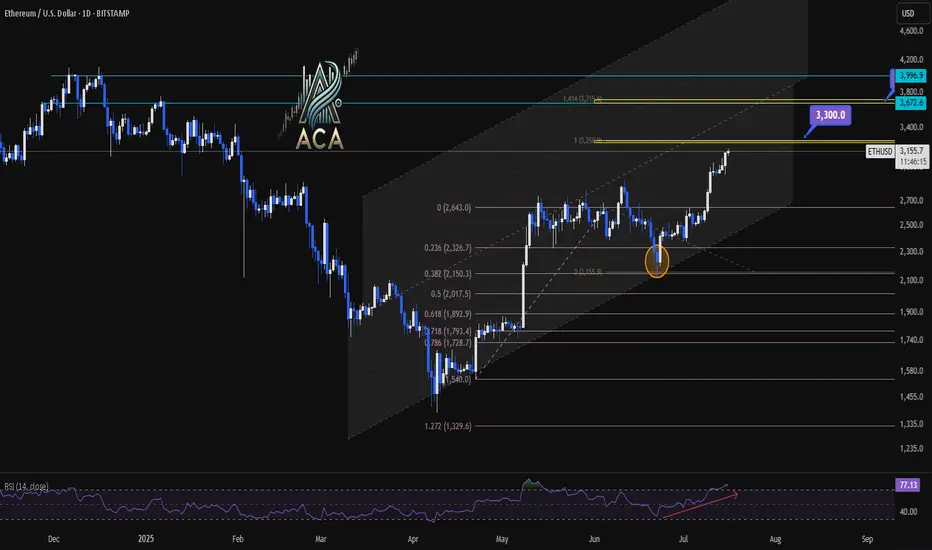
Ether continues climbing within a well-defined ascending channel, with recent candles holding above mid-level support. Price is pressing higher from a clean bounce at the 0.5 and 0.618 Fibonacci retracement zone ($2,017–$1,899), signaling the correction has likely ended.
📉 Fibonacci Levels & RSI Confirmation
- The strong recovery aligns with rising volume and a bullish structure.
- RSI is pushing into overbought territory (above 73), often a sign of strength during trends—not exhaustion.
- ETH is now positioned for a breakout continuation move if momentum holds.
🎯 Bullish Targets Ahead
- Immediate resistance: $3,300 (1.414 Fib extension + historical supply)
- Next major target: $3,700 (1.618 extension + upper channel confluence)
- Pullback zones: $2,950 (mid-channel) and $2,017 (Fib support base)
📊 Key Highlights:
- Price is respecting the rising channel structure — higher lows, higher highs in play.
- Volume supports the breakout narrative, rising on green candles.
- RSI breakout supports trend continuation, not exhaustion.
- Targets at $3,300 and $3,700 remain actionable on a confirmed breakout.
🚨 Conclusion:
ETH is showing a multi-variable bullish setup with clear continuation potential. A strong move above $3,300 could quickly send price toward $3,700. Pullbacks to $2,950–$2,017 could offer high-risk/reward re-entry zones. Momentum favors bulls — stay alert.
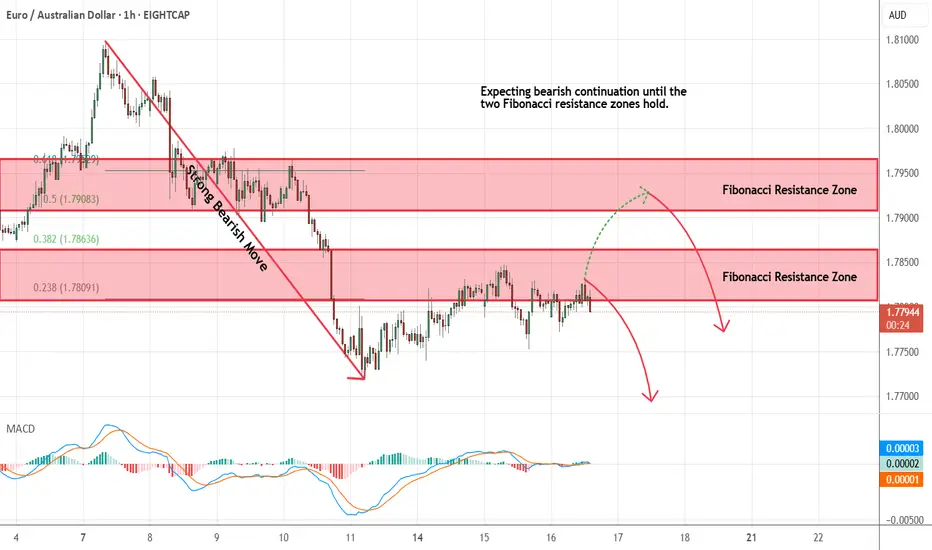
EURAUD - Looking To Sell Pullbacks In The Short TermH1 - Strong bearish move.
No opposite signs.
Currently it looks like a pullback is happening.
Expecting bearish continuation until the two Fibonacci resistance zones hold.
If you enjoy this idea, don’t forget to LIKE 👍, FOLLOW ✅, SHARE 🙌, and COMMENT ✍! Drop your thoughts and charts below to keep the discussion going. Your support helps keep this content free and reach more people! 🚀
--------------------------------------------------------------------------------------------------------------------
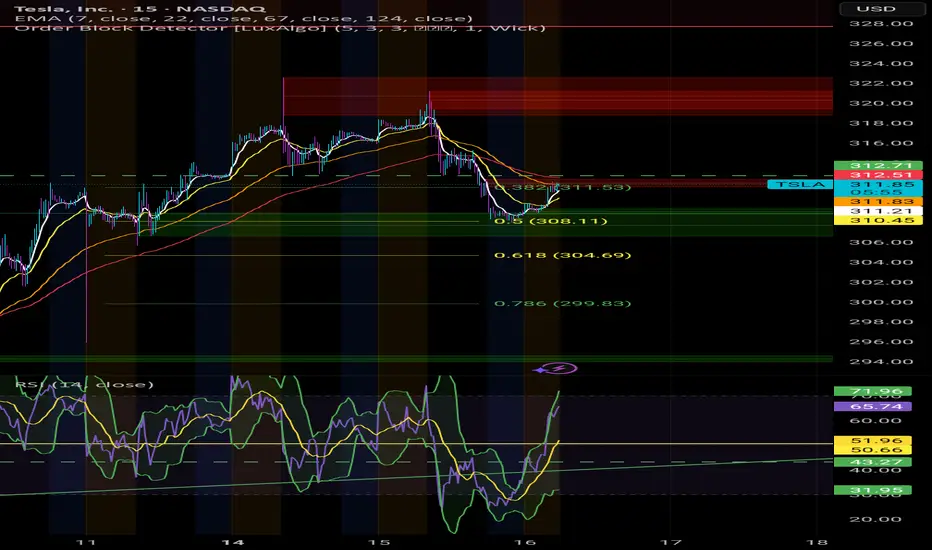
Is the BullRun over? I don't think so. $TSLAYesterday we saw a somewhat heavy fall in Indexes, and it probably scared alot of retail Bulls outs.
However, it seems we've fallen straight into potential medium term supports across multiple stocks in the markets.
I'm convinced we will get a good economic data print today.
This would open the door to new ATHs, again, in the Indexes.
For this to play out, the local bottoms established over night need to hold.
SPY (SP-500) - Rising WedgeYesterday we had a breakdown of the rising wedge on SPY. I draw out some important levels to look out for coming days/weeks. The trendline since april has also been broken. ICEUS:DXY is breaking out to which is increasing the risks for a "Risk off" scenario in tech stocks and crypto.
Nothing here should be interpreted as financial advise. Always do your own research and decisions.

NZDCHF → Pre-breakdown consolidation on a downtrendFX:NZDCHF is forming a pre-breakout consolidation amid a downtrend. Focus on support at 0.4759. Global and local trends are down...
On July 10-11, the currency pair attempted to break out of the trend. In the chart, it looks like a resistance breakout, but technically it was a short squeeze aimed at accumulating liquidity before the fall. We can see that the price quickly returned back and the market is testing the low from which the trap formation began. The risk zone for the market is 0.4759 - 0.475. In simple terms, this is a bull trap against the backdrop of a downtrend. The NZD has passed through the risk zone. At this time, the currency pair is forming a pre-breakout consolidation relative to the support level of 0.4759 with the aim of continuing its decline.
Support levels: 0.4759, 0.4753
Resistance levels: 0.477, 0.4782
A breakout of the 0.4759 level and consolidation in the sell zone could trigger a continuation of the decline within the main and local trends.
Best regards, R. Linda!

Bitcoin to 128kThere is a strong support between 113k to 115k for Bitcoin, as you see that is the 61% of the Fibonacci, and it is just the start for the rally.

BUY ETHUSDT 16.7.2025Confluence order: BUY at M15
Type of order: Limit order
Reason:
- M15~FIBO 0,5-0,618 (same position)
Note:
- Management of money carefully at the price of sub key M15 (3152)
Set up entry:
- Entry buy at 3137
- SL at 3127
- TP1: 3152
- TP2: 3164
Trading Method: Price action (No indicator, only trend and candles)

ETH - what next??Ethereum is perfectly touching a macro uptrend (5 touches acting as Support). Price has recently rallied but is currently pausing for breath. Could the uptrend begin to act as resistance? A break above this line would invalidate this thesis. Equally there is a huge resistance zone @ 3,550 - 4,100
And then there is the ATH
So there are a few hurdles in the way of printing a new ATH.
If Ethereum fails to break above the uptrend the fib retracement tool could take price to 1,900 (.618).
The next few days/weeks will give us an indication as to which direction we are headed.

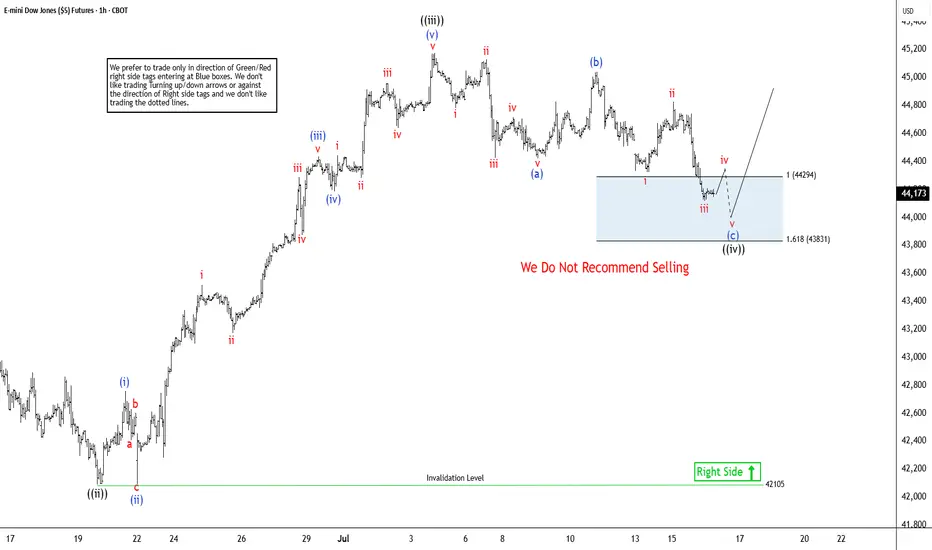
Dow Jones Futures (YM_F) Expects Rally From Extreme AreaThe Dow Jones E-mini Futures (YM_F) favors impulsive rally from 4.07.2025 low of 36708. It is trading close to the previous high of 1.31.2025 of 45227. A break above that level will confirm the bullish sequence. Other US indices like Nasdaq & S & P 500 futures already confirmed the new high in daily, calling for more upside against April-2025 low. As per latest Elliott wave sequence in Dow Jones, it favors upside & pullback in 1-hour remain supported in extreme area to rally higher. Since April-2025 low, it placed 1 at 42976 high & 2 at 41236 low. Above there, it favors upside in 3 of (1) & expect one more push higher, while dips remain above price trendline. We like to buy the pullback in 3, 7 or 11 swings at extreme area for next rally.
Within 3, it ended ((i)) at 43316 high, ((ii)) at 42088 low & ((iii)) at 45177 high. In wave ((iii)), it ended (i) at 42759 high, (ii) at 42096 low, (iii) at 44435 high, (iv) at 44185 low & (v) at 45177 high. Currently, it favors pullback in zigzag correction in ((iv)) & expect small downside in to 44286 – 43815 area before resume upside in ((v)) of 3. Within ((iv)), it placed (a) at 44482 low, which subdivides in 5 swings. It placed (b) at 45043 high in 3 swings bounce that almost corrects 90 % of (a). Currently, it favors downside in (c), which should unfold in 5 swings in to extreme area. Within (c), it placed i at 44324 low, ii at 44827 high & iii at 44118 low. It favors bounce in iv before final down in v to finish the (c) of ((iv)) against 6.19.2025 low before rally resumes towards 45500 or higher levels. In 4-hour, it expects two or more highs to finish the impulse sequence from April-2025 low before it may see bigger correction
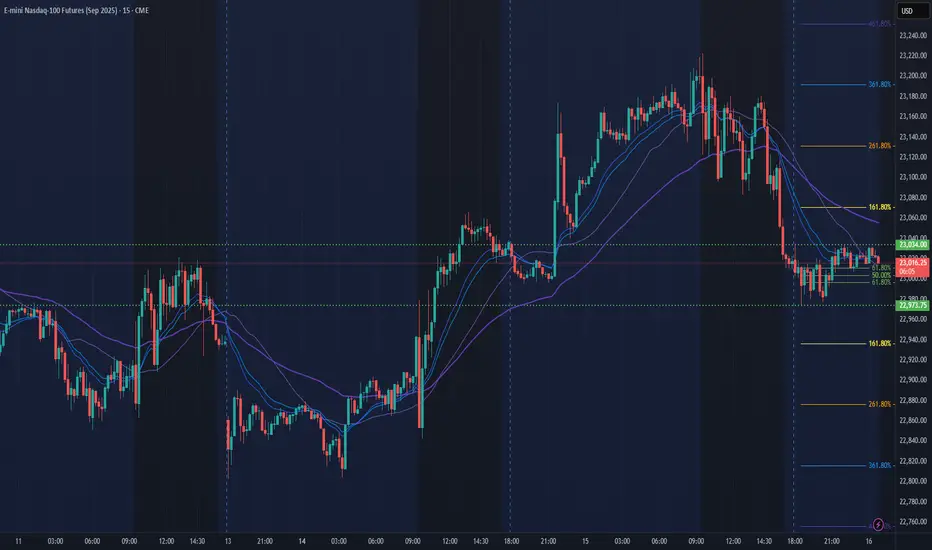
NQ Power Range Report with FIB Ext - 7/16/2025 SessionCME_MINI:NQU2025
- PR High: 23034.25
- PR Low: 22973.75
- NZ Spread: 135.5
Key scheduled economic events:
08:30 | PPI
10:30 | Crude Oil Inventories
AMP margins raised overnight for expected PPI volatility
Session Open Stats (As of 12:25 AM 7/16)
- Session Open ATR: 277.22
- Volume: 27K
- Open Int: 277K
- Trend Grade: Neutral
- From BA ATH: -0.8% (Rounded)
Key Levels (Rounded - Think of these as ranges)
- Long: 23239
- Mid: 21525
- Short: 20383
Keep in mind this is not speculation or a prediction. Only a report of the Power Range with Fib extensions for target hunting. Do your DD! You determine your risk tolerance. You are fully capable of making your own decisions.
BA: Back Adjusted
BuZ/BeZ: Bull Zone / Bear Zone
NZ: Neutral Zone
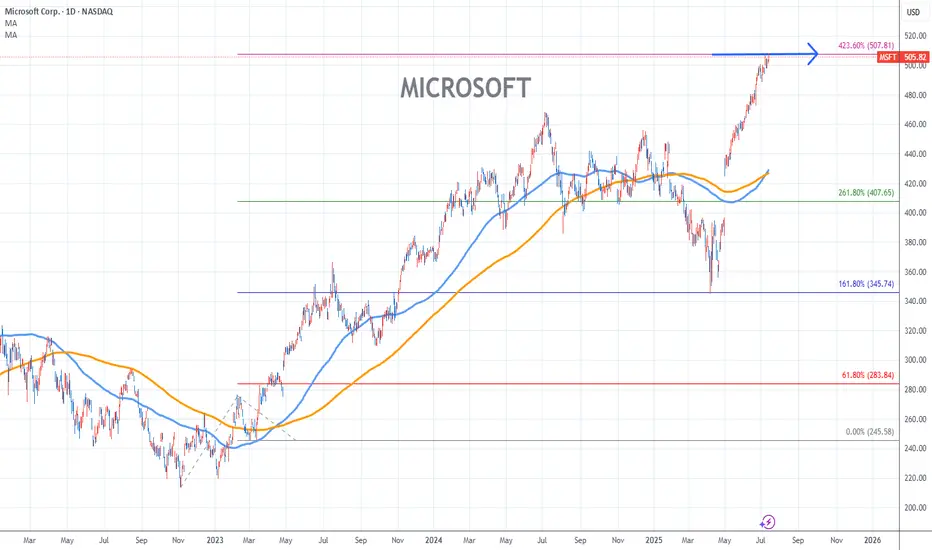
MICROSOFT Stock Chart Fibonacci Analysis 071525Trading idea - Hit the top > 507/423.60%
Chart time frame:D
A) 15 min(1W-3M)
B) 1 hr(3M-6M)
C) 4 hr(6M-1year)
D) 1 day(1-3years)
Stock progress:E
A) Keep rising over 61.80% resistance
B) 61.80% resistance
C) 61.80% support
D) Hit the bottom
E) Hit the top
Stocks rise as they rise from support and fall from resistance. Our goal is to find a low support point and enter. It can be referred to as buying at the pullback point. The pullback point can be found with a Fibonacci extension of 61.80%. This is a step to find entry level. 1) Find a triangle (Fibonacci Speed Fan Line) that connects the high (resistance) and low (support) points of the stock in progress, where it is continuously expressed as a Slingshot, 2) and create a Fibonacci extension level for the first rising wave from the start point of slingshot pattern.
When the current price goes over 61.80% level , that can be a good entry point, especially if the SMA 100 and 200 curves are gathered together at 61.80%, it is a very good entry point.
As a great help, tradingview provides these Fibonacci speed fan lines and extension levels with ease. So if you use the Fibonacci fan line, the extension level, and the SMA 100/200 curve well, you can find an entry point for the stock market. At least you have to enter at this low point to avoid trading failure, and if you are skilled at entering this low point, with fibonacci6180 technique, your reading skill to chart will be greatly improved.
If you want to do day trading, please set the time frame to 5 minutes or 15 minutes, and you will see many of the low point of rising stocks.
If want to prefer long term range trading, you can set the time frame to 1 hr or 1 day.
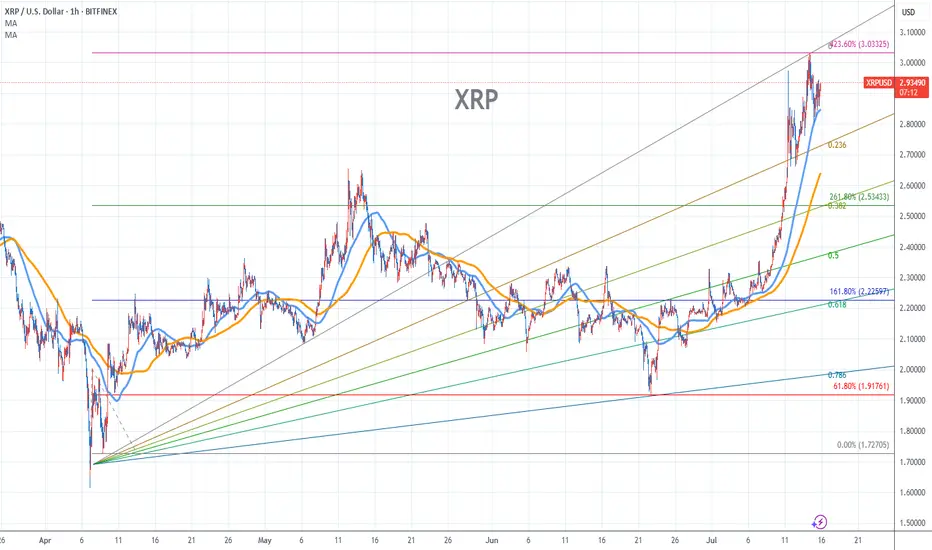
XRP Stock Chart Fibonacci Analysis 071525Trading idea - Hit the top - 3.03/423.60%
Chart time frame:B
A) 15 min(1W-3M)
B) 1 hr(3M-6M)
C) 4 hr(6M-1year)
D) 1 day(1-3years)
Stock progress:E
A) Keep rising over 61.80% resistance
B) 61.80% resistance
C) 61.80% support
D) Hit the bottom
E) Hit the top
Stocks rise as they rise from support and fall from resistance. Our goal is to find a low support point and enter. It can be referred to as buying at the pullback point. The pullback point can be found with a Fibonacci extension of 61.80%. This is a step to find entry level. 1) Find a triangle (Fibonacci Speed Fan Line) that connects the high (resistance) and low (support) points of the stock in progress, where it is continuously expressed as a Slingshot, 2) and create a Fibonacci extension level for the first rising wave from the start point of slingshot pattern.
When the current price goes over 61.80% level , that can be a good entry point, especially if the SMA 100 and 200 curves are gathered together at 61.80%, it is a very good entry point.
As a great help, tradingview provides these Fibonacci speed fan lines and extension levels with ease. So if you use the Fibonacci fan line, the extension level, and the SMA 100/200 curve well, you can find an entry point for the stock market. At least you have to enter at this low point to avoid trading failure, and if you are skilled at entering this low point, with fibonacci6180 technique, your reading skill to chart will be greatly improved.
If you want to do day trading, please set the time frame to 5 minutes or 15 minutes, and you will see many of the low point of rising stocks.
If want to prefer long term range trading, you can set the time frame to 1 hr or 1 day.
EURJPY ANALYSIS After seeing the previous daily candle close above key resistance of 172.500 ,we could see a retest of that support and a continuation to the upside

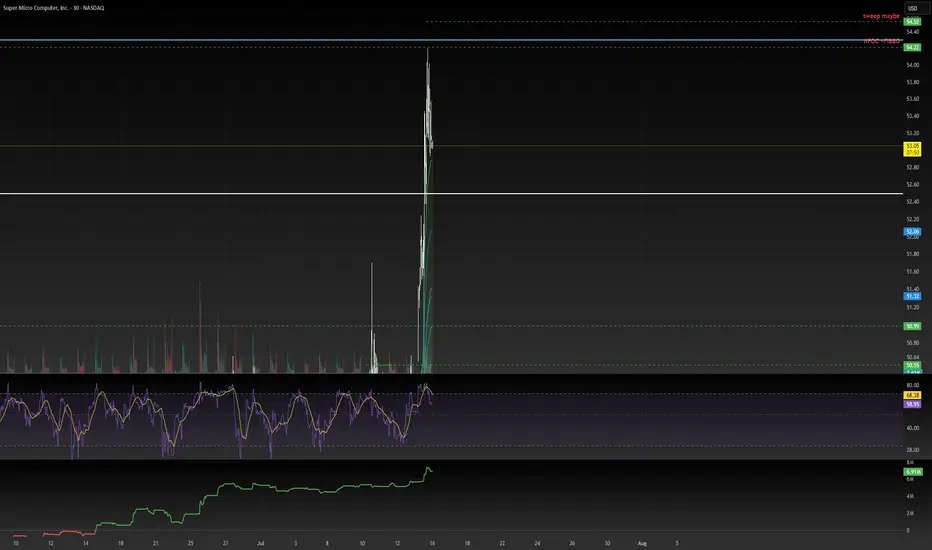
popcat long post trade📓 Trade Follow-Up — July 16 (Entry from Previous Session)
Timeframe:
Trading window is 10:00 p.m. to 12:00 a.m. (Vietnam time).
This session, I was on the charts for less than one hour.
⚙️ Trade Setup:
Trade idea was built during the New York open.
I didn’t execute the trade in real time because I hesitated.
Price moved without me, but I left a limit order at my pre-marked zone and went to sleep.
No chasing, no new setups added after market moved.
📈 Morning Outcome:
Woke up before 5:30 a.m.
The market had returned to the entry, nearly hit the stop loss, then turned.
I was in approximately +1% unrealized profit.
🧠 Morning Decision:
I had no pre-planned rule for what to do if I woke up and the trade was active.
Market was in Sydney session with about 90 minutes left in the trading day.
Tokyo session was approaching (~1 hour and 20 mins away).
I made a quick decision to close the trade:
Reason: setup originated during New York, no longer active session context.
I didn't want to micromanage outside my committed trading window.
During the short moment it took to decide, price pulled back slightly—final profit was just under 1%.
🧩 Notes:
I need to define pre-market and post-market rules:
What to do if a trade is active when I wake up?
Under what conditions do I manage or exit a trade outside my session?
Reaction was clean, no over-involvement or chasing.
Emotionally stable, but acknowledged mild excitement and urgency when waking up to a live position.

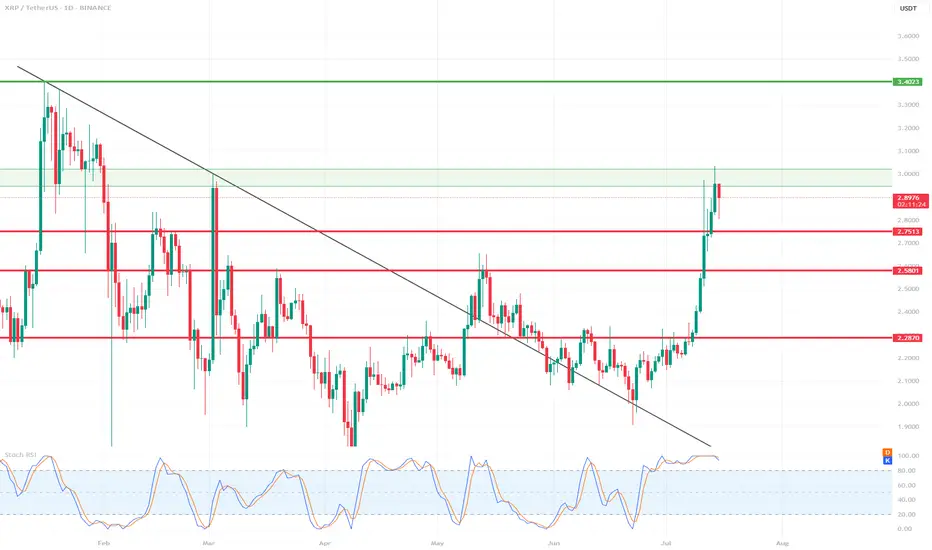
XRP 1D Chart Review📊 Support and Resistance Levels:
🔼 Resistance:
$2.95 - $3.02 – currently being tested, a local resistance zone. Price slightly rejected.
$3.40 – another strong resistance level from the previous high (visible on the left side of the chart).
🔽 Support:
$2.75 – the closest, recently broken support level.
$2.58 – another local support level.
$2.28–$2.30 – a very strong support zone that has been tested multiple times.
📈 Pattern and Momentum:
A breakout from a wedge-shaped downtrend with very high volume and long bullish candles indicates strong demand.
We are currently observing a correction/rejection at $3.02 – a possible short-term pullback.
🔄 Oscillator – Stochastic RSI:
The Stochastic RSI oscillator is in the overbought zone (near 100) – indicating possible consolidation or correction.
The curves are starting to curve downwards – a potential signal for a slight correction in the coming days.
🧠 Scenarios:
✅ Bullish (continued growth):
If the $2.95–$3.02 level is broken strongly and confirmed (e.g., by a daily candlestick closing above it), the target will be $3.40.
In this case, a quick rally to $3.40 is possible without major obstacles.
⚠️ Bearish (correction):
If the $3.02 zone holds as resistance, the price could retrace to $2.75 (the first local support).
If downward pressure persists, $2.58 could be tested.
📌 Summary:
XRP is in a strong uptrend after breaking out of long-term resistance.
In the short term, overbought prices on the Stoch RSI could trigger a correction to $2.75.
Key resistance: $3.02 – breaking it could signal further gains towards $3.40.
It's worth monitoring price reaction in this zone and candlestick confirmation.
EURUSD Wave Analysis – 15 July 2025- EURUSD broke daily up channel
- Likely to fall to support level 1.1470
EURUSD currency pair recently broke the support area located at the intersection of the support trendline of the daily up channel from May and the 38.2% Fibonacci correction of the upward impulse from June.
The breakout of this support area accelerated the active short-term ABC correction 4.
Given the strongly bullish US dollar sentiment coupled with significant euro pessimism seen today, EURUSD currency pair can be expected to fall further to the next support level 1.1470 (low of former wave iv).

Got filled at the bugattiMy hedge short is filled
continuation of my other chart
IF this is good the target it the!!....
key levels will be longed if data aligns.
#xauusd #elliottwave short sell setup wave 4 16Jul24This count is based on my assumptions so anything can happen not a trading or financial advice just for educational purposes only kindly do your own ta thanks trade with care good luck.
USD/CAD Coils Below Key ResistanceUSD/CAD has rallied nearly 1.3% off the monthly low with the advance now testing resistance at 1.3729/50- a region defined by the 38.2% retracement of the 2021 rally and the May opening-range lows. Note that pitchfork resistance converges on this threshold over the next few days and further highlights the technical significance of this key zone- looking for a reaction off this mark this week.
USD/CAD is trading within the confines of an embedded channel extending off the monthly low with the weekly opening range taking shape just below confluent resistance at 1.3729/50. Ultimately, a breach / close above the June high / 61.8% retracement of the December 2023 advance at 1.3795/98 is needed to suggest a more significant low was registered last month / a larger trend reversal is underway. Subsequent resistance seen at the 2022 high close / 2023 high at 1.3881/99 and the 2022 high / 2020 March weekly-reversal close at 1.3977/90- both levels of interest for possible topside exhaustion / price inflection IF reached.
Initial support rests with the weekly range lows at 1.3670- a break / close below the monthly channel would threaten resumption of the broader downtrend. Subsequent support objectives unchanged at the yearly low-day close (LDC) / May, June, July lows at 1.3571/90 and the Fibonacci confluence at 1.3504/23.
Bottom line: The USD/CAD is testing confluent resistance at the February downtrend with the weekly opening-range set just below- look for the breakout in the days ahead and watch the weekly close here. From a trading standpoint, losses would need to be limited to the weekly lows IF price is heading for a breakout on this stretch with a close above 1.3795 ultimately needed to put the bulls in control.
-MB

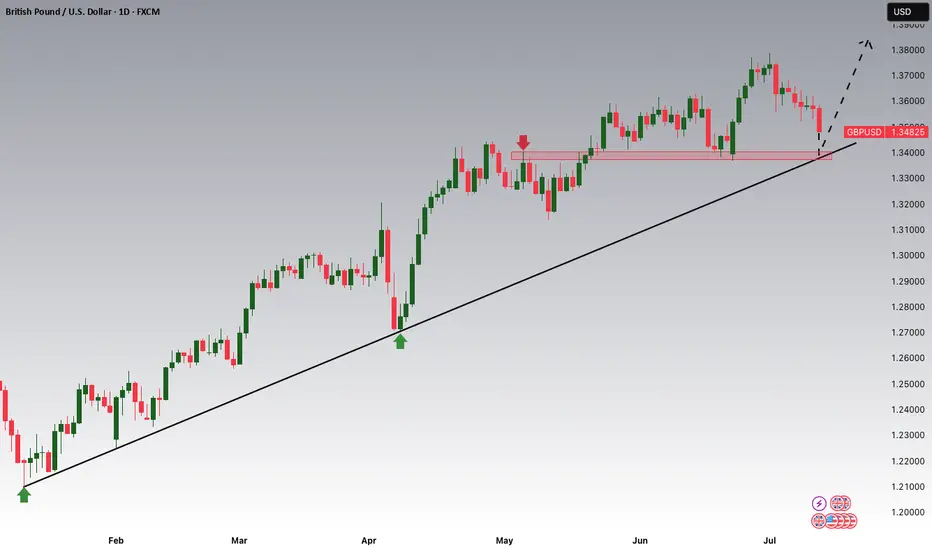
GBPUSD is Nearing the Daily Trend!!!Hey Traders, in tomorrow's trading session we are monitoring GBPUSD for a buying opportunity around 1.34100 zone, GBPUSD is trading in an uptrend and currently is in a correction phase in which it is approaching the trend at 1.34100 support and resistance area.
Trade safe, Joe.
EURUSD OUTLOOK 15 - 18 JULYCore CPI m/m came in light which gave a mixed signal at first but CPI y/y was higher than expected which eventually moved EU lower.
The last two analysis that I posted were more longer term focused so this time I will be giving a more short term outlook.
Currently the dollar is stronger based on the recent news that has been coming out and because of that I am still looking to short this pair keeping in mind that it is only the internal structure that is bearish and the swing structure is still bullish

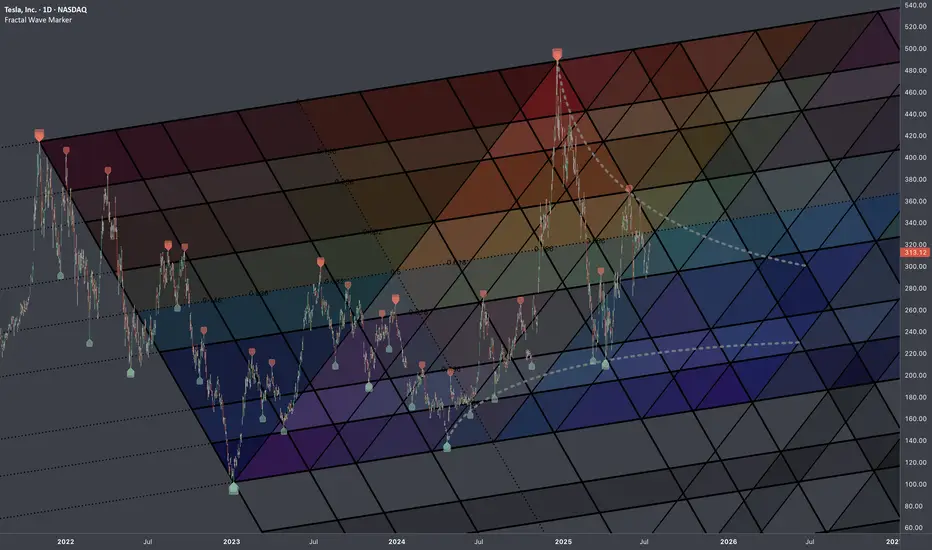
$TSLA: Fib InterconnectionsResearch Notes
Examining interconnection type with regressive angle:
Critical points:
Mapping with 3 fibonacci channels: