Fibonacci Arcs in Stock TradingFibonacci Arcs in Stock Trading
Fibonacci arcs, derived from the renowned Fibonacci sequence, offer a compelling blend of technical analysis and market psychology for traders. By mapping potential support and resistance areas through arcs drawn on stock charts, these tools provide insights into future price movements. This article delves into the practical applications of Fibonacci arcs in trading, their interplay with market psychology, and best practices for effective use.
Understanding Fibonacci Arcs
The Fibonacci arc indicator is a unique tool in technical analysis derived from the famed Fibonacci sequence. It’s crafted by drawing arcs at the key Fibonacci retracement levels - 38.2%, 50%, and 61.8% - from a high to a low point on a stock chart. Each curve represents potential support or resistance areas, offering insights into the stock’s future movements.
The art of arc reading, meaning interpreting these curves, is crucial for traders. When a stock approaches or intersects with an arc, it reflects a significant reaction level. For instance, if a stock price touches or nears an arc, it could face arc resistance, indicating a potential halt or reversal in its trend.
Applying Fibonacci Arcs in Trading
In the stock market, these arcs serve as a guide for traders seeking to anticipate future price movements. When applied correctly, they can provide critical insights into potential support and resistance levels. Here's a step-by-step look at how you may use them effectively:
- Identifying High and Low Points: Begin by selecting a significant high and low point on the stock's chart. In an uptrend, it’s the most recent swing high to a previous swing low, and vice versa. These are the anchor points.
- Drawing the Arcs: Once the points are selected, draw the arcs at the Fibonacci retracement levels of 38.2%, 50%, and 61.8%. They radiate from the chosen low point to the high point (or vice versa), cutting across the chart.
- Interpretation: Watch how the stock interacts with these lines. When the price approaches an arc, it might encounter resistance or support, signalling a potential change in trend or continuation.
- Timing Entries and Exits: Traders can use the arcs in the stock market as a tool to time their trading decisions. For instance, a bounce could be a signal to enter a trade, whereas the price breaking through might suggest it's time to exit.
Fibonacci Arcs and Market Psychology
The effectiveness of Fibonacci arcs in trading is deeply intertwined with market psychology. They tap into the collective mindset of traders, who often react predictably to certain price levels. The Fibonacci sequence, underlying this tool, is not just a mathematical concept but also a representation of natural patterns and human behaviour.
When a stock nears a curve, traders anticipate a reaction, often leading to a self-fulfilling prophecy. If many traders make an arc stock forecast, they might sell as the price approaches a certain point, causing the anticipated resistance to materialise. Similarly, seeing support at an arc can trigger buying, reinforcing the tool’s power.
This psychological aspect makes Fibonacci arcs more than just technical tools. They are reflections of the collective expectations and actions of market participants, turning abstract mathematical concepts into practical indicators of market sentiment and potential movements.
Best Practices
Incorporating Fibonacci arcs into trading strategies involves nuanced techniques for better accuracy and efficacy. Here are some best practices typically followed:
- Complementary Tools: Traders often pair this tool with other indicators like moving averages or RSI for a more robust analysis.
- Accurate Highs and Lows: It's best to carefully select the significant high and low points, as the effectiveness of the curves largely depends on these choices.
- Context Consideration: Understanding the broader market context is crucial. Traders usually use Fibonacci arcs in conjunction with fundamental factors to validate their analysis.
- Watch for Confluence: Identifying areas where Fibonacci levels converge with other technical signals can provide stronger trade setups.
- Practice Patience: Traders typically avoid making hasty decisions based solely on Fibonacci levels. It's usually better to wait to see additional confirmation from the price action.
Advantages and Limitations of Fibonacci Arcs
Fibonacci arcs are a popular tool in technical analysis, offering distinct advantages and some limitations in analysing stock movements. Understanding these can help traders leverage the tool more effectively.
Advantages
- Intuitive Nature: The Fibonacci sequence is a natural pattern, making the tool intuitive for traders to understand and apply.
- Dynamic Support and Resistance Levels: They provide dynamic levels of support and resistance, unlike static lines, adapting to changing market conditions.
- Versatility: Effective in various market conditions, the arcs can be used in both trending and sideways markets.
Limitations
- Subjectivity in Selection: The effectiveness largely depends on correctly identifying the significant high and low points, which can be subjective.
- Potential False Signals: Like all technical tools, they can generate false signals, especially in highly volatile markets.
- Requires Complementary Analysis: To maximise effectiveness, these curves are usually used alongside other technical indicators, as they are not infallible on their own.
The Bottom Line
Fibonacci arcs are invaluable tools in stock analysis, providing insights into market trends and potential price movements.
This article represents the opinion of the Companies operating under the FXOpen brand only. It is not to be construed as an offer, solicitation, or recommendation with respect to products and services provided by the Companies operating under the FXOpen brand, nor is it to be considered financial advice.
Fibonaccianalysis
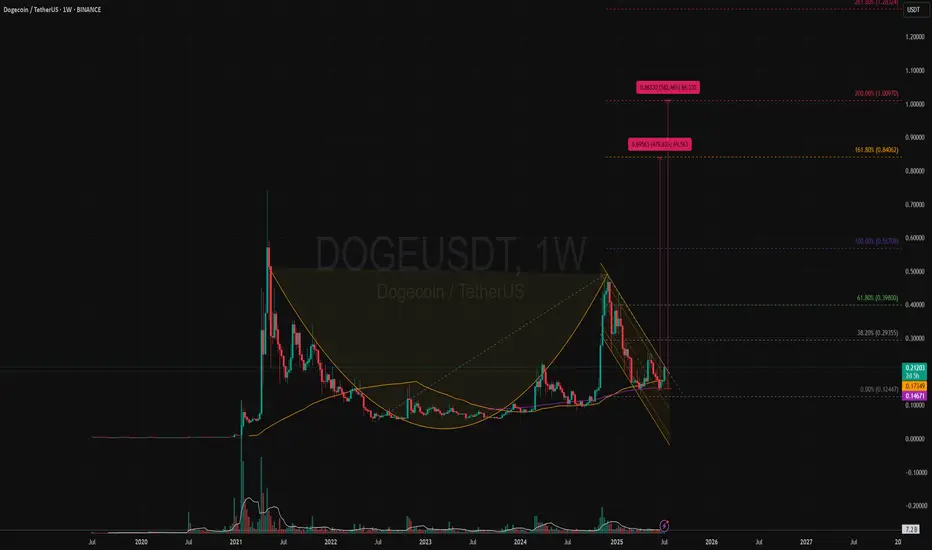
DOGEUSDT | Bullish Cup & Handle Revisiting Target +500% (1 USD)?Price Action and Chart Pattern Analysis:
DOGE cup bottom happened around $0.05 with the rim around $0.48. That gives a depth of roughly $0.42. If the breakout occurs near the rim, the measured move target would be $0.90 zone.
This aligns with several analyst projections suggesting DOGE could reach $0.90 to $1.00 if the breakout confirms.
Another way to project this cup & handle is the fibonacci-based target. These levels suggest that if DOGE breaks above the handle and sustains momentum, $0.85–$1.00 is a realistic zone for profit-taking at 161.8% and 200% extension as 1-2-3 wave pattern.
Reliability of the Cup and Handle Pattern for DOGE
The cup and handle is a classic bullish continuation pattern, but when applied to Dogecoin, its reliability depends on several dynamic factors:
Strengths of the Pattern in DOGE’s Context
Historical Accuracy: DOGE has previously respected technical patterns like rounded bottoms or (THE CUP) and breakout channels (THE HANDLE), especially during alt coin rallies.
Current Setup: a well-formed cup and handle on DOGE’s weekly chart, with price rebounding from $0.14 and testing resistance at $0.2 zone which also the key resistance SMA50W and the downtrend channel (the handle)
WATCH OUT: still a possible throw-under pattern or a final bear trap liquidity below previous low!
Key Action: If breakout confirmed with volume > Follow BUY | if not, wait for retraced SMA20 or breakout support.
Always trade with affordable risk and respect your stop...
EURUSD Potential UpsidesHey Traders, in today's trading session we are monitoring EURUSD for a buying opportunity around 1.16650 zone, EURUSD is trading in an uptrend and currently is in a correction phase in which it is approaching the trend at 1.16650 support and resistance area.
Trade safe, Joe.

The Kiss of Death Trade & Other Reasons for EntryFollowing up on the 2618 opportunity that we looked at on the FOREXCOM:GER40 this past weekend the market has now created more potential trading opportunities to get involved.
1) A bullish bat pattern that has completed due to a result of a complex pullback into the original double bottom.
2) A potential Kiss of Death trading opportunity
3) A bigger potential bullish gartley pattern IF the current 2618 opportunity is violated.
Please leave any questions or comments below & feel free to share your opinion on the setup.
Akil

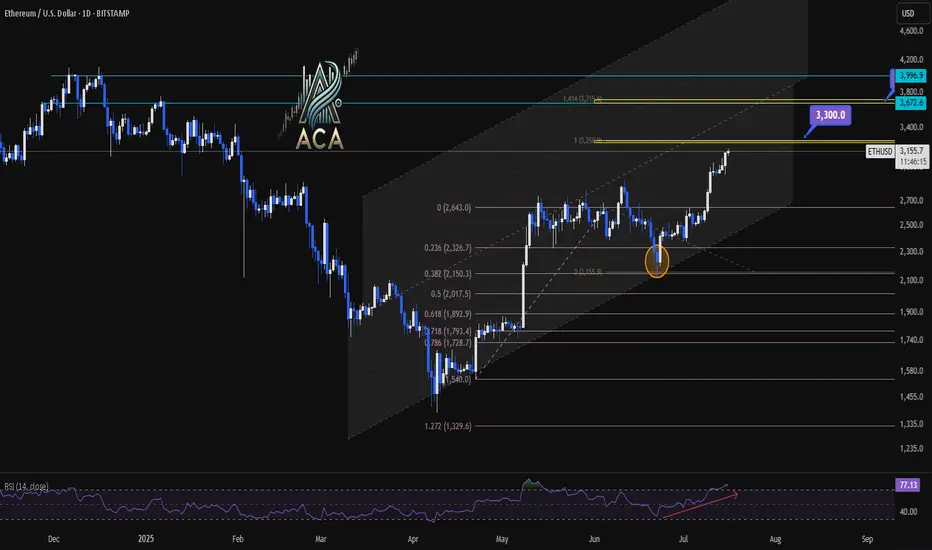
ETHUSDT 1D Chart Analysis | RSI Strength & Fibonacci TargetsETHUSDT 4H Chart Analysis | RSI Strength & Fibonacci Targets in Play
🔍 Let’s break down the latest ETH/USDT setup — bullish momentum is building with confluences pointing toward key upside targets.
⏳ 4-Hour Overview
Ether continues climbing within a well-defined ascending channel, with recent candles holding above mid-level support. Price is pressing higher from a clean bounce at the 0.5 and 0.618 Fibonacci retracement zone ($2,017–$1,899), signaling the correction has likely ended.
📉 Fibonacci Levels & RSI Confirmation
- The strong recovery aligns with rising volume and a bullish structure.
- RSI is pushing into overbought territory (above 73), often a sign of strength during trends—not exhaustion.
- ETH is now positioned for a breakout continuation move if momentum holds.
🎯 Bullish Targets Ahead
- Immediate resistance: $3,300 (1.414 Fib extension + historical supply)
- Next major target: $3,700 (1.618 extension + upper channel confluence)
- Pullback zones: $2,950 (mid-channel) and $2,017 (Fib support base)
📊 Key Highlights:
- Price is respecting the rising channel structure — higher lows, higher highs in play.
- Volume supports the breakout narrative, rising on green candles.
- RSI breakout supports trend continuation, not exhaustion.
- Targets at $3,300 and $3,700 remain actionable on a confirmed breakout.
🚨 Conclusion:
ETH is showing a multi-variable bullish setup with clear continuation potential. A strong move above $3,300 could quickly send price toward $3,700. Pullbacks to $2,950–$2,017 could offer high-risk/reward re-entry zones. Momentum favors bulls — stay alert.
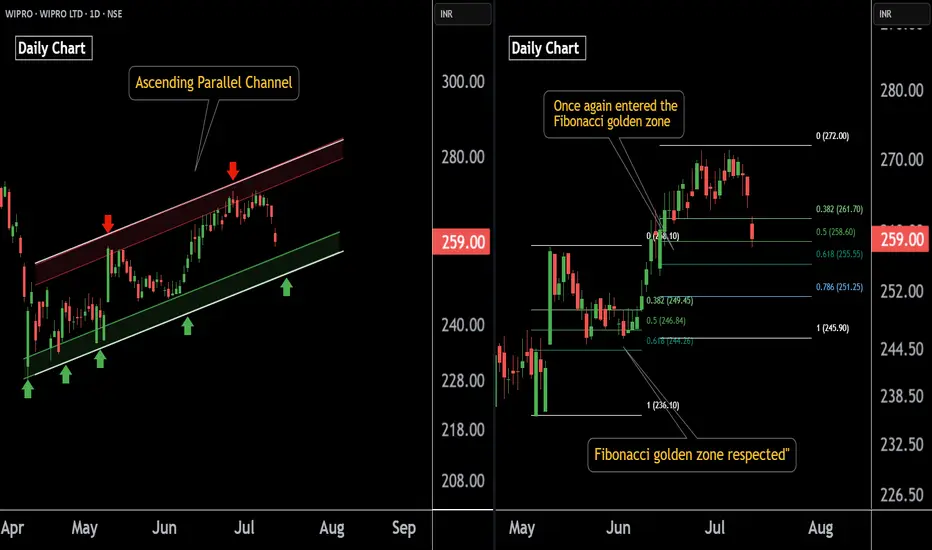
Wipro AT Best Support Zone These are two daily timeframe charts of Wipro .
In the first chart : Wipro is trading within an ascending parallel channel, with the lower boundary positioned around the ₹251–₹254 zone.
Wipro has previously respected the Fibonacci golden zone, and the stock is once again approaching this key retracement area. A potential bounce from this zone is likely if the level is respected again around 254 near .
If this level is sustain , then we may see higher Prices in Wipro.
Thank You !!
XAUUSD analysis - potential for pullback and continuationOANDA:XAUUSD is currently consolidating near $3,310 after a decisive breakdown below the ascending trendline, signaling a shift in the short-term structure from bullish to bearish. This breakdown was accompanied by strong bearish momentum, indicating that buyers have temporarily lost control of the market.
After the initial drop, the price is now attempting to retrace toward the 0.5–0.618 Fibonacci zone, with the 0.618 level located around $3,335. This zone also coincides with dynamic resistance from short-term moving averages (EMA cluster), making it an important confluence area. A rejection from this level would confirm a bearish retest, supporting the idea of a continuation toward the 1.618 Fibonacci extension near the $3,225 level.
However, if the price breaks and holds above $3,348, the bearish scenario will be invalidated, potentially signaling that buyers are regaining strength and may aim to reclaim higher resistance levels.
Traders are advised to wait for confirmation, such as a bearish engulfing candle, rejection wicks, or a surge in volume, before entering short positions. As always, this is a personal viewpoint, not financial advice. Trade with appropriate risk management.

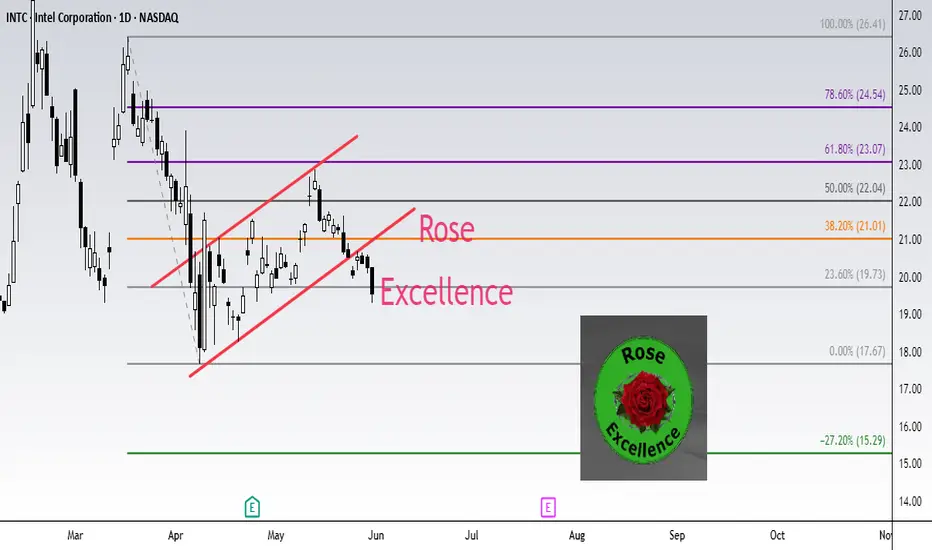
INTEL INTC Short setup target 15.29Fibonacci technical analysis : Intel Corporation NASDAQ:INTC has already found resistance at the Fib level 61.8% (23.07) of my Down Fib. The May 30th Daily candle has closed below retracement Fib level 23.6% (19.73), confirming a sell signal. A Bear Flag pattern has also formed. My Down Fib guides me to look for NASDAQ:INTC to eventually go down to hit first target at Fib level -27.2% (15.29).
NASDAQ:INTC – Target 1 at -27.2% (15.29), Target 2 at -61.8% (12.26) and Target 3 at -78.6 (10.79)
Stop loss slightly above the 50.0% retracement Fib level (22.04).
Enjoy the trading process and take time to smell the roses🌹
S&P ES Long setup target 5963.50 / Calls SPY target 596Fibonacci technical analysis : S&P 500 E-mini Futures CME_MINI:ES1! has already found support at the Fib level 78.6% (5623.50) of my Down Fib. Last Daily candle (May 2) has closed above retracement Fib level 78.6%. My Down Fib guides me to look for CME_MINI:ES1! to eventually go up to hit first target at Fib level 127.2% (5963.50).
CME_MINI:ES1! – Target 1 at 127.2% (5963.50), Target 2 at 161.8% (6205.50) and Target 3 at 178.6 (6322.75)
Stop loss slightly below the 61.8% retracement Fib level (5506.25).
Option Traders : My AMEX:SPY chart Down Fib shows price to go up to Target 1 at 127.2% (595.82), Target 2 at 161.8% (620.50) and Target 3 at 178.6 (632.50)
Stop loss slightly below the 61.8% retracement Fib level (549).
Enjoy the trading process and take time to smell the roses🌹

Equity Research Report – Polycab India Ltd.✅ Buy Levels
Buy Above: ₹5,800 (post breakout confirmation)
Ideal Entry on Dip: ₹5,765–₹5,785
🎯 Targets
Timeframe Target 1 Target 2 Target 3
15-min ₹5,870 ₹5,950 ₹6,070
1-hour ₹6,070 ₹6,220 ₹6,427 (Fib 61.8%)
🔻 Stop Loss
Intraday SL: ₹5,720
Positional SL: ₹5,650 (below trendline support and 20 EMA)
For Education purposes only

I started this analyses Aug 2022. Now I think HEY can grow to 60After the price breaks € 40, the way is open to grow to € 60.
Ofcourse, with ups and downs in between. Never a straight line.
I strarted my analyses August 2022 and since then, I had almost every movement right.
I advise to work with options on this beside stocks.

AERGO: Golden Pocket Hit – Crash Incoming?On April 3rd, AERGO hit a historic low of $0.04746—and just 13 days later, it's trading around $0.60, an astonishing +1500% surge in less than two weeks. The rapid rise begs the question: What are the bulls aiming for next, and how sustainable is this move?
Key Observations:
Explosive Rally:
AERGO’s meteoric move from $0.04746 to $0.70 in just 13 days has propelled the coin into uncharted territory. Such a dramatic spike is not only eye-catching but also raises concerns about overextension.
RSI Overbought:
The daily RSI sits at 98, indicating extreme overbought conditions. This level suggests that the current rally is unsustainable and may be ripe for a pullback.
Historical Resistance Levels:
Looking back at 2021, key highs were established around $0.60 to $0.62. These levels serve as critical resistance zones.
Fibonacci Confluence:
Taking the Fibonacci retracement from the low at $0.04746 to the previous rally's high at $1.0809 (April 13, 2024), the 0.618 level is projected at $0.68613. The bulls just tested that golden pocket.
Trade Strategy & Potential Setups:
For Longs:
With the market showing signs of being overbought (RSI at 98) and the explosive move possibly winding down, this may be the perfect opportunity to take profits rather than accumulate further.
Take Profit Consideration:
Target: Near the 0.618 fib retracement at $0.68613.
Observation: If bulls push beyond this level, the move might extend — however, the risk of a sharp pullback is high given current overbought conditions.
For Shorts:
A corrective move is very much on the table, and traders looking to short should focus on the key resistance zone between $0.60 and $0.70.
Short Setup:
Entry: Look to initiate shorts near the $0.60–$0.70 zone.
Target: $0.4 and $0.2 as take profit targets
The Big Question:
Will AERGO drop as sharply as it surged? Given the extreme overbought conditions and the rapid, unsustainable spike, a healthy—and perhaps brutal—correction seems very possible. Keep a close eye on volume and price action near the $0.60–$0.70 resistance zone and be ready to adjust positions accordingly.
Anyone riding this wave has experienced one of the wildest moves in recent memory. For those in long positions, consider taking profits now; for potential short traders, watch those key levels tightly. The market's rhythm will soon reveal its next chapter.

IT IS NOT TRADING CALLS!! IT IS TRADING ANALYSIS ONLYThis Trading Analysis is based on Elliot Wave Analysis combined with Fibonacci Ratios. The EW is to project the price direction/movement in the future while the Fibonacci Ratios is used for measuring the target price whether as Support or Resistance. Hope everyone can enjoy my analysis. THANK YOU.

Bitcoin Analysis: Potential Path to $150K and Market TrendsCurrent Price & Key Levels
- BTC/USDT Price: BINANCE:BTCUSDT (as per chart).
- Critical Support: Bottom of the ascending channel .
- Key Resistance: Upper trendline of the channel (to be confirmed).
Technical Signals
1. Ascending Channel:
- Price is at the bottom of the channel, historically a bounce zone.
- A break above the upper trendline could signal a bullish continuation.
2. Moving Averages:
- SMA 200 (4H) and SMA 20 (1D) are critical for trend confirmation.
- A bullish crossover (e.g., SMA 20 > SMA 200) would strengthen the buy signal.
3. Dominance (BTC.D):
- If Bitcoin dominance turns bearish, expect capital rotation into altcoins (altseason potential).
- Monitor dominance alongside price action for market shifts.
$150K Target: When and How?
- Scenario 1:
- A strong breakout from the ascending channel + rising volume → Acceleration toward $150K.
- Timeline:Mid-2025/Late-2025 (historically aligns with post-halving cycles).
- Scenario 2:
- Slow grind upward with corrections → $150K likely by 2026, pending macroeconomic stability (e.g., ETF inflows, regulatory clarity).
Altcoin Season Watch
- Trigger:
- If Bitcoin’s dominance drops below 57%, altcoins may surge.
- Focus on high-cap alts (ETH, SOL) and narratives like AI, DePIN, or RWA.
Trade Strategy
- Entry:
- Buy on confirmed breakout above the channel + SMA crossover.
- Stop Loss:
- Below the channel’s lower trendline (e.g., $80,000).
- Take Profit:
- targets: $100,000.120,000
- Final target: $150,000 (scale out profits).
Risks to Monitor
- Macro Factors: Fed rate decisions, geopolitical tensions.
- Bitcoin ETF Flows: Sustained inflows/outflows impact momentum.
- Regulation: Crackdowns or approvals (e.g., ETH ETF).
---
Conclusion
- Bullish Outlook: $150K is achievable if Bitcoin holds the ascending channel and dominance remains stable.
- Altseason Hedge: Prepare a basket of altcoins if BTC.D trends downward.
Like, comment, and follow for updates! 🚀

SHIBA World (Update)Hi every one , maybe we change fibo level :) The Robinhood page for SHIB displays the price next to a 'Buy Shiba Inu (SHIB)' widget. It also prompts users to sign up to buy SHIB. The site states: "Sign up for a Robinhood Crypto Account to buy or sell Shiba Inu commission-free."

Possible Downtrend for IDX Composite Back to 6000A deep analysis found that we may experience a possible downward movement for IDX Composite Back to 6000 that peaked around March 5, 2025

Plan GOLD 06/03/2025Today the market has no outstanding news, and is waiting for NonFarm news tomorrow
so today is likely to be a sideways range in the area from 2900-2925
Hope you get good buy sell prices in this range
SELL: price range 2925-2930
SL: 2935
TP: 2900
BUY: price range 2890-2900
SL: 2895

Best Fibonacci Retracement and Extension Levels for Trading
In this short article, you will learn the best Fibonacci extension and retracement levels for trading Forex and Gold.
I will share with you correct settings for Fibonacci tools and show you how to use & draw Fibonacci's properly on TradingView.
Best Fibonacci Retracement Levels
First, let's discuss Fibonacci retracement levels.
Here are the default settings for Fibonacci retracement tool on TradingView.
We will need to modify that a bit.
We should keep 0; 0,382; 0,5; 0,618; 0,786; 1 levels
0,382; 0,5; 0,618; 0,786 will be the best retracement levels for Forex & Gold trading.
How to Draw Fibonacci Retracement Levels Properly
In order to draw fib.retracement levels properly, you should correctly identify a price action leg.
You should underline that from its lowest low to its highest high, taking into consideration the wicks of the candlesticks.
Fibonacci Retracement of a bullish price action leg will be applied from its low to its high.
1.0 Fibonacci level should lie on the lowest lie, 0 - on the highest high.
Fibonacci Retracement of a bearish price action leg will be applied from its high to its low.
Best Fibonacci Extension Levels
Above, you can find default Fib.extension settings on TradingView.
We will need to remove all the retracement levels; 2,618; 3,618; 4,236 and add 1,272; 1,414 levels.
1,272; 1,414; 1,618 will be the best Fibonacci Extension levels for trading Gold and Forex.
How to Draw Fibonacci Extension Levels Properly
Start with correct identification of a price action leg.
Draw the Fib.Extension levels of a bearish price movement from its high to its low .
Draw the Fib.Extension levels of a bullish price movement from its low to its high.
I apply the fibonacci levels that we discussed for more than 9 years.
They proved its efficiency and strength in trading different financial markets. Learn to combine Fibonacci levels with other technical analysis tools to make nice money in trading.
❤️Please, support my work with like, thank you!❤️

Gold/USD Monthly Elliott Wave & Fibonacci ProjectionsPEPPERSTONE:XAUUSD
This analysis presents a detailed Elliott Wave count on the monthly chart of Gold/USD with Fibonacci extension levels for key price targets.
Wave Structure:
The chart follows a classical 5-wave impulse structure (I to V).
Wave V is currently forming with possible subwave developments marked (1, 2, 3, 4, 5).
Fibonacci Key Levels:
100% ($2,529) — initial projection target
127.2% ($2,778) — intermediate resistance
161.8% ($3,095) — dominant bullish extension target
261.8% ($3,019) — extended bullish zone
Potential Price Movement:
A correction near $2,550 aligns with the Fibonacci 161.8% retracement, followed by a rally to complete wave V.
Long-term resistance and liquidity zones highlighted around $3,095.
Use this projection for long-term trading strategies. Fibonacci and wave alignments may guide stop-loss placements or profit-taking points. Keep an eye on corrections near wave 4 zones for confirmation before further bullish continuation
Disclaimer:
This analysis is for informational and educational purposes only. It does not constitute financial advice, investment recommendations, or a solicitation to trade any securities or assets. Trading in financial markets involves substantial risk and may not be suitable for all investors. Past performance is not indicative of future results. Always conduct your own research and consult with a certified financial advisor before making trading decisions.

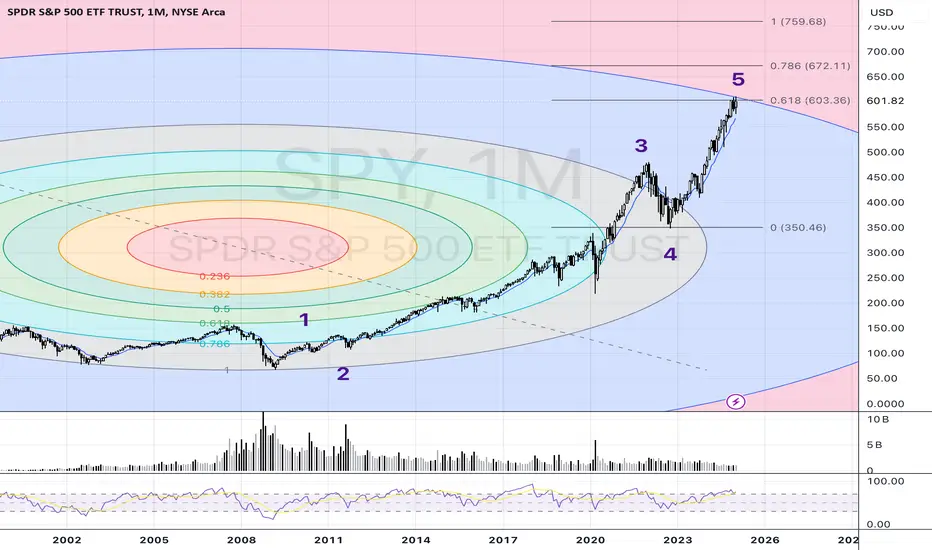
SPY | The End of a 16-Year Bull Cycle? Major Correction Ahead?🔎 Overview:
The S&P 500 ETF (SPY) has been in a massive bull run since the 2009 bottom, forming a clear 5-wave structure based on Elliott Wave Theory. Now, the market is showing multiple top signals, suggesting that a major correction may be imminent.
📉 Key Warning Signs:
1️⃣ 5-Wave Completion:
The 5th wave is approaching a key Fibonacci extension level (0.618 of Waves 1-3), a common reversal zone for extended moves.
The previous wave count has been respected perfectly, reinforcing this structure.
2️⃣ Fibonacci Circles Alignment:
Price is reaching the outermost Fibonacci arc, a historically significant zone where reversals have occurred.
The market has reacted strongly in previous arcs, indicating this could be another turning point.
3️⃣ RSI Bearish Divergence:
The Relative Strength Index (RSI) is making lower highs while price is making higher highs—a classic bearish divergence signal.
Previous similar divergences led to major corrections, including 2000, 2008, and 2021 dips.
4️⃣ Overextended Market Conditions:
Volume is declining despite new highs, signaling weak buying pressure.
Sentiment is euphoric, typically a late-stage bull market characteristic.
📊 Possible Scenarios:
🟢 Bullish Case: If SPY breaks and sustains above the 0.786 Fibonacci level (~672), we could see an extension.
🔴 Bearish Case: A break below 600 and a weekly close under 575 would confirm the start of a major correction back to the 350-400 zone (previous wave 4 region).
🚨 Final Thoughts:
The technical evidence suggests that SPY is in a late-stage bull cycle, and the risk of a major pullback is high. While timing exact tops is difficult, long-term investors should be cautious, and traders may want to start looking at hedging strategies or taking partial profits.
📢 What’s your take? Are we near a major top, or is there more upside left? Drop your thoughts in the comments! 👇
#SPY #SP500 #StockMarket #ElliottWave #Fibonacci #RSI #BearishDivergence #Trading #Investing 🚀📉

ETHUSDAlthough Monthly Long term trend is 5538 at this moment,
with the current down trend, ETHUSD will test 489.34 USD

EGLD (MultiverseX) - AltSeason Cycle - Bull RunBINANCE:EGLDUSD (#MultiverseX) is ready to jump.
That's because the #AltSeason shall push #AltCoins to the limits.
Its Market Cap ( CRYPTOCAP:EGLD ) is very low now and about to grow significantly.
This will be the result of #Crypto #MarketCap ( CRYPTOCAP:TOTAL3 & CRYPTOCAP:OTHERS ) breaking through their #ATH.
With #BitcoinDominance ( CRYPTOCAP:BTC.D ) showing signs of #Correction, #eGold should prevail.
What Happened with BINANCE:EGLDUSDT ?
#EGLD managed to spike a bit in the end of '23, thus confirming the start of a larger #Bullish #Cycle.
#Correction is also complete (Q4 in '24), which leaves room for the Bull.
What's next for BINANCE:EGLDUSD ?
An Impressive Rise is expected for $EGLD.
The current levels are to be watched closely by #Traders going #Long.
#MultiverseX #TechnicalAnalysis
- #ElliottWave A-B-C Sequence: Confirmed
- Intermediate (A) & (B) (white): Complete
- #Bullish #Fractal: Commenced
- #Fibonacci Levels: Conditions Met
My BINANCE:EGLDUSDT #Long Levels
#HODL #Trade:
- Entry @ 31.00 USD (or below)
- TP @ 420.00 USD
#Futures #Trading:
- Entry @ 31.00 USD (or below)
- SL @ 10.00 USD
- TP @ 225.00 USD
