TBT Ultrashort Treasuries Ready to ReverseFrom the chart, the uptrend from the market top November 2021 peaked and reversed from
a double top. Now on the downtrend , it has hit the Fib 0.5 level of the retracement.
I look for a reversal to the upside now as that Fib level is tested and holding.
I will play this with some call option contracts with an expiration in 4 weeks.
Fibonaccianalysis

bnbnot looking good TBH.
618% retracement level from 2020 covid crash to 2021 bull market top is $37.
All the news lately makes this coin look like LUNA did B4 the grand finale IMO.

BNB / USDT 1D INTERVAL, Support and ResistanceI invite you to view the BNB chart on a one-day interval. In this situation, we can mark a sideways trend channel where we are approaching the lower part of the channel, after the huge increases in 2021. We are in a downtrend locally.
Let's check with the Fib Retracement tool what resistance we should consider in the coming days or weeks. First, the price has to overcome the upper level of $298.5 only then we will be able to move towards the resistance zone from $372 to $430.
However, when it comes to support, we are currently in the support zone, which lasts from $ 266 to $ 230, in a situation where the designated zone does not hold the price, we can fall to around $ 183.5, which is the lower limit of our channel. On the other hand, a lower exit from the channel can mean a huge drop even to around $50.
As you can see on the CHOP index, the energy has been used, also on the RSI we see that we are in a place where the price often changed its direction. However, here it is necessary to observe the behavior of BTC in a situation of very large drops will entail the entire market.
However, it is worth remembering about the constantly appearing negative information related to the Binance exchange, which may negatively affect the BNB price.

SPXThinking the 5th on the expanding diagonal finishes around 3,330 but if not then diagonal likely invalid and 2900-3,000 will hold as massive support.

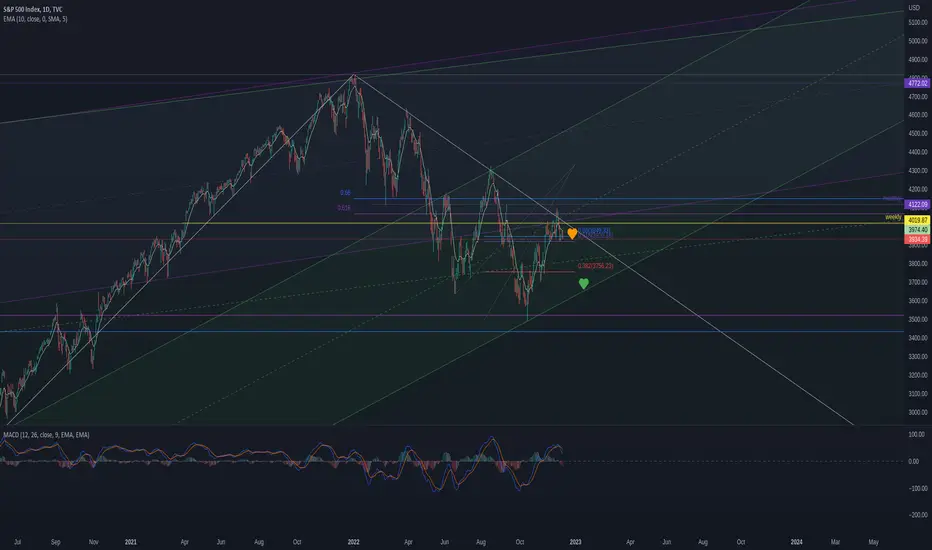
S&P500 – TRADES | KW47 | INTRADAYIn today's post I present relevant marks of the S&P500 for the next week, which could support the one or the other, in their own analysis.
= since it is a very short-term time frame, I will not comment further.
= the technical analysis approaches, are shown in individual pictures in the contribution. So that an individual interpretation of the respective - standing alone - is possible.
= the title picture shows an example, of a possible trade. This is one of many possible setups, because the current course is not able to take a clear direction.
The following methods are used and shown in the following:
- SUPPLY&DEMAND ZONES
- FIBONACCI LEVEL
- POINTS OF INTEREST
- TREND LINES
SUPPLY & DEMAND ZONES
„4 hour + 1 day – time window“
„1 hour – time window“
„1-4 hour + 1 day – time window“
FIBONACCI LEVEL
„Intraday - time window“
„Day - time window“
POINTS OF INTEREST
„4 hour - time window“
TRENDLINES
„Intraday - time window“
„Day - time window“
RAW VERSION WITHOUT DRAWINGS
„4 hour - time window“
„1 hour - time window“
> Feel free to discuss this in the comments and share our perspectives, I'd be "burning" to hear your take on this.
If this idea and explanation has added value to you, I would be very happy to receive a review of it.
Thank you and happy trading!

DXY – TRADES | MTF ANALYSE | KW48In today's post I present relevant marks of the DXY for the next week, which could support the one or the other, in their own analysis.
= the technical analysis approaches, are shown in individual images in the post. So that an individual interpretation of the respective - standing alone - is possible.
= the title picture shows an example, of a possible trade. This is one of many possible setups because the current course isn`t able to take a clear direction.
PERSONAL ASSESSMENT
If you look at the price in the higher time frames, you can quickly see that "without" another correction, we have been in free fall.
Thus, an intermediate correction in the smaller time frames is long overdue and could possibly await us next week, with a rising USD / DXY.
This just announces itself with a MACD divergence, in the small-time units. This does not mean that the price must immediately react to it, however, over the next few days after a possible small sell-off, the whole thing can run in the opposite direction.
Why this is so, I explain to you in the following.
MARKET MAKERS MOVE THE PRICE .
The DXY has been in correction for 2-months and many market participants assume a further USD value decline.
And exactly there is the existing problem,
-> "many market participants" are on the USD short side.
If you look a little bit into the TRADING of the HEDGE funds and banks, you will quickly come to the conclusion that without their participation, the market will not move.
1. from the moment the price moves permanently in one direction, it is no longer interesting for large investors.
2. their opportunities to make money are very small, which is why they have to reverse the market direction or initiate a consolidation.
This in turn is due to the following reasons:
- The position sizes of these investors are too large to be executed in a normal market environment.
- For this reason, you can e.g. only build LONG positions if enough investors sell to you = go SHORT.
- Thus, when the market falls, they can build a LONG position piece by piece, without having a "visible" influence on the market.
Then, when you decide that their position size has been successfully filled, let the price go in the opposite direction.
- During the e.g. upward movement, profits are then taken piece by piece where liquidity is highest so that the market does not break away again after these profit-takings.
So that you are prepared for both scenarios (LONG / SHORT), I have carried out the analysis combined with the different time units (monthly, weekly, daily and INTRA-Day) and in the following with chart images.
The following methods are used and shown below:
- MULTI TIME FRAME ANALYSIS
- TREND LINES + TREND CHANNELS
- SUPPLY&DEMAND ZONES
- FIBONACCI LEVEL
- MACD
MONTHLY TIME FRAME
WEEKLY WINDOW
DAY WINDOW
INNER DAY TIME WINDOW
4h + LONG
4h + SHORT
1h
4h Divergence - MACD - Intraday
> Feel free to discuss this in the comments and share our perspectives, I would be "burning" to hear your take on the whole thing.
If this idea and explanation has added value to you, I would be very happy to receive a review of it.
Thank you and happy trading!

A Quick Short for GBPJPYGBPJPY is looking to mitigated a supply area in near 168.9xx and I expect the priced will react to at least fibo 50.

MATIC / USDT 1D chart Resistance and SupportHello everyone, welcome to the USDT MATIC chart review. As we can see, the price has broken out of the downtrend line and now we can mark the uptrend channel in which the price is moving with the blue lines.
Now let's move on to determining the support for the price and here we see that we first have a strong support zone from $0.82 to $0.70, if the price falls below the designated zone, we can see a drop to around $0.53 and a delta to $0.32.
Looking the other way, we see that we have the first resistance at $0.94, if the price goes up, then we have a strong resistance zone from $1.32 to $1.64, only when the price breaks this zone and tests it positively, we will be able to see further increases.
Please look at the CHOP index which indicates that we have a lot of energy which, when BTC is falling, can be used for a large correction, the MACD indicator indicates that we are on the verge of entering a downtrend, while looking at the RSI it is difficult to clearly determine the direction.

SOL - USDT 1daycahrtHello, I invite you to review the SOLANA chart in pair to USDT, let's start by marking with blue lines the triangle in which the price was moving, as you can see, it managed to go down.
Currently, the price has approached the resistance at $14.91, however, we see a small price retracement, however, if the resistance is overcome, then the price will have to fight the strong resistance zone from $15.86 to $17.19. Only when it manages to exit this zone at the top and then positively test it, the price will be able to go further up.
However, if we see a change in direction and the price starts to fall, we can see with the Fib Retracement tool that we first have a strong support zone from $14.02 to $13.44. If the zone does not hold the price, we have another support at the price of $ 12.96, and then at the price of $ 12.48.
It is worth noting that on the one-day timeframe we still have a lot of energy for the next move, and on the RSI we have a lot of room for further price increase. However, it should be remembered that when BTC starts to fall, it can pull SOL down.

LTCUSDT 1D Interval - Resistance and SupportHello everyone, I invite you to review the LTC/USDT chart on a one-day interval, here we can also determine the uptrend channel using blue lines, despite the price breakout attempt at the bottom and the top, we remain in the channel all the time.
Let's start by identifying what support we have in the coming days, the first support will be at $75.29, but if that support is broken we will have second support at $72.11, third support at $69.05 and fourth support at $64.95.
Looking the other way, in the same way we can mark the resistance places that should be taken into account and in this situation we see that we have the first resistance at $82.39, if LTC breaks it and positively tests, we have further resistance at $87.91, the third resistance is at $92.30 $ and fourth at $96.73.
On the CHOP index, we see that there is a lot of energy for the next move, the MACD indicator indicates a local downtrend, while on the RSI we are above halfway, but there is still some room for further growth after a small correction.

Daily review of BTC interval 4HHello everyone, let's look at the BTC to USDT chart on a 4-hour timeframe. As you can see, the price is moving above the local uptrend line.
Let's start with the support line and as you can see the first support in the near future is $17979, if the support is broken then the next support is $17934, $17885 and $17825.
Now let's go from the resistance line, as you can see the first resistance is $18054, if you manage to break it, the next resistance will be $18183 , $18317 and $18505.
Looking at the CHOP indicator, we see that in the 4-hour interval, most of the energy has been used, the MACD indicator indicates a local uptrend, and the RSI is very high, which may indicate a local price correction.

HOME DepotImagine the smell of this legacy stock pumping to $500 in 2023 only to get everyone thinking bear markets over then huge rug to $2. I don't make the rules guys.

DOT / USDT 1D CHART - Resistance and SupportHello everyone, I invite you to review the DOTUSDT 1-day chart. It is worth starting by marking with the yellow lines of the downtrend triangle in which we have been moving for over a year, but we are approaching the direction of the price. However, locally, as we can see, the price is below the downtrend line.
Now, using the Fib Retracement tool, we will check where we currently have support for the price and here we have the first support at the price of $ 5, from which the price has already rebounded three times, but if the support is broken, we have another support at the price of $ 4.55 and $ 3.82.
Looking the other way, we will set the DOT resistance points in the same way and here we have the first resistance at the price of $5.57, the second at the price of $5.92, the third at the price of $6.21 and the fourth at the price of $6.50.
On the CHOP index, we see quite a lot of energy, the MACD indicator indicates the entry into a downtrend, while on the RSI we are below half, there is still room for a larger correction.

BNB / USDT 1D INTERVAL, Support and ResistanceHello everyone, I invite you to review the BNB to USDT chart also on a one-day timeframe. Let's start by marking with the blue lines the sideways trend channel and with the yellow line the local downtrend line under which the price is currently moving.
Now with the help of Fib Retracement we can check the support places for BNB, and here we have the first support at the price of $ 276, the second at the price of $ 264, the third at the price of $ 250, just below the lower border of the channel, but if the price goes lower, we can see it even around $208.
Looking the other way, we can mark the resistance points for the price in the same way and as you can see, we have the first resistance at $285, the second at $307, the third at $324 and the fourth at $342 which is also above the upper limit of the current channel.
Now take a look at the CHOP index which indicates we still have a lot of energy for the next move, the MACD indicator indicates that we are in a downtrend, while the RSI shows that we are below halfway but that does not mean we will not see a major price correction.

$HTGMHolding 23.6 fib level, looking for a potential retest of 38.6 fib level at 1.46 and find support and confirm trend reversal back towards HOD.

DOT / USDT 1D CHART - Resistance and SupportHello everyone, I invite you to review the DOTUSDT chart on a one-day interval, as we can see, the price went down from the triangle in which we were moving and is currently below the downtrend line marked in yellow.
In terms of support, we can see that we have touched the upper border of the support zone which runs from $5,121 to $4,957, however, if we fall below this zone, the price may drop to around $4.48.
Looking the other way, it is worth determining the current resistance points for the price and so we see that we have the first resistance at $5,243, the second at $5,419, the third at $5,565, then $5.71 and $5,916.
As we can see on the CHOP index, there is a lot of energy for the next move, the MACD indicates that we are on the verge of entering a downtrend, and the RSI that we are below half, however, we still have room for a larger drop, so be careful.

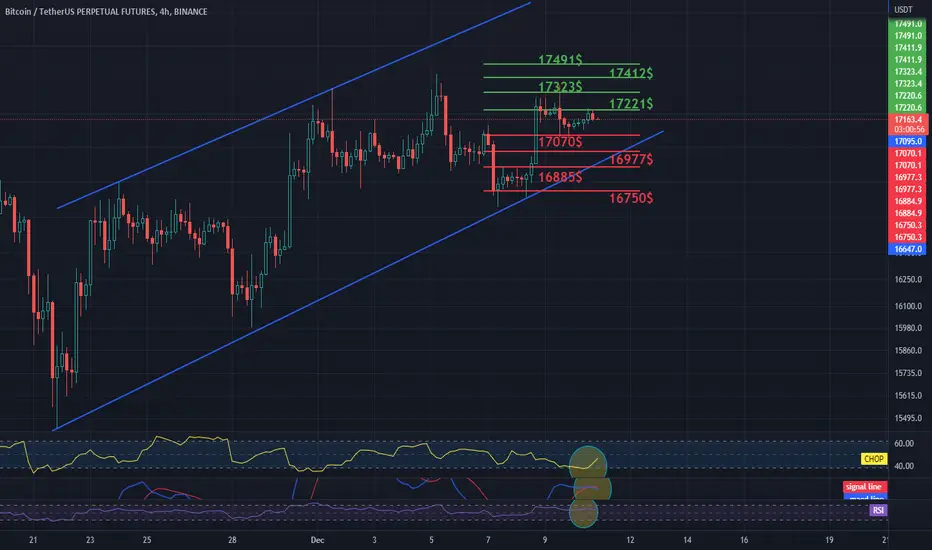
Daily review of BTC interval 4HHello everyone, let's look at the BTC to USDT chart on a 4-hour time frame. As you can see, the price has been moving in an uptrend channel for almost twenty days, which we have marked with blue lines.
It is now worth checking what supports we should consider in the coming hours or days and as you can see the first support is $17070, if the support is broken then the next support is $16977, $16885 and $16750.
Now let's go from the resistance line, as you can see the first resistance that the price has to overcome and positively test is $17221, if you manage to break it the next resistance will be $17323, $17412 and $17491.
Looking at the CHOP indicator, we see that in the 4-hour interval, the energy begins to gain strength, the MACD indicator indicates that we have entered a local downtrend, while the RSI shows that we are quite high and we should consider hedging the position in case of a correction.
S&P - Break the Pattern - Cycle, Trend Fibs and channels .. The lower the better .. I think a fake out to the lower side... Then flip to rally.. Your move
s&p 500 short idealooking for S&P to continue its move lower. broken out of a daily and H1 up channel and making new lower highs and lows

XRP / USDT 1daychartHello, I invite you to a short overview of the XRP to USDT chart on a one-day time frame. Here we can use yellow lines to mark a triangle in which the price is moving, which is important in its upper part.
Now let's look at what support we should consider in the coming days, and here we have the first support at $0.374, the second at $0.345 and the third at $0.322.
Looking the other way, we can also see where the price may meet resistance on its way, as we see the first resistance at which the price has now turned around is $0.398, the second resistance is at $0.412, the next is at $0.425 and the fourth at $0.437.
On the CHOP index, we can see that the energy is strongly charged, the MACD indicator indicates that we are in an uptrend, while on the RSI we are below half, which may indicate a place for further increases.

gbpusdlast point for selling oppertunity for my strategy. were at the top of a daily channel and the H1 has made structure lows. hopefully heading down to the bottom of daily channel. this entry is a risk entry not a confirmation entry

LTTSHello & welcome to this analysis
LTTS from May 2021 lows formed a Bullish Harmonic Bat in July 2022. From there it has almost given a 62% retracement to now form a Bearish ABCD Pattern suggesting some consolidation to pullback till 3900 until it starts sustaining above 4400.
Not an area to go aggressive fresh long right now, more of a pullback for entry and then a likely rally for 5400 and more.
Hope this analysis is of help to both traders and investors

UNIUSDT 1D Interval- Targets and StoplossHello everyone, let's look at the 1D UNI to USDT chart as you can see how we can see the price moving below the downtrend line marked in yellow.
Let's start by setting goals for the near future that we can take into account:
T1 - $6.68
T2 - $7.29
T3 - $7.91
T4 - $8.76
and
T5 - $9.85
Now let's move on to the stop loss in case the market goes down further:
SL1 - $5.81
SL2 - $4.72
and
SL3 - $3.33
Looking at the CHOP indicator, we see that on the 1D interval, the energy is starting to slowly increase, while the MACD indicator shows an uptrend, and the RSI shows that we still have room for further growth.
