BTCThis is my primary count heading into 2023. Seems like unless we straight nuke to $9,200 then I'd expect this move to play out.
Much more painful on both sides. Finish around the 618% of the covid 2020 crash $11,500 but never reach $10K as many are waiting.
Then B wave up to $34k getting everyone tweeting WGMI and then B wave gets finished and Rug back to finally hit $10K making everyone think Crypto is dead again.
Finally completing this correction & the HTF Wave C and this bear Market.
After that 2024 1/2ing and run it back turbo $200K.
Fibonaccianalysis

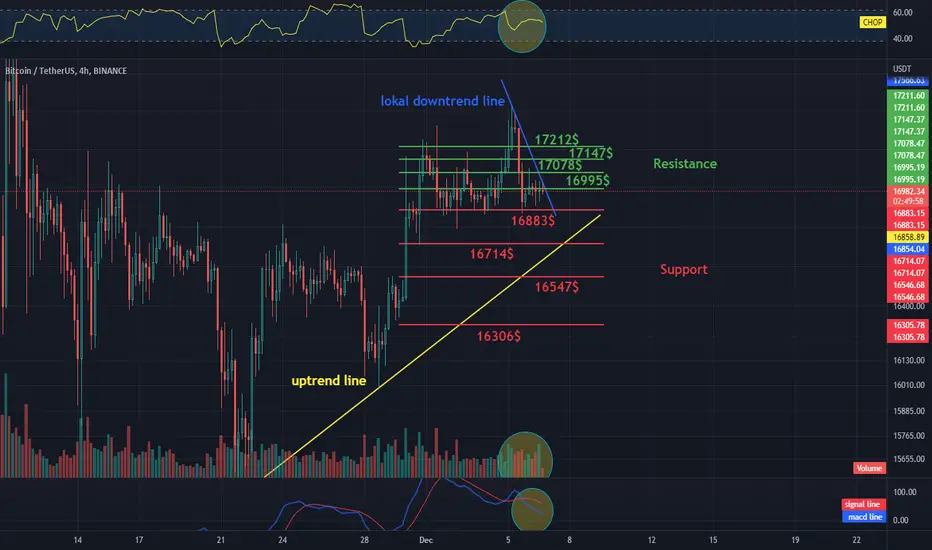
Daily review of BTC interval 4HHello everyone, let's look at the BTC to USDT chart on a 4-hour timeframe. As you can see, the price is moving above the uptrend line, but locally we are on the verge of the downtrend line.
Let's start with the support line and as you can see the first support in the near future is $16883, if the support is broken then the next support is $16714, $16547 and $16306.
Now let's move on to the resistance line, as you can see the first resistance the price is currently facing is $16995, if it breaks out the next resistance will be $17078, $17147 and $17212.
Looking at the CHOP indicator, we see that in the 4-hour interval we still have a lot of energy for the next move, the MACD indicator indicates a local downtrend, while the volume begins to indicate an advantage on the buyers' side.
Daily review of BTC interval 4HHello everyone, let's look at the BTC to USDT chart on a 4-hour timeframe. As you can see, the price is moving within the uptrend channel indicated by the blue lines.
Let's start with the support line and as you can see the first support in the near future is $16967, if the support is broken then the next support is $16677, $16453 and $16222.
Now let's move on to the resistance line, as you can see we've managed to break the resistance at 0.618 Fib and we currently have resistance at $17609 if we manage to break it the next resistance will be $18199 which is very important as the previous price breakout was at the same point only when the price goes up and then positively tests this place, we can expect further increases.
Looking at the CHOP indicator, we see that in the 4-hour interval, some of the energy has been used, but we have some time to continue the move, the MACD indicator indicates the entry into a local uptrend, while the volume shows red candles, which means the advantage of sellers, however, you can see that it is she is very small.

ETH - USDT, 1D Interval Resistance and Support I invite you to review the ETH/USDT chart on the one-day interval as its predecessor.
Let's start by determining the main trend under which the price has been moving since the last ATH. Now it is worth marking with the yellow lines the triangle in which ETH is currently moving.
Let's now move on to identifying two very important supports, the first at 0.78 Fib Retracement, equal to $1125, and the second support at the last low of $880.
Looking the other way, the price has two strong resistance zones, the first zone starts at $1524 and lasts until $1920, only when the price breaks above the first zone and makes a positive attempt to attack the second zone from $2573 to $3016, the way will open for us towards a new peak.
Looking at the CHOP index, we see that we have less and less energy, the MACD indicator indicates a change in the trend to an upward one, and the volume, although low, indicates the predominance of green candles on the buyers' side.

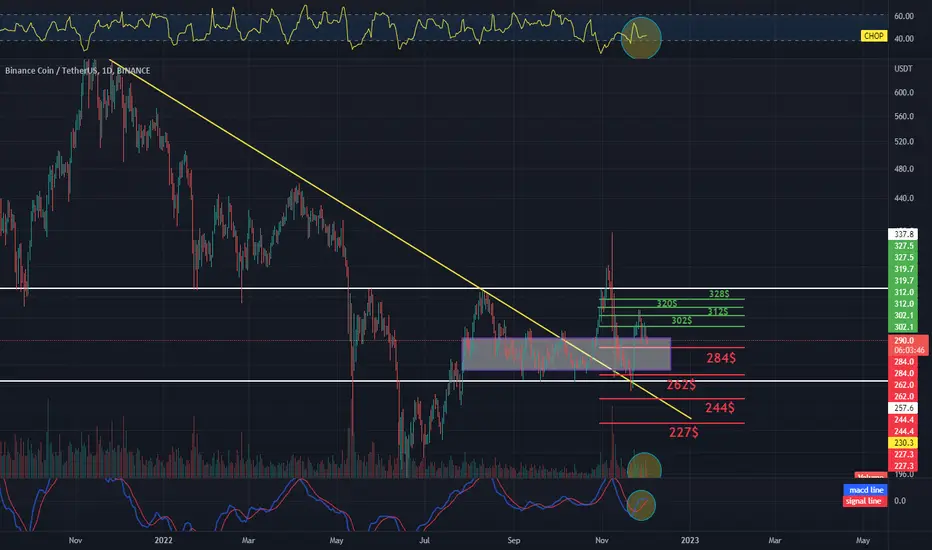
BNB / USDT 1D INTERVAL, Support and ResistanceHello everyone, welcome to the BNB to USDT chart on a one-day interval. Let's start by marking with white lines the channel of the sideways trend in which the price is moving.
Now we will mark the trend line, which, as you can see, the price overcame.
Now let's check what support places we should consider for the near future and as you can see, we have the first support at $284, the second at $262, the third at $244 and the fourth at $227.
It is also worth highlighting the zone from $292 to $266, because this is a very strong area of demand and supply for BNB.
Now let's move on to determining the resistance points that the price must overcome on its way up. And here we see that the first resistance is at $302, the next resistance is at $312, then $320 and $328.
Moving on, we see that the CHOP index indicates that the energy is low but is slowly starting to increase, the MACD indicator indicates that we are close to entering a downtrend, and on the volume we see falling energy, but with a predominance of sellers.
XRP - USDT on 1D interval Resistance and SupportHello everyone, I invite you to chart XRP in pair to USDT on a one-day time frame. Let's start by marking with the yellow lines the channel in which the price is moving and with the blue line the local uptrend line.
As we can see, the price turned around nicely around zero seventy-eight and returned to zero sixty-one.
Now let's check what current support we should consider and here we have the first support at thirty-seven cents, the second support at thirty-four cents, the third support at thirty-two cents and the fourth support at thirty-cents.
However, for the price to freely start to grow, it must overcome a strong resistance from forty-two cents to forty-six cents, only when it breaks above this area and tests it successfully, we will be able to see further increases.
It is worth mentioning that the energy on the CHOP index is strongly charged, the macdi indicator indicates that we are in the local uptrend, and on the volume , although it is small, we see the advantage of buyers.

BTCUSD Weekly Trend-based Fib - Bearish retest of 17.500 next?Just playing with a trend-based Fib on the Weekly levels again.
Let's see how this one plays out.
Seems like we might get a (bearish) retest of the 17.500 level and then (a final?) drop to the12.300 - 13.400 levels. These levels align with the weekly 0.886 and .0786 Fib-levels.
Weekly
s3.tradingview.com
Daily
s3.tradingview.com

GOLDEN ZONE - FibonacciHello guys! Take a look at how smoothly the market respects the Golden Zone on Fibonacci retracement levels. The Golden Zone or Golden Ratio is the area between 50% and 61.8% on retracement levels, which acts as a strong support zone. After an impulse, on the correction the price usually gets rejected by this zone and it continues its previous trend. However, if it is broken, there is a high change of a trend reversal, as we can see in this chart.

Chart and fundamental analysis of Iris Energy Limited (IRIS)The operating result for the last quarter was published recently, on November 30, 2022.
1. Graphic Analysis
As the company's core activity is Bitcoin mining, it is important to analyze the correlation with the price of Bitcoin.
As you can see in the graph below, most of the time the correlation is positive.
It seems to me that the price is at the end of wave 5, about to reverse the downtrend, which has lasted since the beginning.
The DMI SMI Oscillator exhibits a bullish descending wedge.
This same interpretation can be obtained on the RSI:
2. Fundamental analysis
Net income has held steady for quite some time at $72 million.
As of Q1 since year 2022, it has declined to minus -$2 million and has since been stable.
The same reasoning can be applied to Earnings per Share versus Estimated Earnings per Share .
The balance sheet remains healthy, with assets greater than liabilities.
Even if there is a need to settle the net debt after the sale of assets, it would be comfortably honored.
With regard to cash flow, money from third parties continues to decrease, which is positive.
Money spent on investments follows a negative flow.
A negative value of Cash From Investing Activities can show poor performance, but it can also be a sign of increased investment activities.
While cash from operating activities remains stable at $4 million.
The point to note negatively is the free cash flow, which has drastically reduced to -$210 million.

Daily review of BTC interval 4HHello everyone, let's look at the BTC to USDT chart on a 4-hour timeframe. As you can see, the price has fallen below the local uptrend line.
Let's start with the support line and as you can see the first support in the near future is $16919, if the support is broken then the next support is $16825, $16688 and $16512.
Now let's move to the resistance line, as you can see the first resistance is $17206, if you manage to break it, the next resistance will be $17398, $17558 and $17710.
Looking at the CHOP indicator, we see that in the 4-hour interval, most of the energy has been used, the MACD indicator indicates that we are close to entering a local downtrend, while the volume showed a decreasing candle on the sellers side, and the new candle is starting to glow green, however, the volume is very low .

MATIC / USDT 1D chart Resistance and SupportHello everyone, I invite you to review the MATIC chart in pair to USDT also on a one-day timeframe. As the first we will mark the downtrend lines in blue and with the yellow line the local downtrend line. Both of these lines were broken by the price.
First, we will check the situation with the resistances that the price must overcome and here we see that we have the first resistance at $0.81, the second at $0.69, the third at $0.53 and the fourth at $0.32.
Looking the other way, the same with the Fib Retracement tool we will check what support we should take into account, so the first support that the price is currently fighting is $ 0.93, if we manage to break it, we have the second at $ 1.31, the third at $ 1.63 and the fourth support at $1.93.
Looking at the CHOP index, we see that the energy is gaining more and more strength, the MACD indicator indicates that we have entered an uptrend, while the volume is increasing, with buyers predominating.

Daily review of ETH interval 1DHello everyone, I invite you to an ETH review to USDT in 4 hours. As you can see, we can with the help of blue lines mark the inheritance trend channel in which the price moves.
Let's start by determining the support line, and as you can see the first support in the near future is $ 1144, if the support is broken, the next support is $ 1054, $ 984 and $ 912.
Now let's get to the resistance line, because you can see that the first resistance is $ 1290, if the price breaks it with top, the next resistance will be $ 1349, $ 1519 and $ 1791.
It is also worth adding that we move above the growth trend line that we mean the yellow line.
Looking at the Index Chop, we see that in the 4-hour range most of the energy was used, but we have a little for the next move, the MacD inadist indicates an upward trend, and the volume, although small, indicates an advantage on the side of buyers.

Daily review of BTC interval 4HHello everyone, let's look at the BTC to USDT chart on a 4-hour time frame. As you can see, the price is moving in the sideways trend channel marked with white lines and that it is locally on the uptrend line.
Let's start with the support line and as you can see the first support at which the price is currently located is $16720, if the support is broken then the next support is $16580, $16442 and $16244.
Now let's move on to the resistance line, as you can see the first resistance is $16824, if you manage to break it, the next resistance will be $17333 only when the price goes up and positively tests this level and moves further up.
Looking at the CHOP indicator, we see that the energy has been exhausted in the 4-hour interval, the MACD indicator indicates a local uptrend, and the volume, although small, indicates a growing advantage on the sellers' side.

QNTUSDT 4H Interval Targets and StoplossHello everyone, let's take a look at the 4H QNT to USDT chart as you can see that the price is moving in a sideways trend channel and locally trying to break out of the down trend line upwards.
Let's start by setting goals for the near future that we can take into account:
T1 = $114.1
T2 = $117.6
T3 = $120.5
T4 = $123.5
and
T5 = $127.3
Now let's move on to the stop loss in case the market goes down further:
SL1 = $112.5
SL2 = $110
SL3 = $108.2
SL4 = $106.3
and
SL5 = $103.5
Looking at the CHOP indicator, we see that most of the energy has been used on the 4H interval, while the MACD indicator indicates a local downtrend.

FTMIn order to understand this analysis I must explain The green ABC inside of the circle, the yellow 5 up below the A wave inside the circle. Also The red ABC down and the green B inside the circle. Also the Blue line & the triangle.
1st my HTF analysis is that FTM is inside of a bearish ABC up on the monthly TF. A zig zag on weekly TF will create the waves on the monthly TF . 5 up for wave A inside of the green circle ended in 2021 & started in 2020 closing that TF off and making the highs above $3 last year. Wave A
2nd green B wave inside the circle (currently finishing in 2022) the red ABC down will make the B wave on the monthly TF , 618% green fib level or more likely 786% is a perfect area to find support for a B wave on any TF. Wave B
3rd blue line from bottom of the triangle points directly at the 786% and is measured from height of top TL down to bottom TL of the massive triangle correction. This shows that a big move down is likely.
After we confirm the B wave on HTF monthly chart between .07 to.01c we can plot wave C on the HTF which is not visible in my chart. But if I had to project or forecast this future PA I would say C wave can easily do a 1 to 1 fib extension from the top of the green A wave on the HTF , down to green B wave HTF & we get a target around $30-$34 into 2024.
Also this chart is Log scale as per my preference with EW..

Daily review of BTC interval 4H
Hello everyone, let's look at the BTC to USDT chart on a 4-hour time frame. As we can see, for a long time BTC has been moving within the channel marked with white lines, while locally we can mark the uptrend line.
You can also notice that we currently have a higher low than the previous one, but it will be important if we manage to draw a new higher peak, then we will receive a signal for further increases.
It is also worth mentioning that the last drop in the price stopped perfectly at 0.61 Fibretracement, which the price tested and changed its direction to an upward one.
Now let's move on to the support line for the near future and here we see the first support at $16404, if the support is broken then the next support is $16311, $16244 and $16173.
However, looking the other way, we can determine a strong resistance zone from $ 16,501 to $ 16,638, only going above this zone and breaking the resistance at the price of $ 16,814 will open the way for us to try to leave the current price channel.
Looking at the CHOP indicator, we see that in the 4-hour interval, the energy begins to gain more and more strength, the MACD indicator indicates a local uptrend, and the volume, although small, shows the predominance of buyer candles.

Nas100 ... An elliptical way of looking at itI thought it might be useful be provide my elliptical analysis of the NAS100 for some direction and comment.
My ellipse has modelled this quite well with several good touch points. (green dots)
Additionally I have added a Fibonacci Fan using the blue dots as the range points and providing an extension in the future.
(TradingView has yet to provide Fibonacci fans and sadly lacking in precision geometric analysis IMHO)
I ask that you provide any comments, personal insights and suggestions if you use this methodology in your trading.
Thanks for reading and I will follow up as needed.
(Note: This is log scale so you may have to rescale the Y-axis by dragging it up or down to align the red line with the blue dots... a problem with log scale and TV.)
S.

$NIFTY Possible Bull Target & Reversal Zones #NiftyTraders and Investors, there is a lot of joy, speculation, excitement and nervousness in the Indian stock market as it makes another all-time high today. This however can be very deceiving or a good opportunity. Depends on how to see and interpret it. 🙂 If you think this is way too high and it should take a correction or dump then it may just give you that sort of opportunity when it reaches one of those FCP zones or extension levels ahead. If you are bullish and expect market to continue rise higher then also we have these zones and extension levels as possible bullish targets.
Remember a few things about this market:
1. It has been consolidating for a while after hitting a major reversal level as you will see in the attached idea posted on Oct 13, 2021. This can still form a double top and fall down.
2. The Nifty 50 index has been taking divergence from US Indices this year. Whilst US indices fell Nity held its position strongly. But that does not mean it can no start to follow them again. The correlations come and go in time cycles.
3. This market cab target 20K level as well because that is psychological and is getting close. In terms of points, it is still too far but in the overall price action structure it is not.
Please support this analysis by liking and sharing. 👍🙂
Rules:
1. Never trade too much
2. Never trade without a confirmation
3. Never rely on signals, do your own analysis and research too
✅ If you found this idea useful, hit the like button, subscribe and share it in other trading forums.
✅ Follow me for future ideas, trade set ups and the updates of this analysis
✅ Don't hesitate to share your ideas, comments, opinions and questions.
Take care and trade well
-Vik
____________________________________________________
📌 DISCLAIMER
The content on this analysis is subject to change at any time without notice and is provided for the sole purpose of education only.
Not a financial advice or signal. Please make your own independent investment decisions.
____________________________________________________

FTM / USDT 1D Interval We will now check the situation on FTM to USDT, first we will mark the downtrend channel in which the price has been moving for a long time, while locally we can mark the uptrend lines with yellow color.
As we can see we have a strong support zone from the seventeen cents to fifteen cents level which must hold the price to prevent it from deepening the channel, however if we go lower we can see the price around thirteen cents.
Looking the other way, we see that the first resistance is at twenty-one cents, the second at twenty-three cents, the third at twenty-four cents, and the fourth at twenty-seven cents. Only overcoming these resistances and leaving the channel upwards can open the way for greater increases.
Nevertheless, we can see that the energy is strongly charged and the makdi indicates an uptrend, and the volume is on the side of the buyers, if BTC maintains its level or starts to grow, we can see an increase in the FTM price.

BNB / USDT 1D INTERVAL, Support and ResistanceHello everyone, I invite you to a short overview of the situation of BNB to USDT on a 1-day interval. As you can see, we can boldly mark a channel in which the price moves sideways, despite the attempt to exit down and up, the price quickly returned to this channel.
Now let's move on to determining the supports and as you can see, the price is currently right at the support at the level of two hundred and ninety-two dollars, if the support is broken, we have another at the price of two hundred and seventy-six dollars, then at two hundred and sixty-three dollars and two hundred and forty-nine dollars at which once again the price has turned back.
As for the resistances that BNB needs to overcome first, we see that the first resistance is at $322, the second at $312, the third at $322 and the fourth at $329 which is close to the upper limit of our channel.
However, we can see that the energy is exhausted and despite the current decline, we remain in the local uptrend.

XRP - USDT on 1D interval Resistance and SupportHello everyone, I invite you to chart XRP in pair to USDT on a one-day time frame. Let's start by marking with the yellow lines the channel in which the price is moving and with the blue line the local uptrend line.
As we can see, the price turned around nicely around zero seventy-eight and returned to zero sixty-one.
Now let's check what current support we should consider and here we have the first support at thirty-seven cents, the second support at thirty-four cents, the third support at thirty-two cents and the fourth support at thirty-cents.
However, for the price to freely start to grow, it must overcome a strong resistance from forty-two cents to forty-six cents, only when it breaks above this area and tests it successfully, we will be able to see further increases.
It is worth mentioning that the energy on the CHOP index is strongly charged, the macdi indicator indicates that we are in the local uptrend, and on the volume, although it is small, we see the advantage of buyers.

Daily review of BTC interval 4HHello everyone, let's look at the BTC to USDT chart on a 4-hour time frame. As you can see, the price has broken down from the channel marked with blue lines in accordance with the analyzes from the previous days, and we can see that the price is currently trying to stay above the local downtrend line.
Let's start with setting the support line and as you can see the first support is currently at 0.5 Fibonacities around the price of $16144, if the support is broken then the next support is $15986, $15765 and $15479.
Now let's move on from the resistance line, as you can see, the price must break above $16,232 first, then we will attack the $16,346, $16,435 and $16,525 levels.
Looking at the CHOP indicator, we see that in the 4-hour interval, the energy was used for the decline as assumed, the MACD indicator also confirms the downward trend, while we see that the volume is with the advantage of sellers, but it can be seen that it has decreased significantly.

ETHThe 618% retracement level from covid crash is around $410, the impulsive 5 down off the C wave has hit all the fib levels, the 3 tested the 1.618% around $900 in June, then the 4 tested the 382% retrace level.
Then the second wave of the 4th rejected off the 618% level.
Now likely breaking down from major support at $1,200 to finish the 5th wave around $400 level. After that we can re analyze.
