Daily review of BTC interval 4HHello, I invite you to update the BTCUSDT analysis on the 4H interval, more details are included in the chart.
Fibonaccianalysis

UNIUSDT 4H Interval- Targets and StoplossHello everyone, let's look at the 4H UNI to USDT chart as you can see that the price is moving above the local downtrend line.
Let's start by setting goals for the near future that we can take into account:
T1 = $5.63
T2 = $5.84
T3 = $6.06
T4 = $6.35
and
T5 = $6.74
Now let's move on to the stop loss in case the market goes down further:
SL1 = $5.27
SL2 = $5.04
SL3 = $4.86
SL4 = $4.67
and
SL5 = $4.41
Looking at the CHOP indicator, we see that the energy is strongly charged on the 4H interval, while the MACD indicator indicates a local uptrend.

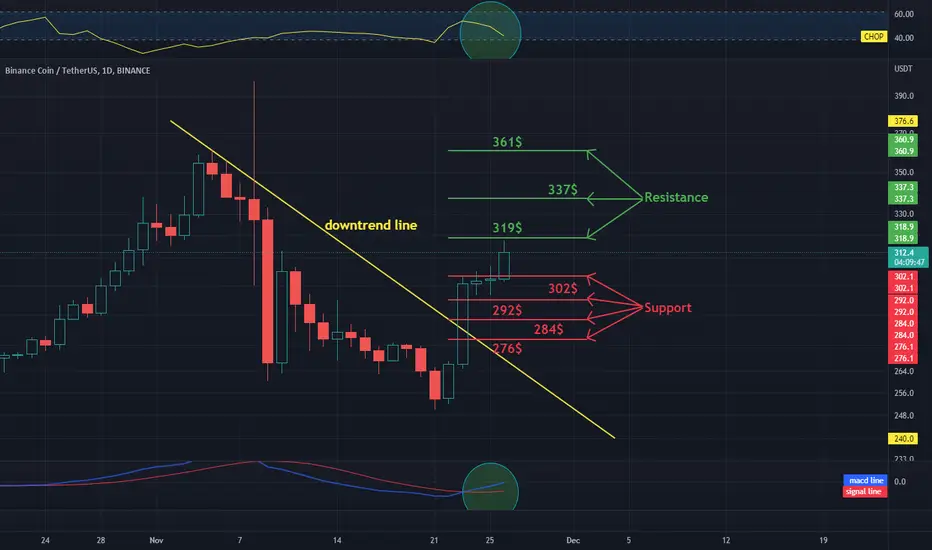
BNB / USDT 1D INTERVAL, Support and ResistanceHello everyone, let's look at the BNB to USDT 1 day chart. As you can see, the price has moved above the downtrend line.
Let's start with the support line and as you can see the first support we should consider is $302, if the support is broken then the next support is $292, $284 and $276.
Now let's go from the resistance line, as you can see the first resistance is $319, if you manage to break it, the next resistance will be $337 and $361.
Looking at the CHOP indicator, we see that most of the energy has been used on the one-day time frame, while the MACD indicator indicates a local uptrend.
Daily review of BTC interval 4HHello everyone, let's look at the BTC to USDT chart on a 4-hour timeframe. As you can see, the price has been moving in the sideways trend channel for a long time, but locally we see that the price is below the downtrend line.
Let's start with the support line and as you can see the first support at which the price is currently located is $16453, if the support is broken then the next support is $16226, $16045 and $15860.
Now let's go from the resistance line, as you can see the first resistance is $16671, if you manage to break it the next resistance will be $16865, $17016 and $17181.
Looking at the CHOP indicator, we see that in the 4-hour interval we have a lot of energy and be careful because it can be used to decrease the price, while the MACD indicates that the local trend has not changed to an upward one.

Chart Pattern Review | Diamond Top / Bottom ReversalDIAMOND TOP / BOTTOM:
> A trend reversal pattern indicating the end of up or downward trend - slightly off head & shoulders pattern
> Price increased and declined sharply with significant volume forming a diamond shape
> A mix of expanding and contracting triangle or wedge, often confused with a more popular head & shoulders
> Timing could range from days to months
Key characteristics:
> The price should trending downward then forming a broadening pattern.
> The price pattern increased and decreased sharply before squeezed for rebound
> Timing ranging from days-weeks-or months - a strong long-term reversal pattern
> Most trends will begin with a breakout gap and be followed by several runaway gaps.
Trading Tips:
> Price range determines the target reversal
> TP1 @ the size of the diamond extending the breakout or breakdown distance.
> TP2 can be targeted between 1.0 / 1.618 fibonanci retracement.
> TP3 @ key moving average support / resistance within extended range.
> Putting the chart together with a price oscillator like VWAP / CVD for a better early breakout or breakdown catch.
> Price oscillator can monitor the overall likelihood of a high probability trade and confirming strength/momentum as well as spotting false breakout/breakdown trades.
Always trade with affordable risk and respect your stoploss, nothing 100%
Good Luck!

Auto Fib (2): 1H Set-up exampleFrom the last publication, this is the example of how to use it in 1H of which I use the same set.
This is a possible swing position that is playable if you consider the R:R.
Entry:
I entered in between the overlapped Fibs of the small degree swing. Actually at 16k is the best bet where overlapping 0.68 lie.
Target:
1. I am looking for 17.7k (0.38 level) which is the larger degree swing retracement as 1st Target in case we continue ranging. Part of the position can be took.
2. If it breaks, I am aiming at 19K for sure and I might also try to Short it. 19K shows solid confluence of 0.38 level of the largest degree retracement and 0.618 of the second largest.
Reaction can be expected there. Thus, you may be able to find a short correction swing that can be profitable.
Stoploss:
I will stop at the lower low because it means both ranging case and bullish case is falsified and we are continuing lower with extreme bearishness.
**** However, you may use other indicators for timing entry/exit or analyzing the swings as well, i.e. RSI is very useful

Auto Fibo, how to use?This is just an idea on how should we use "Auto Fibonacci", or at least for me, with out Elliotwave. This is more of a curiosity and I find that the combination of Fibos is pretty making senses.
The concept of this auto fib is that the Pivot STD is the representation of a swing's magnitude. Thus we set it roughly in intervals and of course you will if the sweet spot for your asset.
This takes just a bit of time as small STD difference is useless.
For me I take 0.68 as the most critical spot for Fibonacci level and 0.38 for small correction but subsidiary - as a smaller degree within a trend.
The overlapping level of different STDs will be a critical resistance and support.
It can be used to assess the "trend" as well. Right now for instance, all of the fibs are drawn downward even in the least STD one, 3 STD. This means we are very "bearish".
Basically, the fib will flip when the previous high is broken.
Of course, this can be implemented in a smaller time frame as well but I choose 1D as it is visually pleasing. BTW, you may need to adjust certain STD to suit your TF esp. those with low STD in small TF. You can just close it.

MKRUSDT is a trend reversal coming?Hello everyone, I invite you to review the MKR chart against USDT on a one-day interval. Let's start with determining the direction of the movement and here we have a downtrend channel, what's more, we can mark with the yellow line the local downtrend line under which the price is currently located.
Now we will check the situation with support, which we can take into account when the price starts to fall more strongly and as you can see, we have the first support around $ 587, but if the price goes down from this support, we have the next support only at the price of $ 432.
Looking the other way, we can also check the places of resistance when the ADA price starts to rise and here we have the first resistance at $754, the second resistance at $840, the third at $911 and the fourth at $979.
It is worth noting that we had two lows, the second of which was lower than the first, and similarly, we have two highs where the second is lower than the first, but the current low, if not deepened, will be a higher low than the previous one, which could indicate a change in trend.
Looking at the lows and highs, we can expect a trend reversal to this, the CHOP index indicates that we are collecting more and more energy, and the MACD indicator also indicates that the downward trend, lasting over a month, turns into an upward trend.

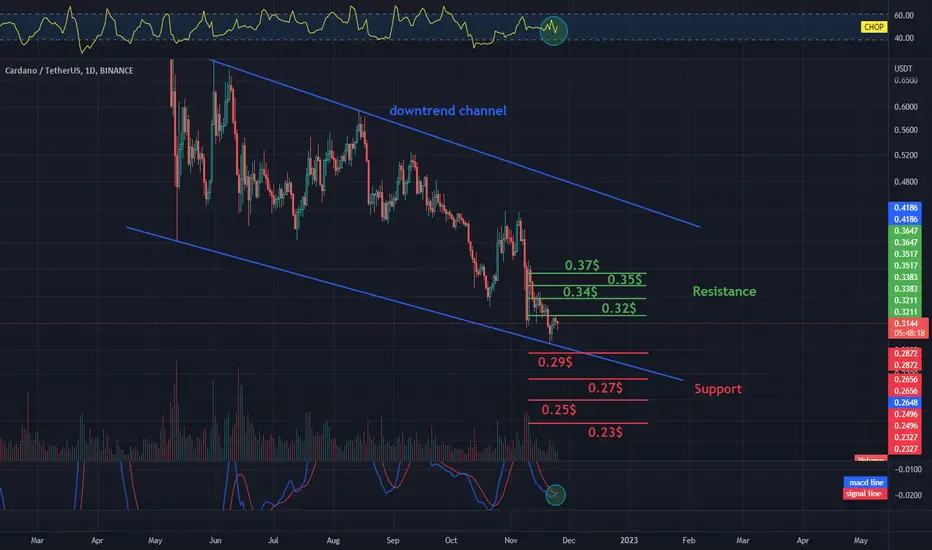
ADA/USDT 1D INTERVAL - Resistance and SupportHello everyone, I invite you to a short review of the ADA chart in pair to USDT on a one-day timeframe. First, we will use the blue lines to mark the downtrend channel in which the ADA has been moving for a long time.
As you can see, we are at the bottom of our channel, so it's worth checking what support we have in the near future and as you can see, we can mark the first support at $0.29, if the support is broken, then the next support is $0.27, $0.25 and $0.23.
Similarly, it is worth checking what resistance we can expect if the price of ADA starts to grow. As you can see the first resistance is $0.32, if it is broken then the next resistance will be $0.34, $0.35 and $0.37.
Looking at the CHOP indicator, we see that in the 1-day interval, the energy begins to gain strength, and the MACD indicator indicates that we are on the verge of changing the trend to an upward one.
LTCUSDT 1D Interval - Resistance and SupportHello everyone, let's look at the LTC to USDT chart on a one-day interval. As you can see, the price is moving within the uptrend channel which we have marked with the yellow lines.
Let's start with the support line and as you can see the first support in the coming days is $73.93, if the support is broken then the next support is $70.87, $67.94 and $63.60.
Now let's go from the resistance line, as you can see the first resistance is $82.15, if you manage to break it, the next resistance will be $87.31, $91.59 and $95.90.
Looking at the CHOP indicator, we see that most of the energy has been used on the one-day interval, the MACD indicator indicates an uptrend, while because of the large volume of buyers, we now have two red candles that are much smaller.

Daily review of BTC interval 1DHello everyone, let's look at the BTC to USDT chart in the 4-hour timeframe as you can see we are moving in the downtrend channel marked with the blue lines.
As for support, we should watch BTC price behavior within the channel, as a break below the designated channel can give a quick drop to a strong support zone from $13,172 to $12,709.
On the other hand, when the price starts to rise, we can mark resistance places with green lines and in this situation, the first resistance is at $ 17,771, if the price breaks it, the next resistance is at $ 19,203 and $ 20,352.
As you can see on the one-day interval, we have a lot of energy, the MACD indicator indicates a change in the trend to an upward one, and the volume for the last two days indicates the advantage of sellers, but it is clearly low.

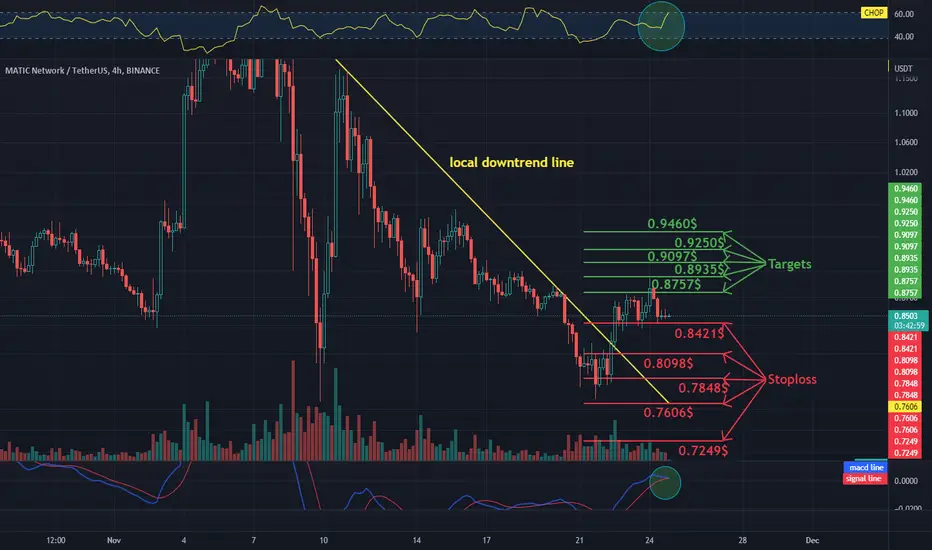
MATIC / USDT 4H chart Targets and StoplossHello everyone, let's look at the 4H MATIC to USDT chart as you can see that the price is moving above the local downtrend line.
Let's start by setting goals for the near future that we can take into account:
T1 = $0.8757
T2 = $0.8935
T3 = $0.9097
T4 = $0.9250
and
T5 =0.9460$
Now let's move on to the stop loss in case the market goes down further:
SL1 = $0.8421
SL2 = $0.8098
SL3 = $0.7848
SL4 = $0.7606
and
SL5 = $0.7249
Looking at the CHOP indicator, we see that the energy is heavily charged on the 4H time frame, the MACD indicator shows that it is in a local uptrend, while the volume is very low.
AAPL | 4-Wave Triangle Analysis | 5-wave Projection +50%Price action and chart pattern trading signal
> A bullish scenario 4-wave triangle with a local bullish pennant breakout in triangle formation - D-wave uptrend
> price bullish momentum SMA20 X SMA50 and MACD X baseline
> Target 5 wave @ bullish pennant pattern = 1.618 extension of current 4-wave +50++% from expected E-wave support line.
> Stoploss @ C or A wave position -10%
> Risk reward ratio: 5:1
Always trade with affordable risk and respect your stoploss, nothing 100%.

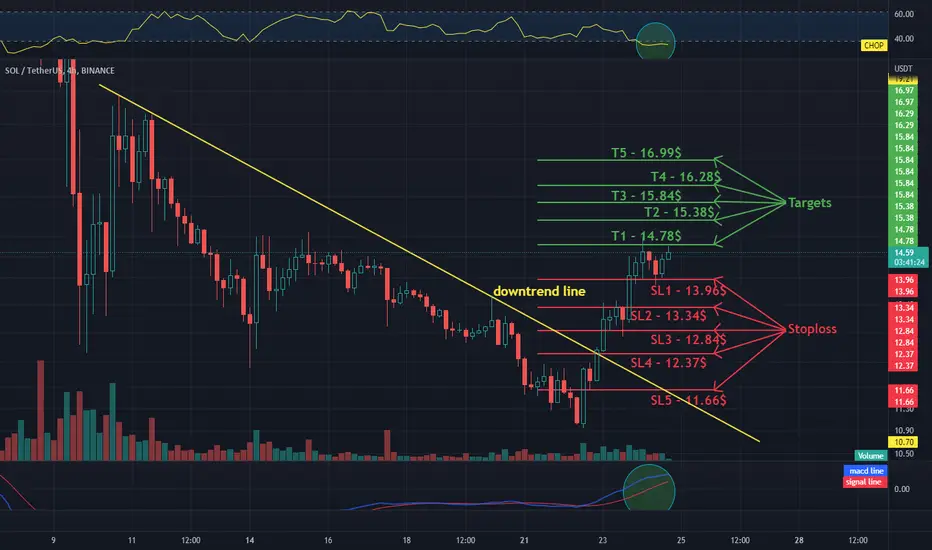
SOL - USDT 4HChart, targets and stoplossHello everyone, let's take a look at the 4H SOL to USDT chart as you can see that it has moved above the downtrend line.
Let's start by setting goals for the near future that we can take into account:
T1 - $14.78
T2 - $15.38
T3 - $15.84
T4 - $16.28
and
T5 - $16.99
Now let's move on to the stop loss in case the market goes down further:
SL1 - $13.96
SL2 - $13.34
SL3 - $12.84
SL4 - $12.37
and
SL5 - $11.66
Looking at the CHOP indicator, we see that the energy is exhausted on the 4H interval, while the MACD indicator indicates a local uptrend.
Daily review of BTC interval 4HHello everyone, let's look at the BTC to USDT chart on a 4-hour time frame. As you can see, the price has been moving in a sideways trend channel for a long time.
Let's start with the support line and as you can see the first support in the next hours is $16449, if the support is broken then the next support is $16225, $16041 and $15852.
Now let's move to the resistance line, as you can see the first resistance is $16774, if the price goes up from the first resistance, the next resistance will be $16968, $17122 and $17282.
Looking at the CHOP indicator, we see that most of the energy has been used in the 4-hour interval, the MACD indicator indicates that we are maintaining a local uptrend, while the volume is very small and we see a slight advantage of sellers over the last hours.

AGRO Accumulated. *AGRO*. D1. Bearish trend. Has been accumulated.
SL 505
TP1 560
TP2 615
⚠️ Still it is in the bearish trend. Carefull.

GME: Huge Price Action Next Week? $43?Hello,
Welcome back to another TA! First and foremost, I eat crayons every day, and none of this is financial or sexual advice. That being said, the MACD, although a lagging indicator tells us a bigger picture of what is to come. First, the further the signal line is below zero, the stronger the signal once the MACD line crosses from below to above the signal line the more bullish. We're mostly going to talk about the daily timeframe but the weekly is also a telling story.
MACD
So, in the past year, starting in
March (RC buy-in) MACD was way below zero and once it crossed above the stronger uptrend we had a ~122% move up.
May MACD also way below zero and once it crossed over we saw a 77% move up
July MACD had a bullish crossover but we were already above zero so the strength of the uptrend was not as strong 27%
Aug MACD was again above zero and the move up was 33%
Sept MACD crossed over below zero but didn't move up past zero. This resulted in a mere 11% move up.
This takes us to the start of the week, Nov 14th, where we had a bullish crossover that started below zero and has crossed from below to above zero. This means our uptrend strength should be greater than expected.
RSI (Relative Strength Index)
The RSI on Nov 9th started below 50 and has since crossed 50 which indicates the stock is bullish. On the weekly, the RSI is curving up to reclaim the 50 line and once we cross over there we'll see some huge uptrend.
Fibonnaci
Fib retracements show that we'll hit $29.99 (0.618) soon. Coupled with what we know about the MACD and RSI we should see at least $32.19 and if the bull trend is strong, we should see (1.618) $43.08
TL;DRS Everything signals bullish with this stock and we should see huge price action which could potentially take us to $43.

XRP / USDT Review 1DayChartHello everyone, I invite you to the XRP to USDT chart in a one-day interval, as you can see the price has broken the downtrend line and is moving slightly sideways, bouncing off the local uptrend line.
Now we will check what supports we can take into account when the price starts to fall further and here we see that we have the first support at $0.37 if this support is broken we have another strong support at $0.31.
Looking the other way, we will also determine the resistance that the price has yet to overcome, as you can see, the first resistance is at $ 0.41, the next is at $ 0.44, then $ 0.47 and $ 0.51.
Looking at the CHOP indicator, we see that in the 1-day interval, the energy is very charged, and the MACD indicator indicates that we have entered an uptrend.

ETH - USDT, 1D Interval Resistance and Support Hello everyone, let's look at the ETH to USDT 1 day chart. As you can see, the price is moving in the downtrend channel, which is important in its lower part.
Let's start with setting support and as you can see ETH has a strong support zone from $1129 to $883 ahead, moreover looking at the recent move we can mark the $974 level as a strong place where the price may turn around.
Now let's move to the resistance line, as you can see the first resistance is $1301, if you manage to break it, the next resistance will be $1444, $1555 and $1669.
Looking at the CHOP indicator, we see that in the 1-day interval, the energy is strongly charged, the MACD indicator indicates the continuation of the downward trend, and the volume shows little interest on the part of sellers and buyers.

Daily review of BTC interval 4HHello everyone, let's look at the BTC to USDT chart on a 4-hour timeframe. As you can see, the price has moved upwards from the triangle marked with yellow lines.
Let's start with the support line and as you can see the first support in the near future is $16361, if the support is broken then the next support is $16161, $15998 and 15829.
Now let's go from the resistance line, as you can see the first resistance is $16766, if you manage to break it, the next resistance will be $16934, $17086 and $17228.
Looking at the CHOP indicator, we see that in the 4-hour interval, the energy slowly begins to fall, and the MACD indicator indicates a local uptrend.

XRP - USDT on 4H interval Targets and StoplossHello everyone, let's look at the 4H XRP to USDT chart as you can see that the price is moving in a sideways trend channel but locally above the uptrend line.
Let's start by setting goals for the near future that we can take into account:
T1 - $0.3748
T2 - $0.3837
T3 - $0.3925
T4 - $0.4052
and
T5 - $0.4214
Now let's move on to the stop loss in case the market goes down further:
SL1 - $0.3631
SL2 - $0.3556
SL3 - $0.3494
SL4 - $0.3437
and
SL5 - $0.3351
Looking at the CHOP indicator, we see that the energy is strongly charged on the 4H interval, while the MACD indicator indicates a local uptrend.

Daily review of BTC interval 4HHello everyone, let's look at the BTC to USDT chart on a 4-hour timeframe. As you can see, the price is moving below the local downtrend line, but now we can mark a triangle from which the price is close to exit.
Let's start with the support line and as you can see the first support in the near future is $16002, if the support is broken then the next support is $15809, $15646 and $15484.
Now let's go from the resistance line, as you can see the first resistance is $16352, if you manage to break it, the next resistance will be $16473, $16580 and $16674.
Looking at the CHOP indicator, we see that in the 4-hour interval, the energy is gaining strength, the MACD indicator indicates entering a local uptrend, while the volume, although it is not large, indicates that the last four hours are in favor of sellers, however, the volume is much smaller than for the earlier ones with a large majority of buyers.

LTCUSDT 1D Interval - Resistance and SupportHello everyone, I invite you to review the LTCUSDT chart, taking into account the one-day interval, we can see that the price does not record large drops despite the low stability of BTC. The yellow lines mark the uptrend channel.
Looking at the support levels, we can define several levels, first we can define support at $59, then $55, $52, $49, and $45.
Looking the other way, we see first resistance at $63, second at $67, third at $72, and fourth at $88.
Please pay attention to the CHOP index, which indicates that we are gaining more and more energy, the MACD indicator indicates an uptrend, but the volume, although not large, indicates the advantage of sellers.
