Will DOGE switch to the CARDANO network?Hello everyone, let's take a look at the 1D DOGE to USDT chart as we can see the price broke the trend marked with the white line.
Let's start by setting goals for the near future that we can consider:
T1 = $ 0.151
T2 = $ 0.180
and
T4 = 0.260
Now let's move on to the stop loss in case of further market declines:
SL1 = $ 0.134
SL2 = $ 0.117
SL3 = $ 0.105
and
SL5 = $ 0.092
Looking at the CHOP indicator, we can see that in the 1D range, the energy slowly starts to rebound, and the MACD indicator shows a local upward trend.
Fibonaccianalysis

Daily review of BTC interval 4HHello everyone, let's take a look at the BTC to USDT chart over the 4 hour timeframe. As you can see, the price is moving above the local uptrend line.
Let's start with the designation of the support line and as you can see the first support in the near future is $ 20,455, if the support breaks down, the next support is $ 20,286 and $ 20061.
Now let's move to the resistance line as you can see the first resistance is $ 20,659, if you can break it the next resistance will be $ 20,783, $ 20,919 and $ 21,103.
Looking at the CHOP indicator, we can see that in the 4-hour interval we have a lot of energy, and the MACD indicator hits the local downtrend, but the blue line is close to the red crossing from the bottom, which may confirm the trend change.

Chiliz Analysis for Mid-TermHi all.
lets take a look at CHZ altcoin.
according to its growing platform and awsome plans for FIFA World Cup 2020 Qatar.
lets analyze it with Elliot waves:
CHZ starts an impulsive wave from 18 june 2020 and after end its 1st and 3rd wave
its near the end of wave 4th and will start the last 5th wave in coming days.
like you can see in my chart we are completing the B wave of 4th wave and it seems to be
a Zigzag(5-3-5).
after that wave C starts and according to bearish condition of the market i think wave 4th end in
0.16 level , a strong support level near 200MA and 100% level of fibo projection of wave A.
after we reach this level i think wave 5th starts and the target is 0.2280 or more.
if you take a position or purchase CHZ at spot market please dont forget to set a stoploss
below the support level.
wait for the end of wave C and after that you can enter this amazing altcoin.
hope all of you have good trades and protect your capitals.
thanks for reading my idea.
share me your opinion in comments and make me happy.

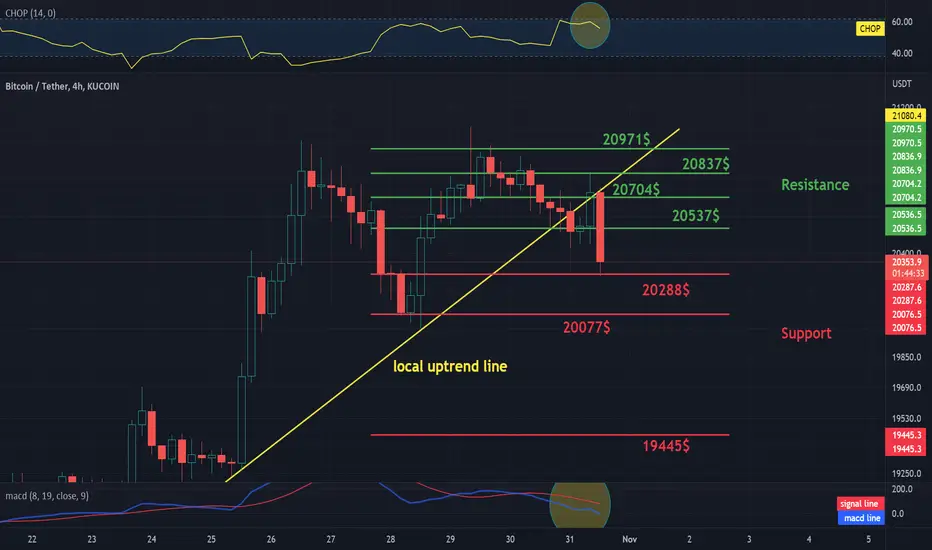
Daily review of BTC interval 4HHello everyone, let's take a look at the BTC to USDT chart over the 4 hour timeframe. As you can see, the price is moving below the local uptrend line.
Let's start with the designation of the support line and as you can see the first support in the near future is $ 20,288, if the support breaks down, the next support is $ 20077 and $ 19,445.
Now let's move from the resistance line as you can see the first resistance is $ 20,537, if you can break it the next resistance will be $ 20,704, $ 20,837 and $ 20,971.
Looking at the CHOP indicator, we can see that we have a lot of energy in the 4-hour interval, and the MACD indicator shows a local downward trend.
BTC Elliott wave countI'll keep it simple wtih this one.
BTC is a 4th corecttion wave, in theory 4th wave needs to touch 1st wave before going down.
In this is idea you can see that 1st wave bottom is in a perfect place for fib 50.
So if 4th wave reacheas 1st wave around 32k and gets rejected on further move up, we can easily expect btc to go down to around 10k.
Good luck and trade safe.
P.s. I'll check how this played out around april 2023.

ADA/USDT TARGETS AND STOPLOSS 1DHello everyone, let's take a look at the 1D ADA to USDT chart as you can see the price is moving in the downtrend channel, however locally above the uptrend line.
Let's start by setting goals for the near future that we can consider:
T1 - $ 0.4047
T2 - $ 0.4267
T3 - $ 0.4499
and
T4 - $ 0.4829
Now let's move on to the stop loss in case of further market declines:
SL1 - $ 0.3986
SL2 - $ 0.3853
SL3 - $ 0.3719
and
SL4 - $ 0.3531
Looking at the CHOP indicator, we can see that in the 1D range the energy has been depleted and is slowly starting to rise, while the MACD indicator shows an upward trend.

SOL - USDT 4HChart, targets and stoplossHello everyone, let's take a look at the 4H SOL to USDT chart as you can see the price is moving below the local downtrend line.
Let's start by setting goals for the near future that we can consider:
T1 - $ 32.87
T2 - $ 33.43
T3 - $ 33.89
T4 - $ 34.29
and
T5 - $ 34.93
Now let's move on to the stop loss in case of further market declines:
SL1 - $ 32.06
SL2 - $ 31.56
and
SL3 - $ 30.17
Looking at the CHOP indicator, we can see that in the 4H range, energy has been used, while the MACD indicator shows a local downward trend.

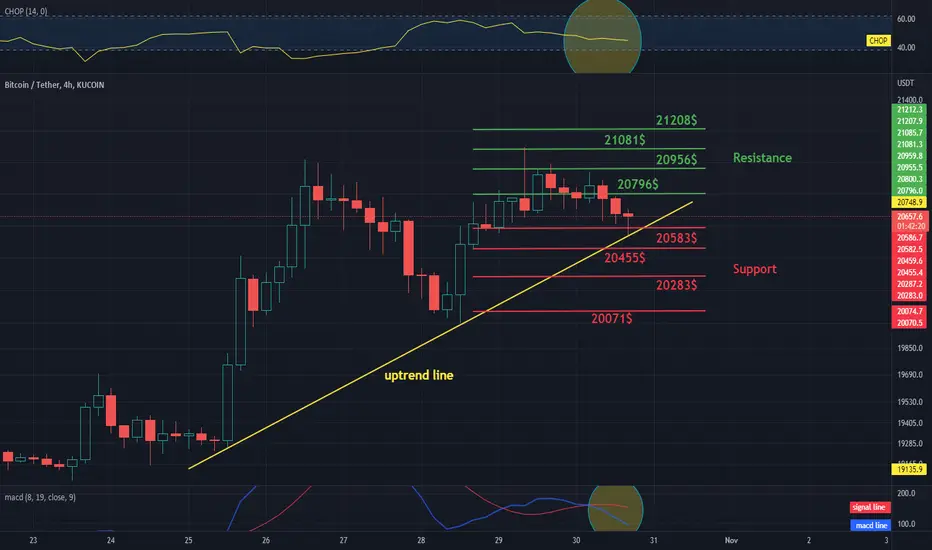
Daily review of BTC interval 4HHello everyone, let's take a look at the BTC to USDT chart over the 4 hour timeframe. As you can see, the price is moving above the uptrend line.
Let's start with the designation of the support line and as you can see the first support in the near future is $ 20,583, if the support breaks down, the next support is $ 20,455, $ 20,283 and $ 20071.
Now let's move from the resistance line as you can see the first resistance is $ 20,796, if you can break it the next resistance will be $ 20,956, $ 21081 and $ 21,208.
Looking at the CHOP indicator, we can see that in the 4-hour interval most of the energy has been used, and the MACD indicator shows a local downward trend.
$WTI #USOIL Can Start To Rise Further, Can Go ParabolicTraders, USOIL has been rising after hitting our FCP zone as below. If 2 conditions of this set up are satisfied, it can start rising parabolically towards 100 again where we have an unfilled gap too. Manage the risk though!
Aug 21:
September 26:
Please support this analysis by liking and sharing. 👍🙂
Rules:
1. Never trade too much
2. Never trade without a confirmation
3. Never rely on signals, do your own analysis and research too
✅ If you found this idea useful, hit the like button, subscribe and share it in other trading forums.
✅ Follow me for future ideas, trade set ups and the updates of this analysis
✅ Don't hesitate to share your ideas, comments, opinions and questions.
Take care and trade well
-Vik
____________________________________________________
📌 DISCLAIMER
The content on this analysis is subject to change at any time without notice, and is provided for the sole purpose of education only.
Not a financial advice or signal. Please make your own independent investment decisions.
____________________________________________________

Daily review of BTC interval 1HHello everyone, let's take a look at the BTC to USDT chart over the 1 hour timeframe. As you can see, the price is moving above the local uptrend line.
Let's start with the designation of the support line and as you can see the first support in the near future is $ 20,710, if the support breaks, the next support is $ 20,588, $ 20,477 and $ 20,298.
Now let's move from the resistance line as you can see the first resistance is $ 20,892, if you can break it the next resistance will be $ 21,065, $ 21,195 and $ 21,321.
Looking at the CHOP indicator, we can see that in the 1-hour interval we have a lot of energy, and the MACD indicator indicates a local downward trend.

ETH - USDT, 1D Interval Targets and Stoploss Hello everyone, let's take a look at the 1D ETH to USDT chart as you can see the price is moving above the downtrend line.
Let's start by setting goals for the near future that we can consider:
T1 - $ 1,632
T2 - $ 1766
T3 - $ 1,904
T4 - $ 2099
and
T5 - $ 2,342
Now let's move on to the stop loss in case of further market declines:
SL1 - $ 1463
SL2 - $ 1,340
SL3 - $ 1,241
SL4 - $ 1142
and
SL5 - $ 997
Looking at the CHOP indicator, we can see that in the 1D range the energy has been used, while the MACD indicator shows a local upward trend.

BNB breaks out the box; reverse H&S may appearBNB broke the box high at 300, but is currently encountering resistance at 307.5.
-
Strategies for breaking out of the box:
You can enter the market after breaking through 300.0, or wait to enter the market after breaking through 307.5.
Take Profit Price:
316.5
326.8
336.8
343.3
Stop loss price:
Box bottom point 256.7
Higher R/R ratio: 275.0
-
If it successfully breaks through 336.8 or the target price of the box, BNB will have a reverse H&S pattern. The strategy at that time is as follows:
(1) Close the long order of the box and using the new funds to make the long order of reverse H&S. The stop loss levels set to 256.7, 275.0 or 300.0; the take profit levels are 395.4, 413.5, 431.6 and 490.2.
(2) Continue the bullish trend after breaking out the box, increase the position; the stop loss and take profit prices are the same as above.
-

How to use Fibonacci Retracement ⁉️ ‼️ Forex traders use Fibonacci retracements to pinpoint where to place orders for market entry, taking profits and stop-loss orders. Fibonacci levels are commonly used in forex trading to identify and trade off support and resistance levels. After a significant price movement up or down, the new support and resistance levels are often at or near these trend lines . Usually the price retracts to 50% or untile OTE (0.62, 0.705, 0.79) before another impulse movement occurs.

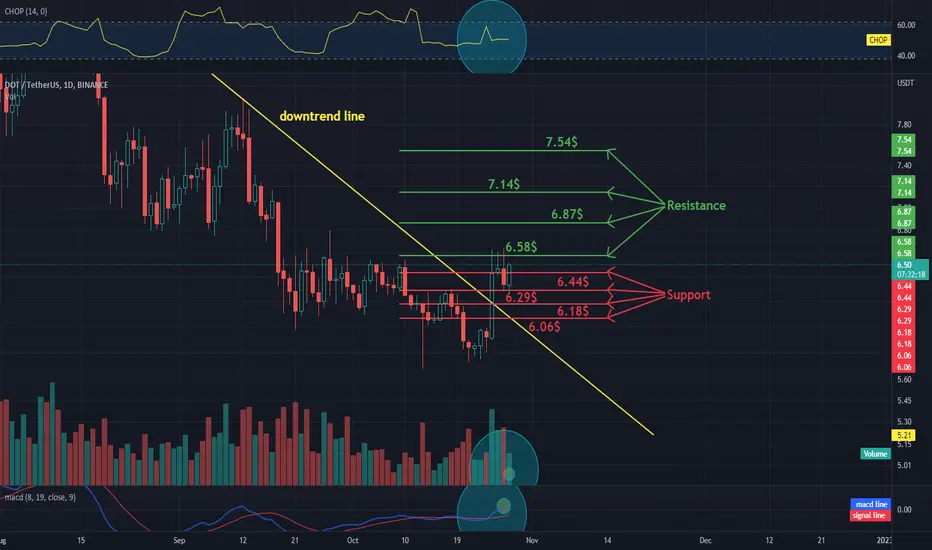
DOT / USDT 1DAY CHARTHello everyone, let's take a look at the DOTUSDT chart on the 1D interval, As you can see the price has broken the downtrend and is currently moving above it.
Let's move on to the designation of maintenance, and as you can see, the first maintenance is six dollars forty-four cents, the second is six dollars twenty-nine cents, the next six dollars eighteen cents, and six dollars six. cents.
In the same way, we will determine the resistance points that price has to overcome. The first resistance is six dollars fifty-eight cents, the second is six dollars eighty-seven cents, the third is seven dollars fourteen cents, and the fourth is seven dollars fifty-four cents.
Please look at the CHOP index which indicates we have some energy left, the MACD shows a local uptrend and we have a rising green candle in volume overnight.
$HSI Hang Seng Index Can Rise Up - Inside and FCP Zone NowTraders, I have been covering indices in depth latetly and what I see a common pattern is that US Indices has started to bounce back. US3 has been gaining for last 3 weeks or so, SnP500 is lower but gaining and NASDAQ is the only one which gained slowest. Hang Send Index (HSI) has reached 2008 levels but forming an M pattern. It is now inside an FCP zone which can push it upwards. Now think about the consequences of that.
Please support this analysis by liking and sharing. 👍🙂
Rules:
1. Never trade too much
2. Never trade without a confirmation
3. Never rely on signals, do your own analysis and research too
✅ If you found this idea useful, hit the like button, subscribe and share it in other trading forums.
✅ Follow me for future ideas, trade set ups and the updates of this analysis
✅ Don't hesitate to share your ideas, comments, opinions and questions.
Take care and trade well
-Vik
____________________________________________________
📌 DISCLAIMER
The content on this analysis is subject to change at any time without notice, and is provided for the sole purpose of education only.
Not a financial advice or signal. Please make your own independent investment decisions.
____________________________________________________

ETH - USDT, 1D Interval Resistance and Support Hello everyone, let's take a look at the ETHUSDT chart on the 1D interval. As you can see, we managed to leave the downtrend channel upwards, and we are currently moving over the local uptrend line.
Now let's move on to the designation of the support line and as you can see the first support where the price is currently at is one thousand five hundred and two dollars, if the support breaks down, the next support is one thousand four hundred and forty dollars, the next one thousand three hundred ninety six dollars and one thousand three hundred and forty three dollars.
Now let's move on to the resistance line, as you can see, the first resistance is sixteen hundred and twelve dollars, if you can break it, the next resistance will be one thousand seven hundred and twelve dollars, the next one is one thousand eight hundred forty-six and two thousand and forty-one dollars.
Please look at the CHOP index, we can see that on the one-day interval, energy is at the very bottom, and the MACD indicates an upward trend.

Daily review of BTC interval 4HHello everyone, let's take a look at the BTC to USDT chart over the 4 hour timeframe. As you can see, the price is moving above the local uptrend line.
Let's start with the designation of the support line and as you can see the first support in the near future is $ 20,211, if the support breaks down, the next support is $ 19,697 and $ 19,486.
Now let's move from the resistance line, as you can see, the first resistance is $ 20,446, if you can break it, the next resistance will be $ 20,678, $ 20,862 and $ 21053.
Looking at the CHOP index, we can see that in the 4-hour interval we can see that we have a lot of energy, the MCAD indicator shows that we are in a local upward trend. It is also worth adding that we currently have a green growth candle after the last three red candles.

BTC short term long; long term doesn't.Four hour chart:
BTC breaks out the box high of 20479.43, and the upper target prices are 21376.53, 21653.65, 21930.76 and 22800.00.
-
Strategies for breaking out of the box:
(1) The stop loss price is set at the low point of the box at 18131.00, and the take profit price is set at the target price mentioned above.
(2) If you want a higher R/R ratio, the stop loss price can be 19028.10 (0.382 support), and the take profit price is the same as above.
-
Daily chart:
BTC is still consolidating in the support range of 19155.86~23123.20, and has not yet broken out the downtrend line.
You can pay attention to the upper resistance price:
22800.00 (target price of the four-hour box)
23123.20
25214.57
If BTC breaks out 25214.57 and the downtrend line, it can be confirmed that the daily chart has turned bullish. Therefore, if BTC does not successfully break out the resistance price in the future, there is still a chance to test around 19000.00 again.
-

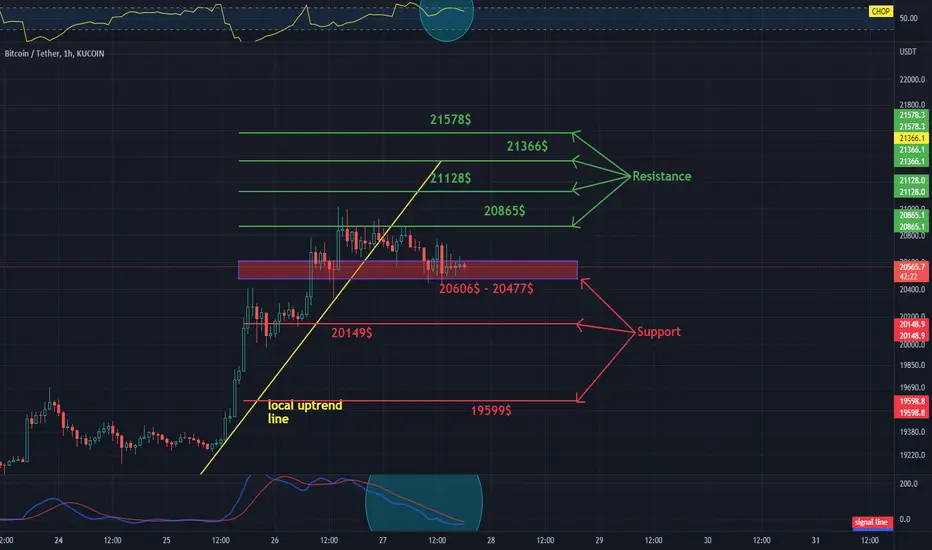
Daily review of BTC interval 4HHello everyone, let's take a look at the BTC to USDT chart over the 1 hour timeframe. As you can see, the price is moving below the local uptrend line.
Let's start with the designation of the support line and as you can see we first have support zones from $ 20,606 to $ 20,477, if the support breaks down, the next support is $ 20,49 and $ 19,599.
Now let's move to the resistance line as you can see the first resistance is $ 20,865, if you can break it the next resistance will be $ 21,128, $ 21,366 and $ 21,578.
Looking at the CHOP indicator, we can see that in the 1-hour interval we have a lot of energy, and the MACD indicator shows a local downward trend.
Daily review of ETH interval 4HHello everyone, let's take a look at the etirum versus the dollar chart over the four hour time frame. As you can see, the price is moving above the local downtrend line.
Let's start with the designation of the support line and as you can see the first support in the near future is one thousand five hundred and two dollars, if the support is broken, the next support is one thousand four hundred and forty-one dollars, one thousand three hundred ninety-five dollars and one thousand three hundred and forty-six dollars.
Now let's move to the resistance line, as you can see, the first resistance is one thousand five hundred and sixty dollars, if you can break it, the next resistance will be one thousand six hundred sixty-one dollars and one thousand seven hundred and ninety dollars.
Looking at the CHOP index, we can see that in the four-hour interval, the energy slowly begins to rise, and the makdi indicator shows a local downward trend.

XRP - USDT on 4H interval Targets and StoplossHello everyone, let's take a look at the 4H XRP to USDT chart as you can see the price is moving above the local downtrend line.
Let's start by setting goals for the near future that we can consider:
T1 - $ 0.4731
T2 - $ 0.4880
T3 - $ 0.5038
T4 - $ 0.5258
and
T5 - $ 0.5534
Now let's move on to the stop loss in case of further market declines:
SL1 - $ 0.4536
SL2 - $ 0.4346
SL3 - $ 0.4203
SL4 - $ 0.4051
and
SL5 - $ 0.3842
Looking at the CHOP indicator, we can see that in the 4H range most of the energy was used, and the MACD indicator shows a local upward trend.

TOMOUSDT - 1hchart - Targets and StoplossHello everyone, let's take a look at the 1H TOMO to USDT chart as you can see the price is moving above the local uptrend line.
Let's start by setting goals for the near future that we can consider:
T1 - $ 0.4382
T2 - $ 0.4555
and
T3 - $ 0.4782
Now let's move on to the stop loss in case of further market declines:
SL1 - $ 0.4244
SL2 - $ 0.4143
SL3 - $ 0.4065
SL4 - $ 0.3988
and
SL5 - $ 0.3877
Looking at the CHOP indicator, we can see that in the 1H range we have more and more energy, and the MACD indicator shows a local downward trend.

The strongest Fibonacci levels📈On each chart, you can see that the price bounces off the levels.📈
These levels can be different.
Every trader knows about the levels.
And many have heard about Fibonacci levels.
Today we will talk about the strongest Fibonacci levels.
-------0.382, 0.5, 0.618, 0.786-------
There are many levels from which the price can react.
But for me, these are the strongest ones.
These levels are correction levels.
The price will often stop when it reaches them.
This is where the correction begins.
How are these levels useful?
If you keep an eye on these levels and use them, over time you will begin to understand where the price is likely to stop.
If you hold some kind of trade, at these levels you will fix all or part of the profit.
In addition, you can open positions from these levels with a high probability of success.
🗠 Chart 🗠
On the BTC chart, you can see the working out of the Fibonacci levels.
After the momentum began, the price, after going some distance, began to adjust.
On January 23, 2021, the correction ended, reaching the level of 0.618.
The price increased by 122% in 86 days.
Yes, at that moment it would be difficult to find this point, because to draw the Fibonacci grid, you need to see the entire momentum.
But I just want you to clearly see where the price reacts.
After the price has formed the top, you could see this level.
When the price started a new correction from the top on April 11, 2021, you could plot the Fibonacci grid and see where the end of the correction is possible.
On June 22, 2021, the price reached the level of 0.618 and bounced up by 138% in 142 days.
If you use these levels in trading, then you most likely expected such a rebound and may even have opened a position.
As you may have noticed, the price reaches the level several times and only then reverses.
In addition, these levels do not assume that the price will turn sharply away from them, sometimes the price goes a little further than them.
Consider these levels as zones from which the price can bounce.
On January 23, 2021, the price formed a bottom and turned around the 0.5 level, which is also considered very strong.
As we can see, the price dropped to the 0.5 level several more times before going further.
There are many such examples on different timeframes.
I advise you to also keep an eye on the 0.786 and 0.382 levels.
They are marked on the chart and you can also often observe price reactions from them.
These levels should not be used alone, it is just another indicator that you can use as a confirmation of your opinion.
Do not try to trade on the basis of only Fibonacci levels.
It is better to use several indicators at once, so the accuracy of the input will be much higher.
Practice finding these levels on the chart and over time you will learn how to profitably use Fibonacci levels.
Thanks.
