Daily review of BTC interval 1DHello everyone, I invite you to the BTC to USDT review on a 1 day interval. Please see that the BTC price was moving in the uptrend channel, then it started to decline and moved in the triangle marked with blue lines.
Currently, we managed to leave the triangle on the top and break the first trend.
Now let's move on to determining the support btc has in the event of a correction, and as you can see, the first support line is at $ 19,713, the second support is at $ 19,029 and the next support is at $ 18,472.
Looking the other way around, we can also mark the points of resistance, and here we can see that the first resistance line is at $ 20,765, the second resistance is at $ 21,492, the third is at $ 22,409, and a strong resistance at $ 25,028 that btc has to overcome so that it could grow to around $ 30,000.
Please note the CHOP index which indicates that most of the energy has been used, while the MACD indicator shows an upward trend.
Fibonaccianalysis

DXYDXY
There will most likely be an upward movement from this level then there will be a downward movement.

Ethereum Looking Like a Bull in a Bear Cave Bear market, lots of shorts were knocked out today....setting the tone here. Which are you? Long or short right now?
I caution leveraged positions at the moment. We are at an extremely dangerous place. Bullish move today, but who did not expect it at some point? Targets to the upside can blow past 2k. This 1500 range could be the top of our relief rally but I doubt it. I can argue a continuation of our breakout, temporarily.. We have seen almost 4 waves post today on quicker candlesticks. The 5th could be the shocker..
My stance is overall bearish periodically NUETRAL, with benefits... Take some profits if your up. I do not think ETH it will fall past 650.00 but we will see. Eth really brings it doesn't it? What's your take on this move ? Let me know!
These Fibonacci Channels are much like other Fib tools, like retracement and extensions. Just anchor them onto two swing lows and a high if measuring bullish movement and inverse that to 2 highs and a low if expecting a bearish movement to manifest. Fib tools are powerful and when combined with an Elliot Analysis can be downright dynamite!
Ask me more if you need to!

BTCUSD Fibonacci Time zonesI have drawn a Fibonacci time zone for each cycle from the top to the point the bottom is reached. After this, the Fibonacci sequence begins to count.
I am starting at the top of 2011 to the bottom at the end of 2011, and these time zones count in vertical black lines.
After this, I drew another Fibonacci time zone from the top of 2014 to the bottom in 2015, and here again, a new count starts and is visible in dashed lines.
Finally, from the top of 2017 to the bottom of 2018, I once again drew a Fibonacci timezone, which is visible in the dotted line. Based on the Elliot Wave principle, in which waves 1, 5, 21, and 89 are cycle peaks, and waves 2, 8, 34, and 144 are complete market cycles.
When I apply this principle to the drawn fib time zone tool described above, I conclude that it gives pretty accurate insight into when possible tops and bottoms are set; each number of each illustrated fib tool is in a different subdivision and grade.
For example, the 3 indicates when the price will reach an all-time high for the first time after a bear market; I marked this in orange.
Red indicates a top of a bull market, and ditto for 13 and 21.
Number 8 shows the bottom of the bear market.
We are again at point 8, where a bottom would be set. In my view, Bitcoin is getting ready for another first impulsive wave of a new trend.
In my Elliott Wave count, in 2019 to 14k wave 1, ABC correction with wave C completed in March 2020. This was followed by an impulsive wave 3 ending in early 2021 and then a truncated fifth in November 2021.

BNB / USDT 4H INTERVAL, STOPLOSS AND TARGETSHello everyone, let's take a look at the BNB to USDT chart over the 4 hour timeframe. As you can see, the price is moving above the local uptrend line.
Let's start with the designation of the support line and as you can see the first support in the near future is $ 284, if the support breaks down, the next support is $ 280, $ 277 and $ 273.
Now let's move to the resistance line as you can see the first resistance is $ 287, if you can break it the next resistance will be $ 297 and $ 306.
Looking at the CHOP indicator, we can see that the energy has been used up in the 4-hour interval, and the MACD indicator shows a local upward trend.

SOL - USDT 4HChart, resistance and support zonesHello everyone, let's take a look at the SOL versus USDT chart over the 4 hour timeframe. As you can see, the price is moving below the downtrend line.
Let's start by marking the support line and as you can see, when the price starts to fall, we have a support zone from $ 28.42 - $ 27.73.
Looking the other way around, the price is currently at the beginning of the resistance zone, which is between $ 28.95 - $ 30.25.
Looking at the CHOP indicator, we can see that in the 4-hour interval we have a lot of energy, and the MACD incidentator indicates that the blue line crosses the red one from the bottom, which confirms the trend shift into an uptrend.

Daily review of BTC interval 4HHello everyone, let's take a look at the BTC to USDT chart over the four hour time frame. As you can see, we are below the trend marked with the white line, and locally the price is above the trend line marked with blue.
Let's start with the designation of the support line and as you can see the first support in the near future is nineteen thousand one hundred seventy eight dollars, if the support is broken, the next support is nineteen thousand forty nine dollars, eighteen thousand eight hundred sixty two dollars and eighteen thousand six hundred forty three dollars.
Now let's move to the line of resistance, as you can see, the first resistance is nineteen thousand four hundred and thirteen dollars, if you can break it, the next resistance will be nineteen thousand five hundred sixty two dollars, nineteen thousand six hundred eighty four dollars and nineteen thousand eight hundred thirteen dollars.
Looking at the CHOP indicator, we can see that in the four-hour interval we have more and more energy, and the MACD indicator shows a local downward trend.

BTCUSD: Bitcoin Prepares for New All-Time High Near $99.4KBy or during Spring 2024, Bitcoin should be near its next destination within the expected price itinerary ($99.4K). After taking a Beary Bad beatdown over the past 8 months, the gloomy sentiment of further capitulation has settled within the minds of many retail traders. Making the timing ripe for the market to feast.
According to the waves we've witnessed from June until now, I on the other hand think that Bitcoin has instead taken all the abuse it will allow from the Bears, for now.
With a 73% reduction in value from its current all-time high at $70K, price action has seemingly formed a vey sharp zig-zag wave downward. Based on my personal wave count from Bitcoin's very first all-time low candle, I think the macro pattern spells out a pending pump for the Digital King.
Forming what I believe to be a Leading Diagonal from June's bottom price at $17.6K and ultimately pushing up to the range of $25K, the Digital Surf Gang and I were totally expecting a deep dive back to the range of $18-$20K for a major test and a likely level of discovered macro support. If I had to be more specific on the expected support level, I'd guess that it comes near $20.1K, in a matter of hours from now. With an apparent Leading Diagonal in Wave 1 (of a hypothetical Wave A), I expect Wave 3 of said Wave A to become extended in form. This extension would likely get Bitcoin back above $40K by October of this year (2022).
Looking beyond the nearest term pump, I believe that Bitcoin will reach the $99.4K mark by Spring of 2024 . As you can see on my chart, though I'm confident that a new all-time high comes, it'll likely only be a big trap as the ascending move would be due to come in corrective form, instead of impulsive. Not too long from now, many traders and investors will better understand why it is better to 🏄 than to #hodl (if they haven't already).

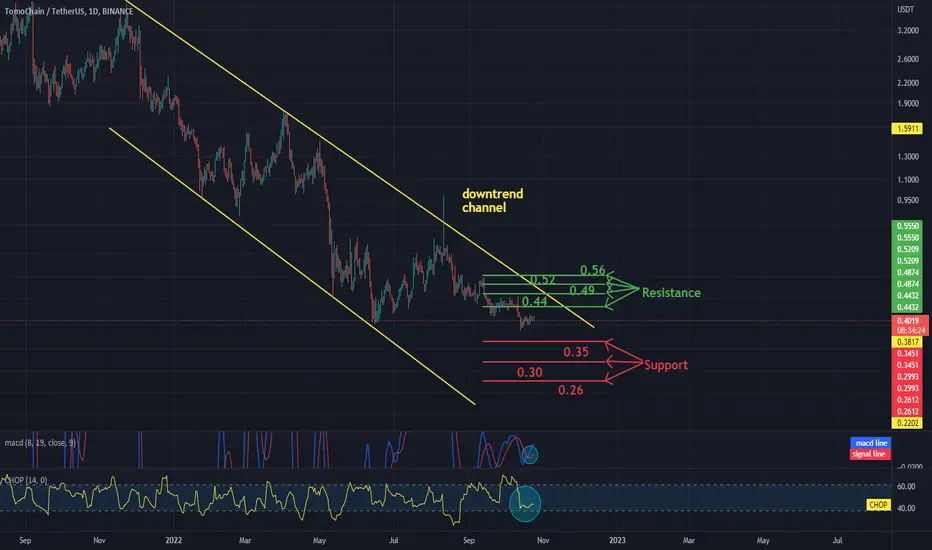
TOMOUSDT - 1dchart - resistance and supportHello everyone, I invite you to review the TOMOUSDT chart on a one-day interval, as you can see the price is moving in the downtrend channel marked by yellow lines.
It can be noticed that currently the price is on the spot of the June low and is slowly starting to accumulate.
Now let's move on to drawing a resistance line that price has on its way, and as you can see, the first resistance is at thirty-five cents, the second resistance is at thirty cents, and the third resistance is at twenty-six cents.
Then we'll look at what resistance TOMO has in its path when it starts to rise, and as you can see, the first resistance is forty-four cents, then forty-nine cents, the next one is fifty-two cents and fifty-six cents.
It is worth paying attention to the CHOP index, which indicates that energy has been used and is in the accumulation phase, and the MACD indicator indicates a local upward trend.
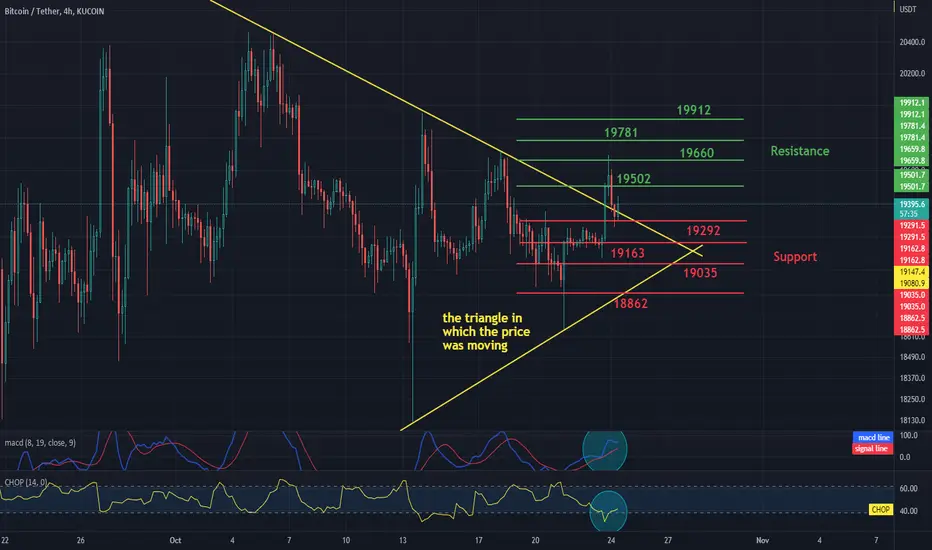
Daily review of BTC interval 4HHello everyone, let's take a look at the BTC to USDT chart over the four hour time frame. As you can see, the price came up from the triangle marked with yellow lines.
Let's start with the designation of the support line and as you can see the first support in the near future is $ 19,292, if the support breaks down, the next support is $ 19,163, 19035 and $ 18,862.
Now let's move from the resistance line as you can see the first resistance is $ 19502, if you can break it the next resistance will be $ 19,660, $ 19,781 and $ 19,912.
Looking at the CHOP indicator, we can see that in the four-hour interval, the energy begins to rise, and the MACD indicator shows a local upward trend.
BNB / USDT 4H INTERVAL, STOPLOSS AND TARGETSHello everyone, let's take a look at the 4H BNB to USDT chart as you can see the price is moving above the local uptrend line.
Let's start by setting goals for the near future that we can consider:
T1 - $ 272
T2 - $ 277
T3 - $ 282
T4 - $ 289
and
T5 - $ 298
Now let's move on to the stop loss in case of further market declines:
SL1 - $ 269
SL2 - $ 267
SL3 - $ 264
SL4 - $ 260
and
SL5 - $ 256
Looking at the CHOP indicator, we can see that in the 4H interval most of the energy was used, and the MACD indicator shows a local upward trend.

DOT / USDT 4H CHART - Resistance and SupportHello everyone, let's take a look at the DOT to USDT chart over the 4 hour timeframe. As you can see, the price is moving above the local downtrend line.
Let's start with the designation of the support line and as you can see the first support in the near future is $ 5.75, if the support breaks down, the next support is 5.67, $ 5.60 and $ 5.53.
Now let's move from the resistance line as you can see the first resistance is $ 5.87, if you can break it the next resistance will be $ 5.96, $ 6.03 and $ 6.10.
Looking at the CHOP indicator, we can see that in the 4-hour interval we have a lot of energy, and the MACD indicator shows a local upward trend.

Daily review of ETH interval 4HHello everyone, let's take a look at the ETH to USDT chart over the 4 hour timeframe. As you can see, the price is moving above the local downtrend line.
Let's start with the designation of the support line and as you can see the first support in the near future is $ 1299, if the support breaks down, the next support is $ 1285 and $ 1275.
Now let's move from the resistance line as you can see the first resistance is $ 1,323, if you can break it the next resistance will be $ 1,342 and $ 1,379.
Looking at the CHOP indicator, we can see that in the 4-hour interval the energy has been used up and the MACD indicator shows a local upward trend.

BTC Speedfan, 2 years later -- similar conceptBTC Speedfan, similar concept just like the speedfan from 2020 --- now 2 years later
Also note the range from Dec 2017 to Oct 2022, closing in on 1800 days (just pointing out how many days have past)

Daily review of BTC interval 4HHello everyone, let's take a look at the BTC to USDT chart over the 4 hour timeframe. As you can see, the price is moving above the local downtrend line.
Let's start with the designation of the support line and as you can see the first support in the near future is $ 19,090, if the support breaks down, the next support is $ 18,984, $ 18,902 and $ 18,822.
Now let's move from the resistance line as you can see the first resistance is $ 19,253, if you can break it the next resistance will be $ 19,340, $ 19,414 and $ 19,486.
Looking at the CHOP indicator, we can see that in the 4-hour interval most of the energy was used, and the MACD indicator indicates a local upward trend.

CRO / USDT 1D Interval- support and resistanceHello everyone, I invite you to a short 1-day CRO / USDT review.
At first, we see that price has been moving along the uptrend for a long time, but from the top to now we are below the downtrend.
Please note that we are moving briefly in the downtrend channel marked with yellow lines.
Now let's move on to determining the support that price has in the event of a further decline, and as you can see, the first support is at ninety-six thousandths of a dollar, another at eighty-seven thousandths of a dollar, seventy-nine thousandths of a dollar, and seventy-two thousandths of a dollar.
Next, we will set the points of resistance in the same way, if the price changes direction and starts to rise. The first resistance is at one hundred and eleven thousandths of a dollar, then at twelve cents, the next one is one hundred and twenty-seven thousandths of a dollar, one hundred and thirty-four thousandths of a dollar, and one hundred and forty-five thousandths of a dollar.
Please look at the CHOP index, which shows that we have more and more energy, and the MACD indicator, which indicates that we have entered an upward trend.

$BABA Can Go Up Watch Out For A BreakoutTraders and Investors, Alibaba (BABA) has completed the typical bubble stock M formation and is now trying to gather orders for a bullish momentum. This stage happens when most investors fall into Despair or hopelessness.
The earnings report is expected, and we have a wedge pattern. If the price breaks above the pattern and we get a confirmation, this can go the first target of M patter which is around 160 but with an intermediate target of approx. 132.
Please support this analysis by liking and sharing. 👍🙂
Rules:
1. Never trade too much
2. Never trade without a confirmation
3. Never rely on signals, do your own analysis and research too
✅ If you found this idea useful, hit the like button, subscribe and share it in other trading forums.
✅ Follow me for future ideas, trade set ups and the updates of this analysis
✅ Don't hesitate to share your ideas, comments, opinions and questions.
Take care and trade well
-Vik
____________________________________________________
📌 DISCLAIMER
The content on this analysis is subject to change at any time without notice, and is provided for the sole purpose of education only.
Not a financial advice or signal. Please make your own independent investment decisions.
____________________________________________________

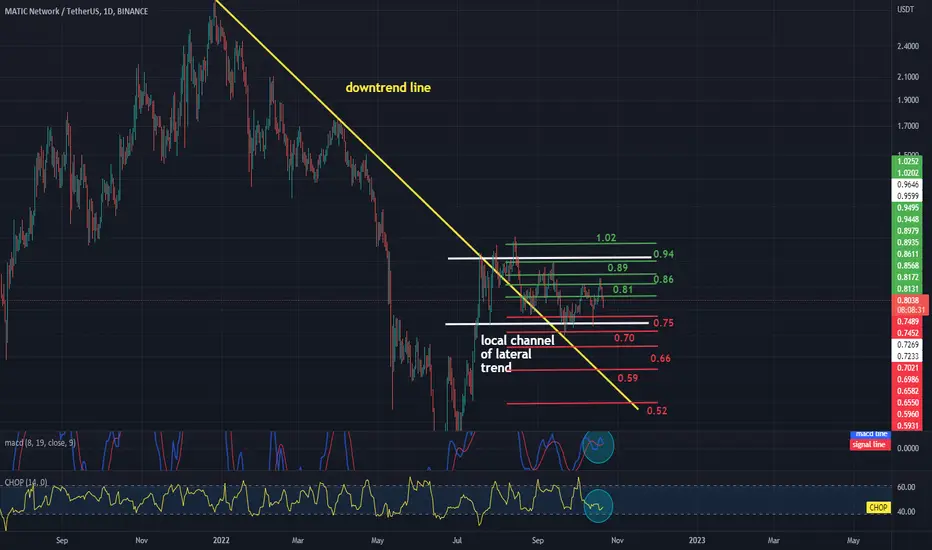
MATIC / USDT 1D chartPlease take a look at the MATICUSDT 1 day chart, as you can see the trend line has broken out and we are currently in the local sideways trend channel.
Now let's move on to the price support line, and as you can see, we have the first support at seventy-five cents, the next support at seventy cents, sixty-six cents, fifty-nine cents, and fifty-two cents.
Now let's see what resistance price has to face, and the first resistance is eighty-one cents, the next one at eighty-six cents, eighty-nine cents, ninety-four cents, and one dollar two cents.
Now please note the CHOP index which indicates that energy has been used up and the MACD indicator shows that we are close to entering a downtrend.
BTC/USDT Revive 1D IntervalHello everyone, I invite you to the BTC to USDT review for 1 day.
First, with yellow lines, we can mark the triangle in which the price has been moving for a long time,
then, using the blue lines, we can similarly calculate a triangle for the price, taking into account the shorter time period.
Now let's check what support we should take into account and as you can see, in the first place we have a support zone from eighteen thousand six hundred ninety three dollars to eighteen thousand one hundred twenty nine dollars, then we can mark the support lines at a price of seventeen thousand five hundred ninety five dollars.
Then, using the Trend Based Fib Extension tool, we will set the points of resistance that BTC must overcome in order to exit the current downward triangle upwards. We have the first resistance at nineteen thousand one hundred and seventy-seven dollars, the second at nineteen thousand five hundred and sixteen dollars, the third at nineteen thousand eight hundred and two dollars, another at twenty thousand seventy-nine dollars, and twenty thousand four hundred and sixty-four dollars.
Finally, let's pay attention to the CHOP index which indicates that the energy is rising again, and the MACD indicator shows a local downward trend.

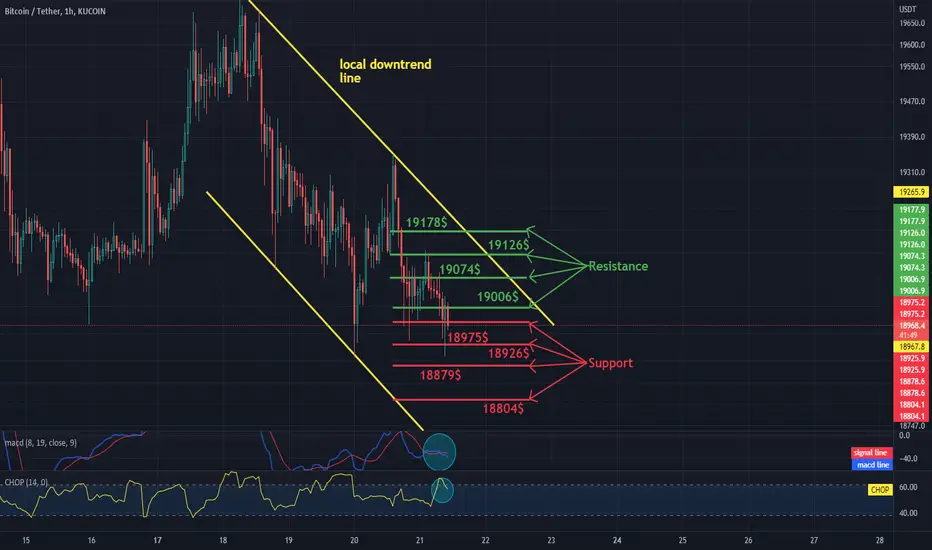
Daily review of BTC interval 1H short-termHello everyone, let's take a look at the BTC to USDT chart over the 1 hour timeframe. As you can see, the price is moving in the downtrend channel.
Let's start with the designation of the support line and as you can see the first support in the near future is $ 18,975, if the support breaks down, the next support is $ 18,926, $ 18,879 and $ 18,804.
Now let's move from the resistance line as you can see the first resistance is $ 19,006, if you can break it the next resistance will be $ 19,074, $ 19,126 and $ 19,178.
Looking at the CHOP indicator, we can see that we still have a lot of energy in the 1-hour interval, and the MACD indicator shows a local downward trend.
FTM / USDT 4H Interval - Targets and ResistanceHello everyone, let's take a look at the 4H FTM to USDT chart as you can see the price is moving below the local downtrend line.
Let's start by setting goals for the near future that we can consider:
T1 - $ 0.1993
T2 - $ 0.2026
T3 - $ 0,2051
T4 - $ 0.2052
and
T5 - $ 0.2117
Now let's move on to the stop loss in case of further market declines:
SL1 - $ 0.1924
SL2 - $ 0.1889
and
SL3 - $ 0.1859
Looking at the CHOP indicator, we can see that in the 4H range the energy slowly starts to rise, while the MACD indicator shows a local downward trend.

Daily review of BTC interval 4HHello everyone, let's take a look at the BTC to USDT chart over the four hour time frame. As you can see, the price is moving above the local uptrend line.
Let's start by designating the support line and as you can see the first prop on which the price is currently at is $ 19,046, if the support breaks, the next support is $ 18,832 and $ 18,524.
Now let's move from the resistance line, as you can see the first resistance is $ 19,144, if you can break it, the next resistance is $ 19,312, the next one is $ 19,432 and $ 19,557.
Looking at the CHOP indicator, we can see that in the four-hour range we still have some energy for the next move, and the MACD indicator shows that we are continuing the local downward trend.

Daily review of ETH interval 4HHello everyone, let's take a look at the ETH to USDT chart over the 4 hour timeframe. As you can see, the price is moving in the sideways channel and locally above the downtrend line.
Let's start with the designation of the support line and as you can see the first support in the near future is $ 1280, if the support breaks down, the next support is $ 1263 and $ 1214.
Now let's move from the resistance line as you can see the first resistance is $ 1299, if you can break it the next resistance will be $ 1309, $ 1318 and $ 1332.
Looking at the CHOP indicator, we can see that there is a lot of energy in the 4-hour interval, and the MACD indicator shows a local downward trend.
