Daily review of BTC interval 4HHello everyone, let's take a look at the battle chart against the dollar, over a four hour time frame. As you can see, the price is moving in the sideways trend channel, marked with white lines.
Let's start with the designation of the support line and as you can see the first support is nineteen thousand one hundred and three dollars, if the support is broken, the next support is eighteen thousand nine hundred twenty nine dollars and eighteen thousand seven hundred and fifteen dollars.
Now let's move from the line of resistance, as you can see, the first resistance is nineteen thousand three hundred and ninety-four dollars, if you can break it, the next resistance will be nineteen thousand six hundred and sixty-six dollars and nineteen thousand eight hundred and ninety dollars.
Looking at the CHOP index, we can see that in the four-hour interval we have a lot of energy, while the makdi indicator shows a local downward trend.
Fibonaccianalysis

DOT / USDT 4H CHART - Targets and Stoploss!Hello everyone, let's take a look at the 4H DOT to USDT chart as you can see the price is moving below the local downtrend line.
Let's start by setting goals for the near future that we can consider:
T1 = $ 6.21
T2 = $ 6.36
and
T3 = $ 6.54
Now let's move on to the stop loss in case of further market declines:
SL1 = $ 6
SL2 = $ 5.99
SL3 = $ 5.91
and
SL4 = $ 5.81
Looking at the CHOP indicator, we can see that in the 4H range we have a lot of energy, while the MACD indicator shows a local downward trend.

Twitter ($TWTR) Can Rise Much Higher, Wait For A BreakoutTraders and Investors, Twitter currently is at an important structure zone. If that zone is broken and confirmed, it can rise much higher to the targets shown in the chart.
Please support this analysis by liking and sharing. 👍🙂
Rules:
1. Never trade too much
2. Never trade without a confirmation
3. Never rely on signals, do your own analysis and research too
✅ If you found this idea useful, hit the like button, subscribe and share it in other trading forums.
✅ Follow me for future ideas, trade set ups and the updates of this analysis
✅ Don't hesitate to share your ideas, comments, opinions and questions.
Take care and trade well
-Vik
____________________________________________________
📌 DISCLAIMER
The content on this analysis is subject to change at any time without notice, and is provided for the sole purpose of education only.
Not a financial advice or signal. Please make your own independent investment decisions.
____________________________________________________

GBPUSD triangle patternfirst target : 1.14400
final Target : 1.14600
but we should hold on to complete flag pattern
i hope be true

XRP / USDT 1daychartWe have an interesting situation on the XRPUSDT, we can see that the price has created a sideways trend channel and is accumulating.
We are currently between the support and resistance zones and very close to the downtrend line from which the price has already tried to break up twice. Attacking the resistance zone again may result in a trend reversal and a further rise in price.

Daily review of BTC interval 4HHello everyone, let's take a look at the BTC to USDT chart over the 4 hour timeframe. As you can see, the price is moving in the sideways trend channel.
Let's start with the designation of the support, and as you can see, we first have a support zone from nineteen thousand four hundred and forty dollars to nineteen thousand two hundred ninety four dollars, and then we have a second zone from nineteen thousand one hundred eighty four to nineteen thousand fifty five dollars.
Now let's move on to the resistance, and as you can see, the first resistance is from nineteen thousand six hundred and seventy-eight dollars to nineteen thousand eight hundred and ninety-eight dollars, and then we have resistance lines at twenty thousand one hundred and twenty dollars.
Looking at the CHOP indicator, we can see that in the 4-hour interval most of the energy has been used and the MACD indicator shows a local upward trend.

Daily review of ETH interval 4HHello everyone, let's take a look at the ETH to USDT chart over the 4 hour timeframe. As you can see, the price moves in the sideways channel and locally above the uptrend line.
Let's start with the designation of the support line and as you can see the first support in the near future is $ 1296, if the support breaks down, the next support is $ 1284 and $ 1275.
Now let's move to the resistance line as you can see the first resistance is $ 1,321, if you can break it the next resistance will be $ 1,339 and $ 1,357.
Looking at the CHOP indicator , we can see that in the 4-hour interval the energy is slowly increasing, and the MACD indicator indicates a local upward trend.

Learn Fibonacci Channel | Classic Fib.Tool
Hey traders,
In this video, I will teach you how to apply Fibonacci channel.
We will discuss theory first.
Then, I will show you how to apply that on a real market example.
❤️Please, support this video with like and comment!❤️


DOT / USDT 4H CHART - Targets and Stoploss!Hello everyone, let's take a look at the 4 hour DOT to USDT chart as you can see the price is moving just above the downtrend line.
Let's start by setting goals for the near future that we can consider:
T1 = $ 6.21
T2 = $ 6.36
and
T3 = $ 6.54
Now let's move on to the stop loss in case of further market declines:
SL1 = $ 6.13
SL2 = $ 6.05
SL3 = $ 6.98
and
SL4 = $ 5.90
Looking at the CHOP indicator, we can see that we have a lot of energy in the 4H range, while the MACD indicator shows a local upward trend.

DXY Fundamental & Fibonacci AnalysisThe Covid-19 pandemic and Russia vs Ukraine war created supply shortages and imbalance in the global economy. In order to balance out the supply & demand and find equilibrium, demand needs to be reduced to meet supply. The way they can achieve this is by hiking interest rates, making things more expensive and making risk assets costly to hold. Until inflation has cooled down, the Federal Reserve will continue to hike interest rates, which means selling of risk assets by smart money in exchange for USD, so they can profit from Dollar strength and high interest rates even when markets are going down, like a safe haven. It is estimated that at least 2 more rate hikes are priced in. If the Fed doesn't hike interest rates before recession it would be disastrous for the economy, it's unfortunate for most of the population but it's tough medicine.
I expect continuation of the uptrend until the fundamental situation changes, which should happen sometime in 2023, possibly at the end of Q1, a year before the Bitcoin halving also. I expect DXY to break the Lower High at 121 and top out at 132, at the Golden Ratio of the previous swing impulse and the -0.272 Fibonacci extension.
If you appreciate my analysis, don't forget to like this post and follow my page. Share your thoughts in the comments. Thank you

DXY (Dollar Index) Full Top-Down Analysis Traders and Investors,
Dollar had a massive run for past year and is now inside an FCP zone. It is kind of stuck between 2 FCP zones and may consolidate there for a bit. On smaller time frames, there are few signs which can give us potential important hints on the next direction. Last week, showed a rejection pattern from the top which is still valid. if the market does not violate that it can still look for downward move at least for the short term. But as it has been very bullish, there may be a period of consolidation. On the other hand, EURUSD also showed a good bounce last week which can also be correlated with it.
On the bearish side of things there are several factors lining up for the dollar:
1. Completion of W pattern
2. price inside FCP zone
3. Trend Line touch a few days ago
4. Weekly divergence building up
As the market conditions are changing fast, risk management is a priority.
Please support this analysis by liking and sharing. 👍🙂
Rules:
1. Never trade too much
2. Never trade without a confirmation
3. Never rely on signals, do your own analysis and research too
✅ If you found this idea useful, hit the like button, subscribe and share it in other trading forums.
✅ Follow me for future ideas, trade set ups and the updates of this analysis
✅ Don't hesitate to share your ideas, comments, opinions and questions.
Take care and trade well
-Vik
____________________________________________________
📌 DISCLAIMER
The content on this analysis is subject to change at any time without notice, and is provided for the sole purpose of education only.
Not a financial advice or signal. Please make your own independent investment decisions.
____________________________________________________

BTC SIMPLY FALL DOWN TO 5500$I don't want to say anything that hasn't been technically analyzed, but based on trend lines and Fibonacci tools, Bitcoin will fall between $5500-5900 and then grow, a huge and strange growth.

Daily review of BTC interval 4HHello everyone, let's take a look at the BTC to USDT chart over the 4 hour timeframe. As you can see, the price moves in the sideways trend channel.
Let's start with the designation of the support line and as you can see the first support in the near future is nineteen thousand and twelve dollars if the support is broken, the next support is eighteen thousand eight hundred dollars, the next at eighteen thousand four hundred seventy five dollars and another eighteen thousand eighty-one dollars.
Now let's move from the line of resistance, as you can see, the first resistance is nineteen thousand two hundred eighty two dollars, if you can break it, the next resistance will be nineteen thousand five hundred sixty four dollars, nineteen thousand nine hundred forty one dollars and twenty thousand four hundred sixty one dollars.
In our current channel, we have moved above the downtrend line
Looking at the CHOP indicator, we can see that in the 4-hour interval the energy has been depleted and the MACD indicator shows a local downward trend.

✅️Bigger Picture: 🟩Eos Long Idea🟩▪︎Earlier we Looked At The #BAT pattern On The Eos/usdt pair, D Time frame,Now wanna Take a Look at The bigger picture.
●In This chart (W) we can See a Giant F.wedge
Which Now we are at The bottom of it!
Also It's considerable as #ABC correction..
And This bottom we are Now is 89% down which is Fib Number as you know.
☆So plan is That BAT pattern I mentioned Last Time at Daily (Which is almost complete) Break
And It starts..
¤There Are 2 options:
1.we Reach Through upper band of The wedge, without breaking and continuing The Pattern
2.Reach The upper band and Break It!
-Either way Profit Is on a Bull Side,and Either Way Long is The only reasonable Option,
So Just Give Bears a little Time To pack a 🎒 and
We are Good to Go👍
Good Luck✌️

Long term review of the XRPUSDT marketHello everyone, I invite you to the XRPUSDT review on a 1-day interval. As you can see in the chart, the price came up from the first channel of the sideways trend and from the first line of the downtrend.
We are currently above the uptrend line, but we can also mark the second channel of the sideways trend.
Now let's move on to the support that xrp has in front of it and we can see that the first support zone is from $ 0.50 to $ 0.46, then we have support lines at $ 0.42, then the support zone from $ 0.39 - 0.35 $ and support at $ 0.29.
Looking in the other direction, we will analogously determine the points of resistance.
We have the first resistance at $ 0.53, the second resistance at $ 0.61, then we have a strong resistance zone that starts at $ 0.69 and continues all the way up to $ 0.93.
It is worth paying attention to the CHOP index which indicates that we have a lot of energy, while the MACD indicator indicates a local downward trend.

1.236 fibo hit and rejects, time to go BULL?Yesterday's news was unexpected. Why? simply because it shot up after dipping down. As usual, there's a zone or area that forces it up. In this case the 1.236% touched and didn't hesitate to close the day with 800+ pips.
As per my previous analysis, now it has closed above the 38% monthly fibo retracement. The daily has also closed above the weekly fibo retracment of 1.236%. The AO is showing divergence with the weekly timeframe, we need to wait for the end of today.
Now what do i do? Follow the news that's always telling something false. Be with people who have fear and greed? Which? Well for me, follow what the market tells you to do. In this case, it's telling me, im ready to go long. But I've got a few things before i decide to be in a trade. To be precise, 3 things now.
1) Wait for the end of today(friday) weekly bar has to close above the 38% Monthly Level. If it does, i will watch next week to break this week's resistance to become support to go LONG. If it doesn't i will do nothing. It needs to be RBS.
2) Watch for today's movement(price action) in smaller time frame(h1-h4) at the 38% Monthly fibo, if the pull back happens and rejects there, i will try to go long. If closes below, i will continue to short.
3) Lastly for whatever reason, If it closes below the 38% monthly fibo, i will continue to stay short.
Follow the market, don't guess. Risk Management your trades.

$EURUSD Can Rise Now #EURUSDTraders EURUSD has been waiting for a good bounce from 0.96387 level which it saw today. Depending on the market close today, if it closes a good strong candle there is a possible positions trade coming in EURUSD which can push the price to much higher-levels completing W patterns at these 2 FCP zones approx. at these levels. This may take weeks and possibly months.
1. 0.99500
2. 1.00500
As the market conditions are changing fast, risk management is a priority.
Please support this analysis by liking and sharing. 👍🙂
Rules:
1. Never trade too much
2. Never trade without a confirmation
3. Never rely on signals, do your own analysis and research too
✅ If you found this idea useful, hit the like button, subscribe and share it in other trading forums.
✅ Follow me for future ideas, trade set ups and the updates of this analysis
✅ Don't hesitate to share your ideas, comments, opinions and questions.
Take care and trade well
-Vik
____________________________________________________
📌 DISCLAIMER
The content on this analysis is subject to change at any time without notice, and is provided for the sole purpose of education only.
Not a financial advice or signal. Please make your own independent investment decisions.
____________________________________________________

Daily review of ETH interval 4HHello everyone, let's take a look at the ETH to USDT chart over the 4 hour timeframe. As you can see, the price is moving in the downtrend channel.
Let's start with the designation of the support line and as you can see the first support in the near future is $ 1275, if the support breaks down, the next support is $ 1267 and $ 1242.
Now let's move from the resistance line as you can see the first resistance is $ 1283, if you can break it the next resistance will be $ 1294 and $ 1302.
Looking at the CHOP indicator, we can see that there is a lot of energy in the 4-hour interval, and the MACD indicator is close to pointing to a downtrend.

GU price actionPlease see chart for
- Anchored notes for Monthly, Weekly, Daily, H4 analysis
- Markups and notes

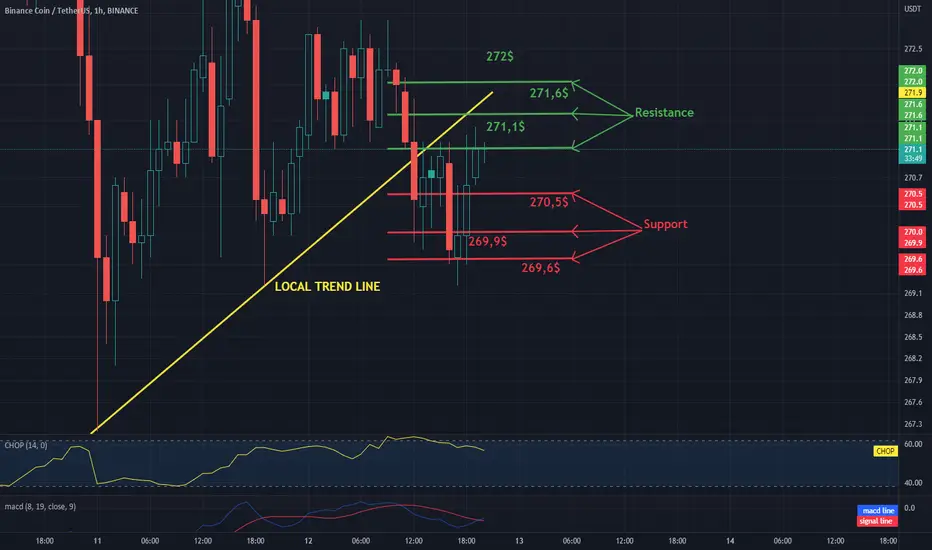
Daily review of BNB interval 1HHello everyone, let's take a look at the BNB to USDT chart over the 1 hour timeframe. As you can see, the price is moving below the local uptrend line.
Let's start with the designation of the support line and as you can see the first support in the near future is $ 270.5, if the support breaks down, the next support is $ 269.9 and $ 269.6.
Now let's move to the resistance line as you can see the first resistance is $ 271.1, if you can break it the next resistance will be $ 271.6 and $ 272.
Looking at the CHOP indicator, we can see that in the 1-hour interval we have a lot of energy, and the MACD indicator shows a local upward trend.
Daily review of ETH interval 1HHello everyone, let's take a look at the ETH to USDT chart over the 1 hour timeframe. As you can see, the price is moving above the local uptrend line.
Let's start with the designation of the support line and as you can see the first support in the near future is $ 1295, if the support breaks down, the next support is $ 1292 and $ 1290.
Now let's move from the resistance line as you can see the first resistance is $ 1298, if you can break it the next resistance will be $ 1300 and $ 1303.
Looking at the CHOP indicator, we can see that in the 1-hour interval we have a lot of energy, while the MACD indicator shows a local downward trend.

USDJPY looking for lift offUS CPI out this week, along with FOMC meeting minutes.
Markets have clearly gone sideways as the bankers meet up and discuss whatever it is that they discuss.
