Nasdaq Elliott Wave ViewOn the left is the weekly close chart of the Nasdaq (No noise, no nonsense) which clearly shows 5 waves down hitting precise Fib retracement levels. These 5 waves are the primary A wave of a Cycle wave 4. (Look at my long term view published some time ago). On the right is a daily bar chart of the recent market drop. 5 waves are clearly identifiable, indicating that we are in an intermediate B wave of the Primary B wave. There may still be a little bit of suffering before this Minute wave 5 of Minor A is over. If you are a dip buyer, this is your moment, also risk/reward is extremely high on the bullish front. More conservative traders should wait for 3 consecutive bullish days. The markets climb walls of worry and quite frankly the inflation number didn't seem so bad to me if you discount the unrealistic expectations that were rumored. Must be said though, that Bonds are signaling possible rate cuts this year and the Eurodollar yield spread says the Fed is going to make a big mistake in the third quarter.
Fibonaccianalysis

ETH / USDT 4HChart - Targets And StopLossHello everyone, let's take a look at the 4H ETH to USDT chart as you can see the price is moving above the local downtrend channel.
Let's start by setting goals for the near future that we can consider:
T1 = $ 1,351
T2 = $ 1,368
T3 = $ 1,382
T4 = $ 1,396
and
T5 = $ 1,416
Now let's move on to the stop loss in case of further market declines:
SL1 = $ 1,304
SL2 = $ 1,284
SL3 = $ 1267
SL4 = $ 1,251
and
SL5 = $ 1,227
Looking at the CHOP indicator, we can see that in the 4H range some energy was used, while the MACD indicator shows a local upward trend.

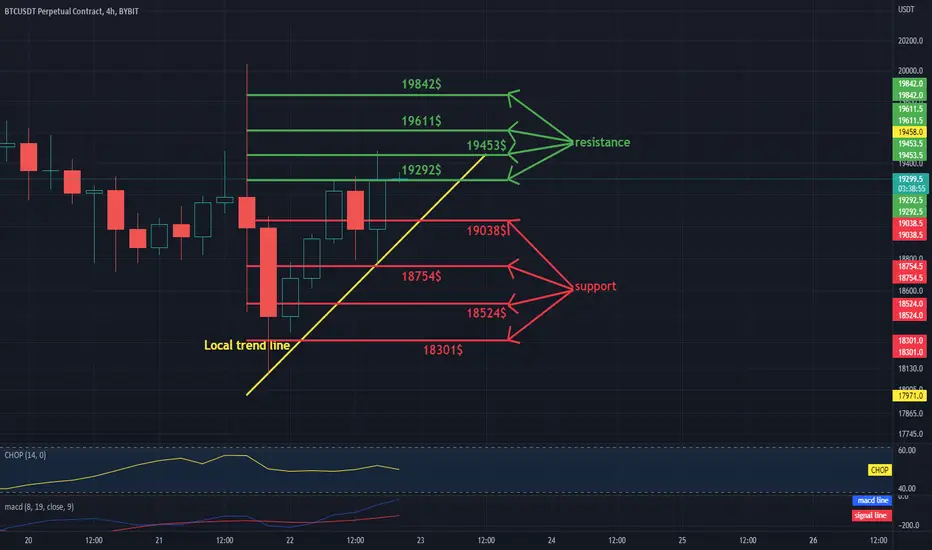
Daily review of BTC interval 4HHello everyone, let's take a look at the BTC to USDT chart over the 4 hour timeframe. As you can see, the price is moving above the local uptrend line.
Let's start with the designation of the support line and as you can see the first support in the near future is $ 19,038, if the support breaks down, the next support is $ 18,754, $ 18,524 and $ 18,301.
Now let's move on from the resistance line, as you can see, the first resistance that price is currently struggling with is $ 19,292, if you can break it, the next resistance will be $ 19,453, $ 19,611 and $ 19,842.
Looking at the CHOP indicator we can see that in the 4-hour interval some energy has been used up, but we have a little bit to continue the movement. On the other hand, the MACD indicator shows a local upward trend.
ETHWUSD - Targets and StoplossHello everyone, let's take a look at the 4H ETHW to USDT chart as you can see the price is moving above the local uptrend line.
Let's start by setting goals for the near future that we can consider:
T1 = $ 5.86
T2 = $ 6.35
T3 = $ 6.78
T4 = $ 7.17
and
T5 = $ 7.78
Now let's move on to the stop loss in case of further market declines:
SL1 = $ 5.56
SL2 = $ 5.21
SL3 = $ 4.93
SL4 = $ 4.64
and
SL5 = $ 4.25
Looking at the CHOP indicator we can see that in the 4H range we have a lot of energy, while the MACD indicator shows the local uptrend.

ETHUSDT - Targets and Stoploss - Interval 4HHello everyone, let's take a look at the 4H ETH to USDT chart as you can see the price is moving above the local uptrend line.
Let's start by setting goals for the near future that we can consider:
T1 = $ 1,357
T2 = $ 1,373
T3 = $ 1,388
T4 = $ 1,401
and
T5 = $ 1,421
Now let's move on to the stop loss in case of further market declines:
SL1 = $ 1,338
SL2 = $ 1,330
SL3 = $ 1,322
SL4 = $ 1,314
and
SL5 = $ 1,303
Looking at the CHOP indicator, we can see that in the 4H range we have more and more energy, while the MACD indicator shows a local upward trend.

Daily review of BTC interval 4HHello everyone, let's take a look at the BTC to USDT chart over the 4 hour timeframe. As you can see, the price is moving below the local downtrend line.
Let's start with the designation of the support line and as you can see the first support in the near future is $ 18,897, if the support breaks down, the next support is $ 18,647, $ 18,409 and $ 18,049.
Now let's move from the resistance line as you can see the first resistance is $ 19,080, if you can break it the next resistance will be $ 19,336, $ 19,523 and $ 19,711.
Looking at the CHOP indicator, we can see that in the 4-hour interval the energy started to rise, while the MACD indicator shows a local upward trend.

Review of the ETH / USDT chart on the 1D intervalHello everyone, let's take a look at the ETH to USDT 1 day chart. It is worth noting that after a long time when the ETH price was moving in the uptrend channel marked in yellow, however, a few days before the MERGE event, the price of eth started to decline and we entered the local downward trend channel marked in blue.
Let's start with the designation of the support line and as you can see the first support where the price is currently at is $ 1317, if the support breaks down and the price goes further down, it has a support zone from $ 1239 to $ 1083 in front of it.
Now let's move from the resistance line, as you can see, the first resistance is $ 1454, if you can break it, we have two zones to go. The first resistance zone is from $ 1564 to $ 1653, while the price eth will break it, another zone is from $ 1707 to $ 1864.
Let's pay attention to the CHOP indicator where we can notice that we have less and less energy for further moves, and the MACD indicator confirms that we are in a downward trend.

ethHello,
ETH has lost my 1 fib extension level & now looks like ETH will hit the 618% fib retracement level, which makes the 5 up an A wave not a wave 1.
If the 5 up nuked into the 786% more quickly I would say that run up to $2,000 in August was a wave 1.
But since seeing 5 up complete I was sus on the W1theory.
If ETH would've complete 3 waves up into a 786% retrace that would've sealed the W1 theory.
So now likely we are in a daily TF zig zag and should look like this chart I'm sharing.

#US10Y #Bonds Can Fall From This FCP ZoneTraders & Investors, US 10 Year Bonds have been on the rise. After a minor correction they rose higher but now they could be approaching an FCP zone which can act as a resistance. We also have Relative Strength Index divergence setting up on weekly time frame.
Out this on your watch list as this can impact stock market, indices and other asset classes due to money flow from this asset class.
Rules:
1. Never trade too much
2. Never trade without a confirmation
3. Never rely on signals, do your own analysis and research too
✅ If you found this idea useful, hit the like button, subscribe and share it in other trading forums.
✅ Follow me for future ideas, trade set ups and the updates of this analysis
✅ Don't hesitate to share your ideas, comments, opinions and questions.
Take care and trade well
-Vik
____________________________________________________
📌 DISCLAIMER
The content on this analysis is subject to change at any time without notice, and is provided for the sole purpose of education only.
Not a financial advice or signal. Please make your own independent investment decisions.
____________________________________________________

The Crypto Commander-In-Chief & The Fibonacci Golden Pocket.No, this is not a "short idea", but rather a look @ previous market tops & the subsequent corrections.
2013 - In November BTC tops out around the $1,163 mark. An awesome %50,000 return if you were lucky enough to buy bitty @ $2 only a few years prior.
Price then corrects a whopping %86.7 & bottoms @ the Fibonacci 0.618 level, a 2-year accumulation period begins.
It took a total of 406 days for BTC to find the bottom, & exactly 1064 days (35 months) from that low till the 2017 high.
2017 - Thanks to Bitfinex and co, the crypto king tops out in December 2017 @ the 20k mark, a 85% correction follows and price bottoms @ the 0.615 Fibonacci level.
An awesome %12,850 jump from the 2015 lows of $155.
It took approximately 364 days for BTC to find the bottom & ironically, 1071 days before the next all time high- only a single week difference from the 2015-2017 low to high period.
2021 - BTC sets a new all time high of $69,000, a truly spectacular rise. To think this was once 0.01 cents is mind boggling.
A cool %2,150 rise from the 2018 lows of around $3,100.
However 74% has already been wiped from its price when it hit the $17,700 mark. This is also the first that BTC drops below the previous all time high.
Price still hovers around the 0.382 Fibonacci level, should that fail, a visit to the 0.5 Fibonacci is on the cards, it also lines up with the failed rally which resulted in the 2019 high.
Should BTC have a similar 84% correction as it has in the past, it would visit once again, the famed Fibonacci Golden Pocket.
The golden pocket has huge volume profile, i have no doubt that long term bulls would be looking for buys from there (provided that it even gets there)
Another thing to note is that, there is roughly a 4 year period between market tops.
In fact, the duration between the 2013 top and the 2017 top was 1470 days (48.32 Months), only 35 days separate the 2017-2021 high to high period of 1435 days (47.17 months).
Should BTC follow a similar cycle, that could potentially mean a new all time high in October 2025.
BTC can even rocket from here, who knows, only time will tell.
Accumulation, mark-up, distribution- Rise and repeat, its been happening for centuries.
My bias remains unchanged, all my posted ideas are long & are suited for long term investors.
Those get rich quick cowboys are more akin to gamblers, not investors.
I believe that this is the time to be accumulating. Dollar cost averaging into your favourite projects certainly is more appealing now then it was a year ago.
Many coins will go to to zero, some may 10x-100x. Having a strategy is key. Do your own due diligence.
After all - “The market is a device for transferring money from the impatient to the patient.” - Warren Buffett.
Hopefully this helps my fellow investors, traders & gamblers.
Good Luck!
Speculative Setup, DYOR.

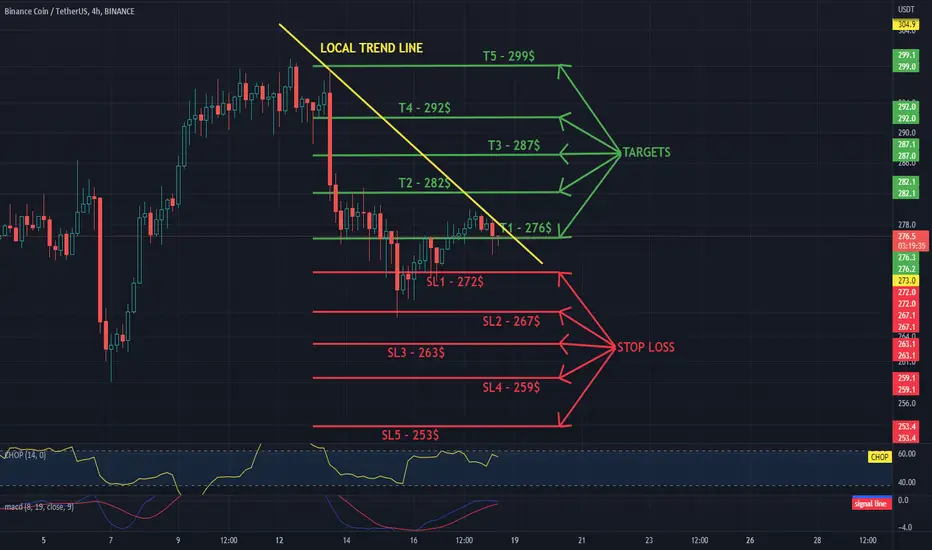
Daily review of BNB interval 4HHello everyone, let's take a look at the 4H BNB to USDT chart as you can see the price is moving below the local downtrend line.
Let's start by setting goals for the near future that we can consider:
T1 - $ 276
T2 - $ 282
T3 - $ 287
T4 - $ 292
and
T5 - $ 299
Now let's move on to the stop loss in case of further market declines:
SL1 - $ 272
SL2 - $ 267
SL3 - $ 263
SL4 - $ 259
and
SL5 - $ 253
Looking at the CHOP indicator, we can see that there is a lot of energy in the 4H range, while the MACD indicator shows the local uptrend.
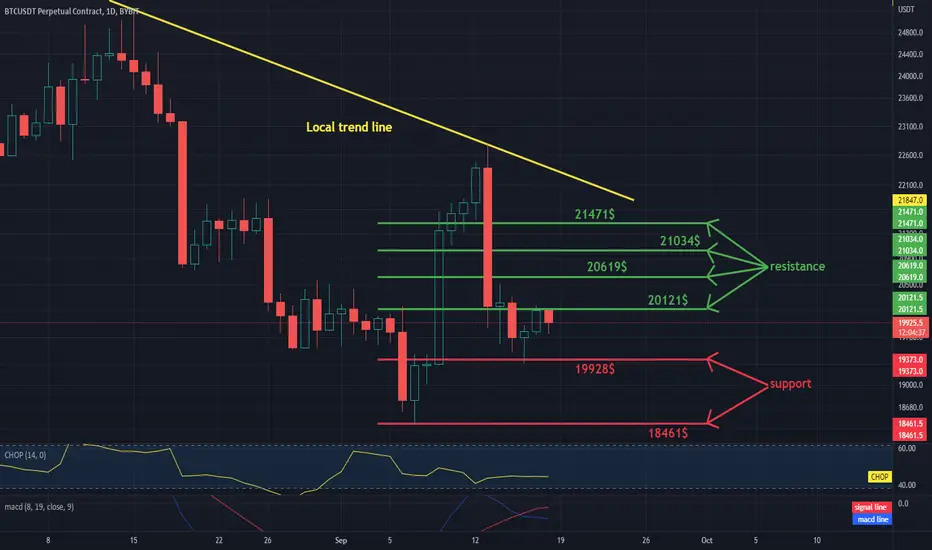
Daily review of BTC interval 1DHello everyone, let's take a look at the BTC to USDT chart on a 1 day time frame. As you can see, the price is moving below the local downtrend line.
Let's start with the designation of the support line and as you can see the first support in the near future is $ 19,928, if the support breaks down, the next support is $ 18,461.
Now let's move from the resistance line as you can see the first resistance is $ 20121, if you can break it the next resistance will be $ 20,619, $ 21,034 and $ 21,471.
Looking at the CHOP indicator, we can see that in the 1-day interval we have little energy and the MACD indicator shows a local downward trend.
Elliott Wave Cheat SheetAlthough Elliott Wave Theory is vast subject and needs in depth study, I'm sharing a cheat sheet for those who have started to learn about the same. This should help them in understanding things better.
Also, try to correlate the cheat sheet with Nifty50 daily chart and be amazed to see how nicely the Elliott wave principles were followed there in the recent wave.
At the same time, please use discretion while following this cheat sheet as this sheet covers only the basic aspects of Elliott Wave principles.
Keep (l)earning and keep sharing!!

Prepare for a drop- Resistance around 51.1 - 52.36
- Support at 27.14 and further at 23.55
Wait for BOS (break of structure) or DROPPPP

MSTRHead & Shoulders pattern here, inside the ending diagonal. The target is around $125 for a truncated 5th. Also the right shoulder has rejected off the 618% perfectly. Timber!

DOT / USDT 4H CHART - targets and stoploss!Hello everyone, let's take a look at the 4H DOT to USDT chart as you can see the price is moving in the local downtrend channel.
Let's start by setting goals for the near future that we can consider:
T1 = $ 7.06
T2 = $ 7.24
T3 = $ 7.40
T4 = $ 7.55
and
T5 = $ 7.77
Now let's move on to the stop loss in case of further market declines:
SL1 = $ 6.76
SL2 = $ 6.62
SL3 = $ 6.44
SL4 = $ 6.28
and
SL5 = $ 6.13
Looking at the CHOP indicator, we can see that there is a lot of energy in the 4H range, while the MACD indicator indicates that we can enter a local upward trend.

XAUUSD STILL BEARISH BELOW 1661.71, TARGET 1635.90XAUUSD is Still in Strong Downtrend.
If Break Below 1661.71, then Bearish Continue To Target 1635.90.
XAUUSD, While Below 1734.12 is Still Bearish.
Resistance at 1689.37.

xauusdxauusd retracement 786 extension target 1.27.looking for a sell on gold stop above the A of fibonacci.

uuuuappears to be in the 5th wave on the daily TF. The 5 up sequence looks good as I measured with a fib extension & have a clean W3 top around the 1.618%. Now run to the top of the expansion channel and test the 2.618% level for a wave 5.

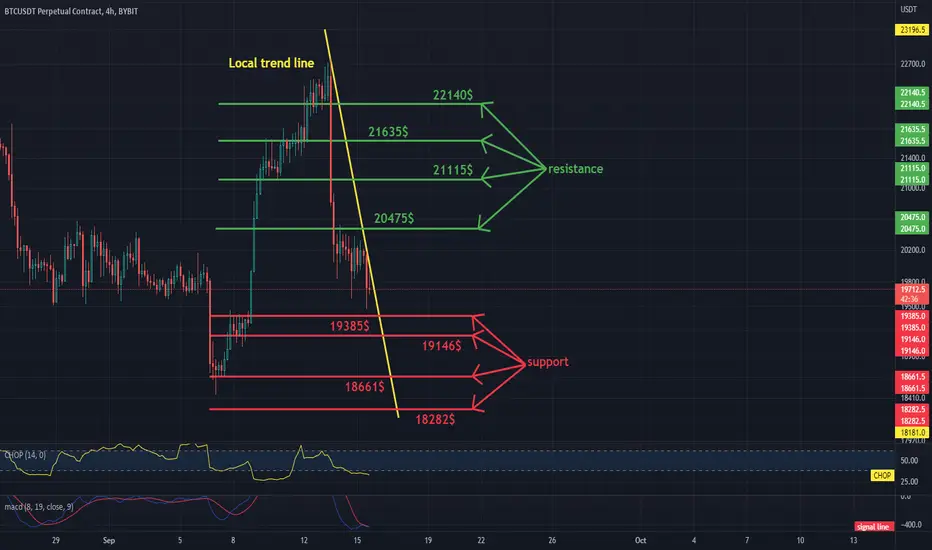
Daily review of BTC interval 4HHello everyone, let's take a look at the BTC to USDT chart over the 4 hour timeframe. As you can see, the price is moving below the local downtrend line.
Let's start with the designation of the support line and as you can see the first support in the near future is 19385$, if the support breaks down, the next support is $ 19,146, $ 18,661 and $ 18,282.
Now let's move from the resistance line as you can see the first resistance is $ 20,475, if you can break it the next resistance will be $ 21,115, $ 21,635 and $ 22,140.
Looking at the CHOP indicator, we can see that in the 4-hour interval the energy has been exhausted and the MACD indicator shows that we can continue the downward trend.
EURCHF BUYPrice looks poised to continue rising by bouncing on broken resistance.
Targets begin at 0.9909 to 1.0020

Crab Harmonic and Head and ShouldersA bearish Crab Harmonic and a Head and Shoulders. These are actuallythe most reliable chart patterns playing out. Some swing traders seriously considering a double top from Alt-Time-High but before this we have an imponent H&S that became valid from the fulfillment of your pullback to the neckline and really more reliable. So, I'm targeting a reliable level at 14.6% of the Fibonacci retracement. As we can see on this daily chart I'm adding a confluent projection from the prior bearish CRAB Harmonic. This extension of Fibonacci ratio is in fact 1.278 wich is the square root of 1.618 from a AB=CD pattern.

Daily review of BTC interval 1DHello everyone, let's take a look at the BTC to USDT chart on a 1 day time frame. As you can see, price is moving above the local uptrend line.
Let's start with the designation of the support line and as you can see the first support in the near future is $ 20107, if the support breaks down, the next support is $ 19,375 and $ 18,442.
Now let's move from the resistance line as you can see the first resistance is $ 20,501, if you can break it the next resistance will be $ 20,938, $ 21,294 and $ 21,666.
Looking at the CHOP indicator, we can see that most of the energy has been used in the 1-day interval, while the MACD indicator shows that we are maintaining an upward trend.
