Update Long-term BTC analysisHi everyone.
Today we have marked an uptrend channel with yellow lines, which has been broken downwards and now the price is below the local downtrend line.
As you can see, we have an important support zone:
- support zone, where the BTC price is currently from $ 20,957 to $ 17,669, if the price drops below the designated zone, we can expect further drops to around $ 12,000.
Then we have the first resistance zone from $ 22,368 to $ 23,058, if we break it, we have a resistance zone from $ 24,696 to $ 26,196. A break from this zone may cause further gains towards the resistance at $ 28,754.
Also noteworthy is the CHOP indicator, which indicates that most of the energy has been used, and the MACD indicator, which indicates that at this moment we have broken the downward trend and we are in an uptrend locally.
Fibonaccianalysis

Daily review of BTC interval 1HHello everyone, let's take a look at the BTC to USDT chart over the 1 hour timeframe. As you can see, the price is moving below the local uptrend line.
Let's start with the designation of the support line and as you can see the first support in the near future is $ 19,090, if the support breaks down, the next support is $ 19,022, $ 18,942 and $ 18,692.
Now let's move from the resistance line, as you can see, the first resistance is $ 19,247, if you can break it, the next resistance will be $ 19393, $ 19509 and $ 19625.
Looking at the CHOP indicator, we can see that we have a lot of energy in the 1-hour interval, and the MACD indicator shows a local downward trend.

ADA/USDT TARGETS AND STOPLOSS 4HHello everyone, let's take a look at the 4H ADA to USDT chart as you can see the price is moving below the local downtrend line.
Let's start by setting goals for the near future that we can consider:
T1 - $ 0.4718
T2 - $ 0.4768
T3 - $ 0.4830
and
T4 - $ 0.5008
Now let's move on to the stop loss in case of further market declines:
SL1 - $ 0.4611
SL2 - $ 0.4524
SL3 - $ 0.4453
SL4 - $ 0.4382
and
SL5 - $ 0.4284
Looking at the CHOP indicator, we can see that in the 4H range, energy has been used, while the MACD indicator shows a local downward trend.

Daily review of ETH interval 4HHello everyone, let's take a look at the 4H ETH to USDT chart as you can see the price is moving below the local downtrend channel.
Let's start by setting goals for the near future that we can consider:
T1 = $ 1,565
T2 = $ 1,585
T3 = $ 1,611
and
T4 = $ 1,643
Now let's move on to the stop loss in case of further market declines:
SL1 = $ 1,514
SL2 = $ 1,485
SL3 = $ 1,462
SL4 = $ 1,439
and
SL5 = $ 1,406
Looking at the CHOP indicator, we can see that in the 4H range the energy slowly starts to rise, while the MACD indicator shows a local downward trend.

Daily review of BTC interval 4HHello everyone, let's take a look at the BTC to USDT chart over the 4 hour timeframe. As you can see, the price is moving below the local downtrend line.
Let's start with the designation of the support line and as you can see the first support in the near future is $ 18,547, if the support breaks down, the next support is $ 18,289, $ 18,092 and $ 17,888.
Now let's move from the resistance line as you can see the first resistance is $ 18,920, if you can break it the next resistance will be $ 19,049, $ 19,415 and $ 19,994.
Looking at the CHOP indicator, we can see that in the 4-hour interval, energy has been consumed, and the MACD indicator shows a local downward trend.

ETHThis chart is what I'm thinking now, this crash from $2,000 back to $1,500 has tested perfectly 382% fib level which is fib retracement level of a typical W4 , also the mid point dotted line of the parallel channel. Now the recent crash yesterday has retraced exactly to 786% which is W2 level. So we are in w2 finishing that up and headed into W3 of the 5 to around $2,600 plus. (possible)

US30 Midweek Intraday Forecast 9/7/22This is a little bit different from my usual. Current looking for an intraday setup on U30. We can see price full respecting 3100, in addition to a bullish trend that is being built on the lower timeframe. If the price action exceeds and closes above the key level marked on the chart, we could start seeing this bullish momentum changing the higher timeframe sentiment. Currently, the smart trade is still short.

Bullish and Bearish Gold WeeklyMultiple time touching at 1680 and bouncing back to 1800 and above range. In this correction it may take below 1680 look like which will take us to 1500 and below. As DXY is very Bullish.
Trend Analysis Fibonacci Multiple Time Frame Analysis XAUUSD Gold goldanalysis fibonaccianalysis Fibonacci Confluence

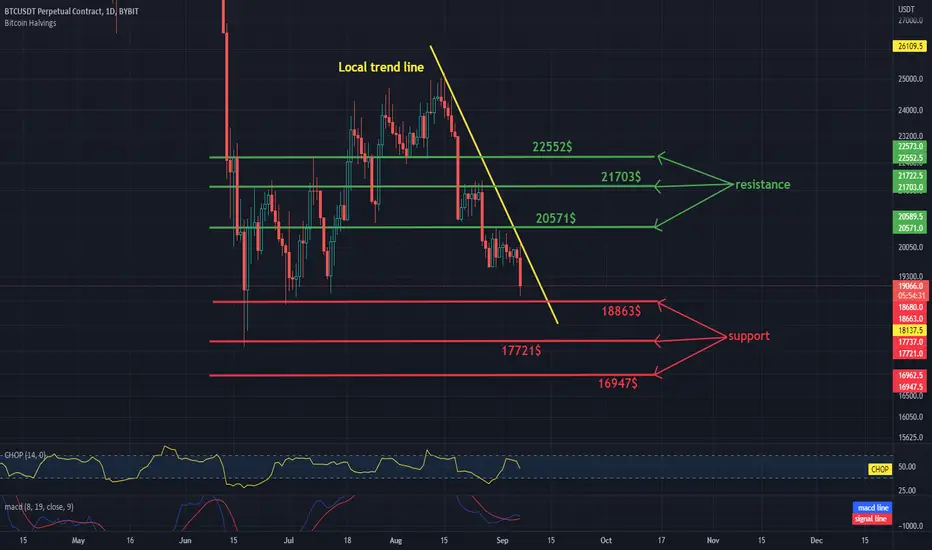
Daily review of BTC interval 1DHello everyone, let's take a look at the BTC to USDT chart over a 1 day timeframe. As you can see, the price is moving below the local downtrend line.
Let's start with the designation of the support line and as you can see the first support in the near future is $ 18,863, if the support breaks down, the next support is $ 17,721 and $ 16,947.
Now let's move from the resistance line as you can see the first resistance is $ 20,571, if you can break it the next resistance will be $ 21,703 and $ 22,552.
Looking at the CHOP indicator, we can see that in the 1-day interval some energy has been used, and the MACD indicator indicates that we are still in an upward trend, but we are approaching a downward trend.
TA 2022-09-06: BTC/USDTBitcoin has been trading near $20K for the past 12 days. More likely $20k will prove to be a false bottom.

$USDJPY Could Be Reaching The Final Bullish TargetTraders, USDJPY has been extremely bullish for last few months and this Forex pair is the one giving most of the strength to DXY (Dollar Index). Now USDJPY could be reaching an FCP zone along with a multi year cross trend line. This can give us the final target for our bullish trades and may also give us good opportunity for short trades depending on a good confirmation at least on the daily time frame.
Rules:
1. Never trade too much
2. Never trade without a confirmation
3. Never rely on signals, do your own analysis and research too
✅ If you found this idea useful, hit the like button, subscribe and share it in other trading forums.
✅ Follow me for future ideas, trade set ups and the updates of this analysis
✅ Don't hesitate to share your ideas, comments, opinions and questions.
Take care and trade well
-Vik
____________________________________________________
📌 DISCLAIMER
The content on this analysis is subject to change at any time without notice, and is provided for the sole purpose of education only.
Not a financial advice or signal. Please make your own independent investment decisions.
____________________________________________________

BTCIf we have the impulsive count of W1 ending diagonal & then W3 should hit the 1.618% around $33k.
Then W4 should test the fob retracement level around $27K for the W4 & after that Wave 5 should be equal to W1 which was big, and can reach $49K plus.
The longer W2 takes to bottom the longer W4 will take to bottom. I expect pump into late Sept & W4 to hit into Oct and wave 5 Nov-EOY.

Bitcoin-analysis by RON and copied by me for training-purposesCopy of Bitcoin analysis from zero to now
- FIB-RETRACEMENTS
- FIB-CHANNELS
- FIB-EXTENSIONS
- PITCHFORKS
- SUPPORT/RESISTANCE
- TREND-CHANNELS
I didn't come to the fib-arcs of circles. After losing time I found out that old coordinates must get other values to keep the right place in chart. Therefore some (red) lines were created by hand (with help of the group)

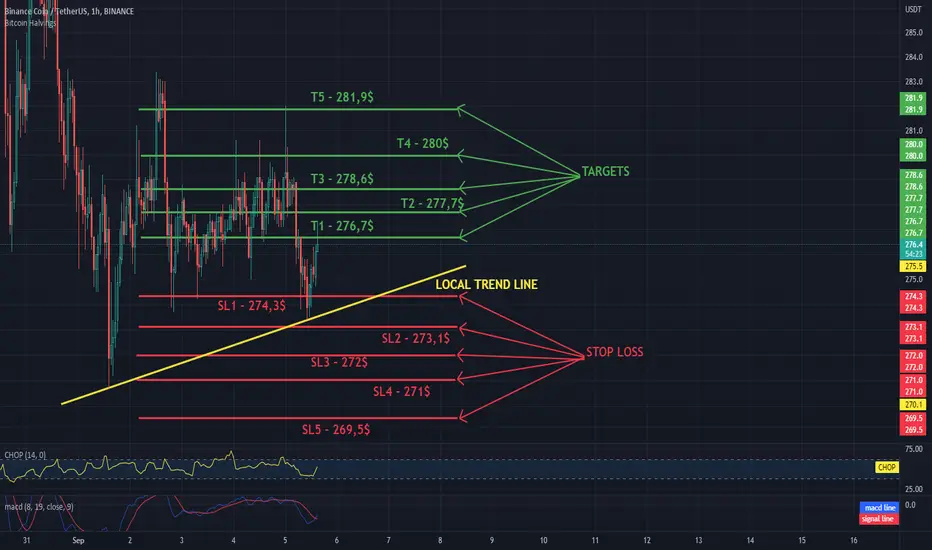
Short-term BNB / USDT analysis on the 1H intervalHello everyone, let's take a look at the 1H BNB to USDT chart as you can see the price is moving above the local uptrend line.
Let's start by setting goals for the near future that we can consider:
T1 - $ 276.7
T2 - $ 277.7
T3 - $ 278.6
T4 - $ 280
and
T5 - $ 281.9
Now let's move on to the stop loss in case of further market declines:
SL1 - $ 274.3
SL2 - $ 273.1
SL3 - $ 272
SL4 - $ 271
and
SL5 - $ 269.5
Looking at the CHOP indicator, we can see that in the 1H range we have more and more energy, while the MACD indicator shows a local upward trend.
Daily review of ETH interval 4HHello everyone, let's take a look at the 4H ETH to USDT chart as you can see the price is moving above the local uptrend line.
Let's start by setting goals for the near future that we can consider:
T1 = $ 1,587
T2 = $ 1,603
T3 = $ 1,620
T4 = $ 1,643
and
T5 = $ 1,672
Now let's move on to the stop loss in case of further market declines:
SL1 = $ 1567
SL2 = $ 1,550
SL3 = $ 1,535
SL4 = $ 1,521
and
SL5 = $ 1501
Looking at the CHOP indicator, we can see that in the 4H range we have a lot of energy, while the MACD indicator shows a local upward trend.

Daily review of BTC interval 4HHello everyone, let's take a look at the BTC to USDT chart over the 4 hour timeframe. As you can see, the price is moving below the local downtrend line.
Let's start with the designation of the support line and as you can see the first support in the near future is $ 19,726, if the support breaks down, the next support is $ 19,624, $ 19,521 and $ 19,386.
Now let's move from the resistance line, as you can see, the first resistance is $ 19803, if you can break it, the next resistance will be $ 19,888, $ 19,916 and $ 19,994.
Looking at the CHOP indicator, we can see that we have a lot of energy in the 4-hour interval, and the MACD indicator shows a local upward trend.

FTM / USDT 4H Interval - Targets and ResistanceHello everyone, let's take a look at the 4H FTM to USDT chart as you can see the price is moving at the high end of the local downtrend channel.
Let's start by setting goals for the near future that we can consider:
T1 - $ 0.2739
T2 - $ 0.2818
T3 - $ 0.2891
T4 - $ 0.2959
and
T5 - $ 0.3053
Now let's move on to the stop loss in case of further market declines:
SL1 - $ 0.2709
SL2 - $ 0.2664
SL3 - $ 0.2604
and
SL4 - $ 0.2430
Looking at the CHOP indicator, we can see that in the 4H range we have a lot of energy and the MACD indicator shows a local upward trend.

Daily review of BTC interval 4HHello everyone, let's take a look at the BTC to USDT chart over the 4 hour timeframe. As you can see, the price is moving above the local downtrend line.
Let's start with the designation of the support line and as you can see the first support in the near future is $ 19,749, if the support breaks down, the next support is $ 19,626, $ 19,524 and $ 19,427.
Now let's move from the resistance line as you can see the first resistance is $ 19,907, if you can break it the next resistance will be $ 20,011, $ 20,124 and $ 20,263.
Looking at the CHOP indicator, we can see that in the 4-hour interval we still have a lot of energy and the MACD indicator indicates a local upward trend.

USDJPY - Bullish Trend Confirmation We've been calling for continued longs here on the USDJPY pretty much all summer (since June) given the confluences on both the technical & fundamental side of things. Our recent pullback trade is working pretty nicely & since we just put in a new structure high (confirming the bullish trend) this week, I wanted to revisit the trade as it setups up for fresh opportunities.
In a continuation trade, each time the trend is confirmed, I like to call it a "fresh break" which essentially means it resets the opportunity to trade. For those already involved this would mean confirming their position & opening the door to risk management tactics & for those who missed it the first time around another chance to get in.
My projection higher still remains at a large zone between 143's & 148's. We currently have a nice level of confluence having structure, an ABCD pattern & a 127 Fibonacci extension level lining up at the lower end of that projection making it the safer choice in my opinion.
If you have any questions about this idea please let me know in the comment section below. And of course I would love to hear your views as well.
Akil

WOOUSDTIt seems to be completing wave 2 of C from the second phase of the double correction
After the completion of wave 2, we can expect a heavy drop in the price of this cryptocurrency

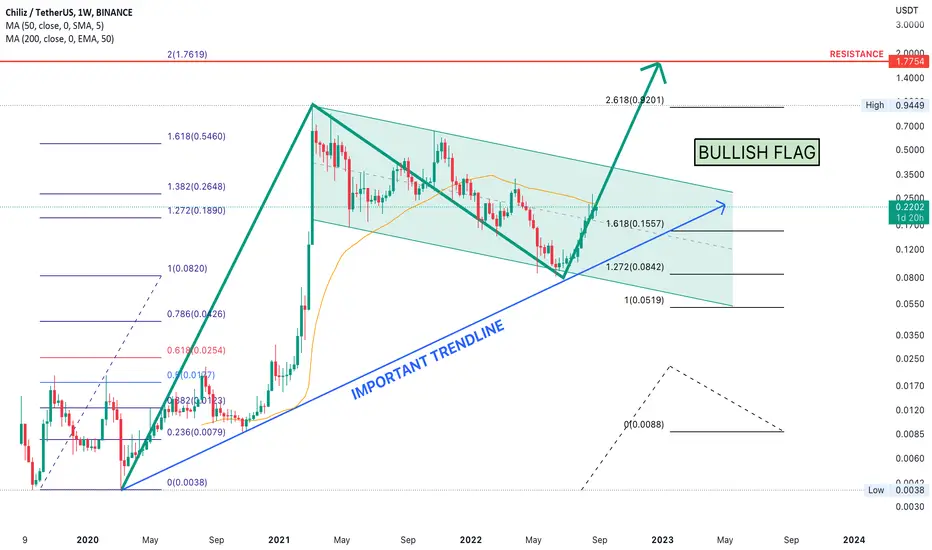
Golden Cross and Bullish Flag, $1.7 On weekly chart,
BINANCE:CHZUSDT has some signals for next bullish to 1.7
#1 - Completed the correction wave at 0.81
#2 - Bullish Flag touched lower channel and bounce back.
#3 - Touched and bounced from Important Trend Line
I figure out target of 5th wave at 1.7 with golden ratio 2.0 Fib from 0.81 which is the 4th wave.
Let's wait and see.
ADA / USDT 1H Interval - Targets and StoplossHello everyone, let's take a look at the 1H ADA to USDT chart as you can see the price is moving in the uptrend channel.
Let's start by setting goals for the near future that we can consider:
T1 - $ 0.5378
T2 - $ 0.5421
T3 - $ 0.5456
and
T4 - $ 0.5490
Now let's move on to the stop loss in case of further market declines:
SL1 - $ 0.5319
SL2 - $ 0.5240
SL3 - $ 0.5178
SL4 - $ 0.5117
and
SL5 - $ 0.5027
Looking at the CHOP indicator, we can see that in the 1H range we still have a lot of energy, while the MACD indicator shows the local uptrend.

Daily ETH to USDT review on 4H intervalHello everyone, let's take a look at the 4H ETH to USDT chart as you can see the price is moving above the local uptrend line.
Let's start by setting goals for the near future that we can consider:
T1 - $ 1,657
T2 - $ 1720
T3 - $ 1,835
and
T4 - $ 1,906
Now let's move on to the stop loss in case of further market declines:
SL1 - $ 1,598
SL2 - $ 1563
SL3 - $ 1,537
SL4 - $ 1,507
and
SL5 - $ 1,468
Looking at the CHOP indicator, we can see that in the 4H range we have a lot of energy, while the MACD indicator shows a local upward trend.
