Daily review of BTC interval 4HHello everyone, let's take a look at the BTC to USDT chart over the 4 hour timeframe. As you can see, the price is moving below the local downtrend line.
Let's start with the designation of the support line and as you can see the first support in the near future is $ 23,177, if the support breaks down, the next support is $ 22,903 and $ 22,681.
Now let's move from the resistance line as you can see the first resistance is $ 23,695, if you can break it the next resistance will be $ 23,942, $ 24,133 and $ 24,326.
Looking at the CHOP indicator, we can see that in the 4-hour interval we have a lot of energy and the MACD indicator shows a downward trend.
Fibonaccianalysis

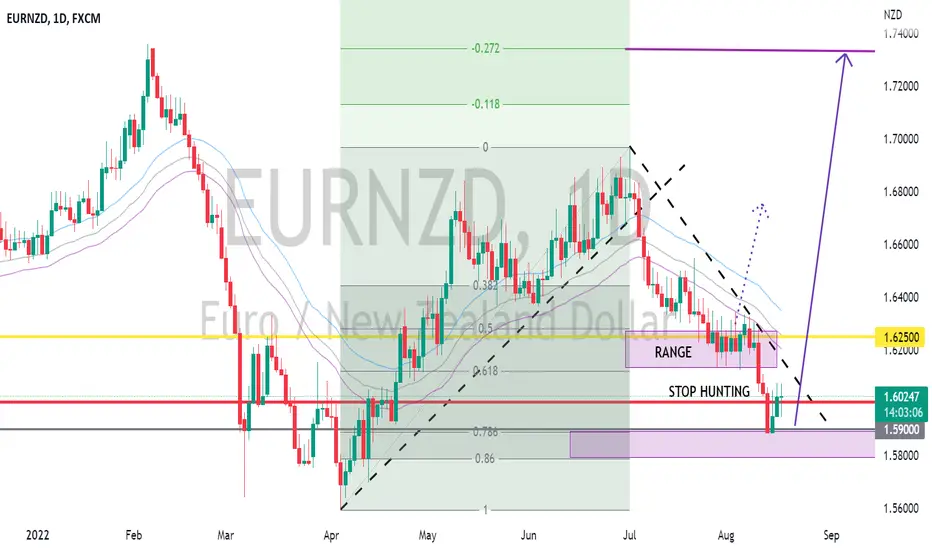
EURNZD LONG OVERVIEW AFTER WHAT LOOKS LIKE STOP HUNTINGPrice stayed for awhile tanging around 1.62000. Also 61.8 retracement level which would have induced retail traders to take long swing positions. The fast drop for 3 days looks like it was a STOP HUNTING Party. We are now Looking to trade it SWING LONG to 1.27 Fib Extension. Our Final TP. Taking smaller positions above the channel as we head to 1.27 Fib LEvel.
ETHLikely starting the HTF W2 now. Looking for $1,269 to hold and then start W3 up to and past $4k EOY

GEOThe crash from ATH's looks about finished, HTF ABC bullish correction. I would think we now impulse 5 up. If that turns into an A wave then there is much more pain. If we do 3 up here and only hit $10 then this would be an X wave and the price action did a fib extension 1 to 1 and would expect much more downside.

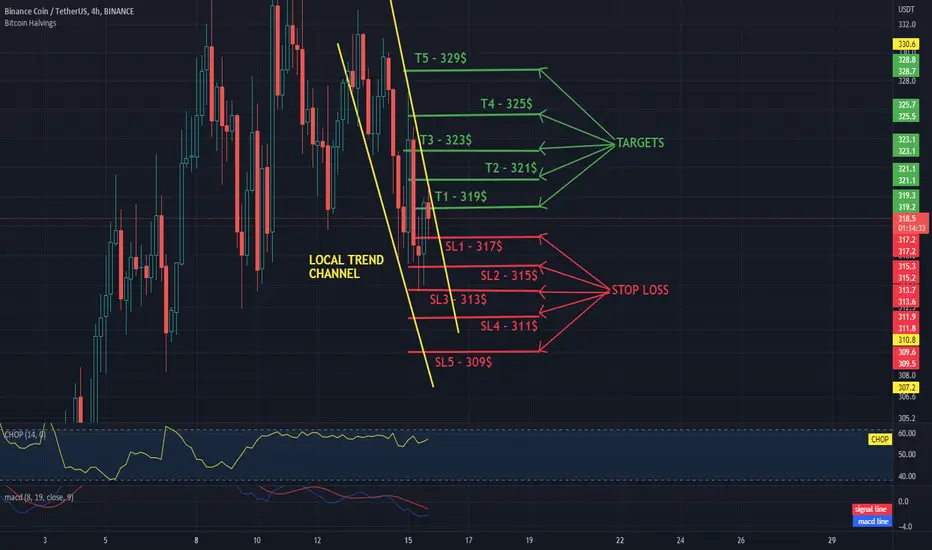
Daily review of BNB interval 4HHello everyone, let's take a look at the 4H BNB to USDT chart as you can see the price is moving in the local downtrend channel.
Let's start by setting goals for the near future that we can consider:
T1 - $ 319
T2 - $ 321
T3 - $ 323
T4 - $ 325
and
T5 - $ 329
Now let's move on to the stop loss in case of further market declines:
SL1 - $ 317
SL2 - $ 315
SL3 - $ 313
SL4 - $ 311
and
SL5 - $ 309
Looking at the CHOP indicator, we can see that there is a lot of energy in the 4H range and the MACD indicator confirms the local downward trend.
Daily review of ETH interval 4HHello everyone, let's take a look at the 4H ETH to USDT chart as you can see the price is moving below the local downtrend line.
Let's start by setting goals for the near future that we can consider:
T1 - $ 1,897
T2 - $ 1,913
T3 - $ 1,926
T4 - $ 1,939
and
T5 - $ 1,957
Now let's move on to the stop loss in case of further market declines:
SL1 - $ 1,880
SL2 - $ 1,864
SL3 - $ 1,847
SL4 - $ 1,823
and
SL5 - $ 1793
Looking at the CHOP indicator, we can see that in the 4H range we have a lot of energy and the MACD indicator shows a local downward trend.

Review of the USD / PLN chart on the 1D intervalHi everyone,
Let's take a look at the USDPLN chart on the 1-day interval.
As you can see, for some time we were moving in the uptrend channel marked by yellow lines, but now we are moving in the local downward trend.
It is worth setting the first support line at 4.54 PLN, and then we have a strong support zone from 4.47 PLN to 4.37 PLN. Looking further, we see another support at the level of PLN 4.24
Now let's move on to the resistance that the USD valuation has on its way and we see that the first resistance appears at 4.64PLN, the next one at 4.68PLN, then we have a strong resistance zone from 4.72PLN to 4.78PLN and the next resistance at 4.86PLN.
Let's look at the Chop indicator which shows that we still have a lot of energy and the MACD indicator shows a local downward trend, but the blue line bends strongly and is close to the intersection of the red line from the bottom, which would confirm the upward trend change.

XMR break or make the zone?!#XMR/USDT
$XMR is inside ascending channel and near to break or make the descending trend line.
🐮 Break out from descending trend line that in 4h time frame price is above it, will increase price to upper trend line and that is the same with the golden zone between 0.5 and 0.618 fib levels of yellow swing down.
🐻 break down from ascending channel and 0.5 fib level of last swing down will drop price to support zone around $130.

ADA (D) Fibonacci & ElliottADA (D) Fibonacci & Elliott
Cardano is involved in its own ascending channel in the daily time frame
Wave 4 is being completed and it is at 0.23 of wave 3
This Fibonacci level with the ceiling of the channel promises the completion of wave 4 and the beginning of micro wave 5 of 2.

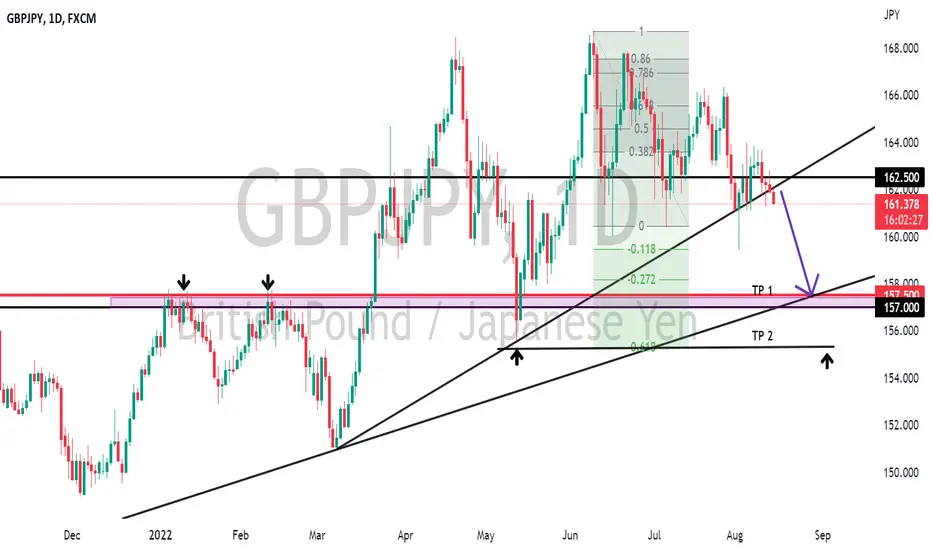
GBPJPY TREND CONTINUATIONLooking for continuation of Trend to 1.618 =TP 2. However, We have Major Support at 157.5. Area to take some profits
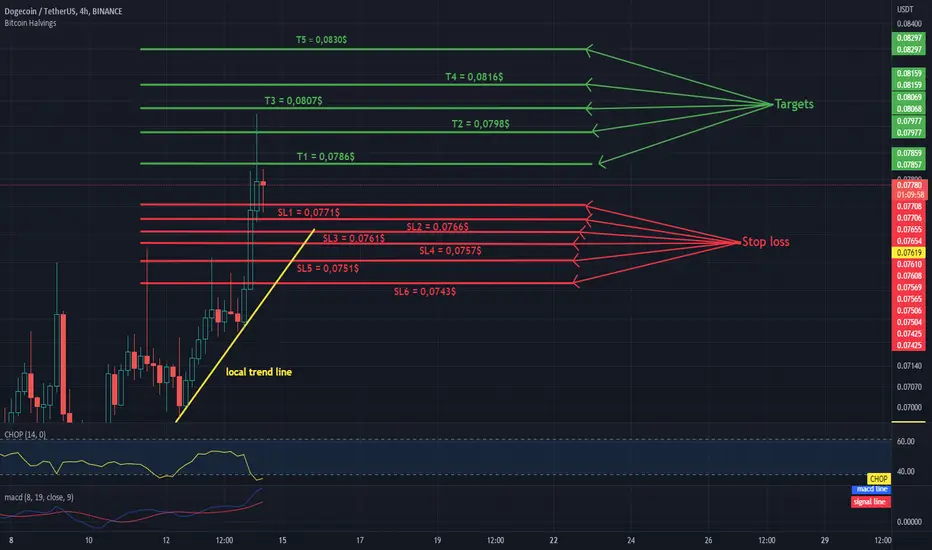
DOGEUSDT - review of the chart on the 4H intervalHello everyone, let's take a look at the 4H DOGE to USDT chart as you can see the price is moving above the local uptrend line.
Let's start by setting goals for the near future that we can consider:
T1 = $ 0.0786
T2 = $ 0.0798
T3 = $ 0.0807
T4 = $ 0.0816
and
T5 = $ 0.0830
Now let's move on to the stop loss in case of further market declines:
SL1 = $ 0.0771
SL2 = $ 0.0766
SL3 = $ 0.0761
SL4 = $ 0.0757
SL5 = $ 0.0751
and
SL6 = $ 0.0743
Looking at the CHOP indicator, we can see that in the 4H range the energy was used and the MACD indicator confirms the local upward trend.
CRO / USDT Short on 1H IntervalHello everyone, let's take a look at the 1H CRO to USDT chart as you can see the price is moving below the local uptrend channel.
Let's start by setting goals for the near future that we can consider:
T1 = $ 0.1548
T2 = $ 0.1555
T3 = $ 0.1560
T4 = $ 0.1566
and
T5 = $ 0.1573
Now let's move on to the stop loss in case of further market declines:
SL1 = $ 0.1541
SL2 = $ 0.1533
SL3 = $ 0.1525
SL4 = $ 0.1521
and
SL5 = $ 0.1516
Looking at the CHOP indicator, we can see that in the 1H range we have very little energy and the MACD indicator shows a local downward trend.

Daily review of BTC interval 1HHello everyone, let's take a look at the BTC to USDT chart over the 1 hour timeframe. As you can see, the price is moving above the local uptrend line.
Let's start with the designation of the support line and as you can see the first support in the near future is $ 24,671, if the support breaks down, the next support is $ 24,563, $ 24,448 and $ 24,088.
Now let's move from the resistance line as you can see the first resistance is $ 24,788, if you can break it the next resistance will be $ 24,938, $ 25,104 and $ 25,311.
Looking at the CHOP indicator, we can see that in the 1-hour interval the energy has been used and the MACD indicator shows a local upward trend.

Long term BTCFrom the high 69k to Covid crash using the Fibonacci Retracement tools we can see that we hit the 0.786 (~17.7K) and bounced.
If we use the Fibonacci levels on the waves up and down we can see some nice confluence in levels.
The first wave down from 69k to ~32.9k has a fib extension 1.618 that lines up with the 0.886 level.
10k-11k range, the strongest support we can get on BTC.
The first corrective wave i-ii fib extension was in confluence with the 0.786 level mentioned at the beginning.
Now we are in the iii-iv wave and I'm not expecting this to go above 32k-33k this should become resistance. And then the final wave down to ~11k should start. If we get there we should also see some bearish divergences on the MACD histogram.
A full reset to the 0.886.
Now technically we never closed below the previous cycle high weekly close.
Maybe this is not a 12345 Wave and this was a ABC correction. Then uptrend has resumed as the ABC finished.
Looking at the BLX at previous corrections we can clearly see some contraction. 93.7%, 86%, 84%, but are we stopping at 74% ?
A closer look

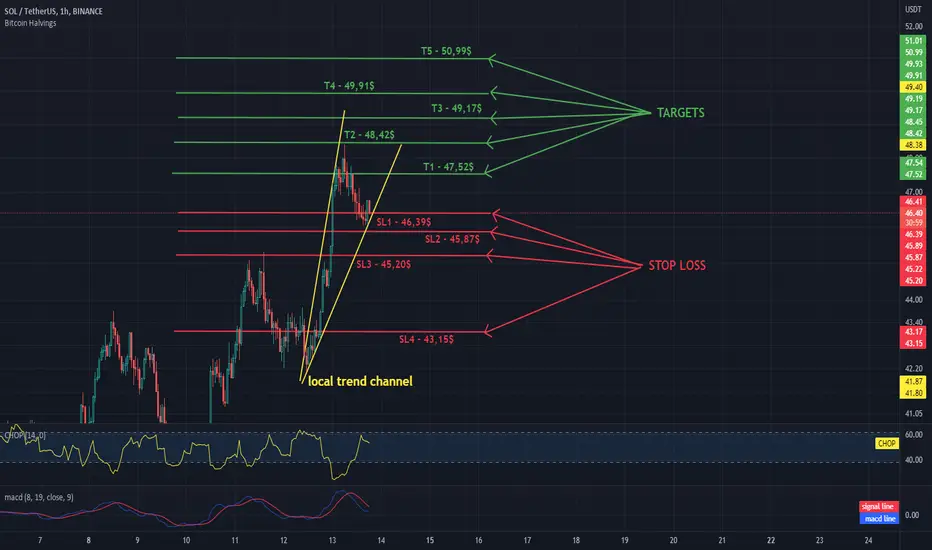
SOL - USDT 1HChart, targets and stoplossHello everyone, let's take a look at the 1H SOL to USDT chart as you can see the price is moving in the channel denoted by the yellow lines.
Let's start by setting goals for the near future that we can consider:
T1 - $ 47.52
T2 - $ 48.42
T3 - $ 49.17
T4 - $ 49.91
and
T5 - $ 50.99
Now let's move on to the stop loss in case of further market declines:
SL1 - $ 46.39
SL2 - $ 45.87
SL3 - $ 45.20
and
SL4 - $ 43.15
Looking at the CHOP indicator, we can see that in the 1H range we still have a lot of energy for further moves, and the MACD indicator shows a local downward trend.
BTC fractal 2019#BTC/USD
$BTC #Fractal from swing low of first of 2019.
⚡️ If BTC closes a weekly candle above 0.5 fib level of last daily swing low, like the swing of 2019 I showed in the chart, price may have repeat that fractal and rise toward 0.5 fib level of the whole swing down around $42k
If you use "Bars Pattern" tool you can understand the similarities better.

Support and resistance zones for DOT / USDTWe managed to exit the downtrend channel marked with blue lines and change it to the current uptrend marked with yellow lines.
It is worth highlighting two areas of support that we have:
The first zone FROM $ 8.81 TO $ 8.24 and the second zone FROM $ 7.36 TO $ 6.78. THEN WE LOOK AT RESISTANCE ZONES AND CURRENTLY WE ARE TESTING A ZONE FROM $ 9.64 TO $ 10.61 IF YOU CAN CHOOSE IT, ANOTHER IMPORTANT RESISTANCE ZONE FROM $ 15.49 - $ 21.30.
IT IS WORTH NOTICE THAT ON A ONE-DAY INTEWRALE WE HAVE A LOT OF ENERGY FOR THE NEXT MOVEMENT AND THAT THE MACD INDICATOR CONFIRMS THE LOCAL IMPROVEMENT TREND.

Daily review of BTC interval 1HHello everyone, let's take a look at the BTC to USDT chart over the 1 hour timeframe. As you can see, the price is moving above the local downtrend line.
Let's start with the designation of the support line and as you can see the first support in the near future is $ 23,743, if the support breaks down, the next support is $ 23,528, $ 23,365 and $ 23,198.
Now let's move from the resistance line as you can see the first resistance is $ 24,127, if you can break it the next resistance will be $ 24,295, $ 24,470 and $ 24,722.
Looking at the CHOP indicator, we can see that in the 1-hour interval we still have a lot of energy and the MACD indicator shows a local upward trend.

[08/12] Beast Trading _ Today's Bitcoin Perspective Beast Trading _ Today's Bitcoin Perspective
Bitcoin continued to be accompanied by buying yesterday, renewing its high point as predicted by the market.
However, since the high-point renewal position is the section where one wave is over, it usually falls after the high-point renewal.
Yesterday, it also renewed its high point and touched the Fibonacci 0.5 section from 32.4k to low point, and showed a decline without breaking through the blue upward trend and parallel channel break.
Before falling, I expected Bitcoin/Etherium to fall by 1 hour in the field room, with my head bent downward from the high point of Divergence Confirmation + 4 hours Stocastic (533). Currently, the 4-hour Stocastic (533) is coming back to the bottom and looking for a rebound.
The market picture is 4 hours/per-bill, and the important support/resistance line in the big frame is
The bottom line of the channel following the red circle is the support line,
Resistance lines are green Fibonacci 0.618 (26750), 0.786 (29240), 0.886 (30710)
Parallel channel break line 25300
Parallel channel top line 27300
It's going to be about 25400 blue uptrend.
+ dominance
Additionally, the Dominion continues to fall, and if there had been a sideways or additional rise from yesterday's high, the Alt's full-fledged pumping would have begun, but the decline has been stronger than expected, so it is ambiguous.
You'd better wait and see before proceeding with the altcoin trading.

BTC weekly fib levels#BTC/USDT
$BTC Fibonacci levels show that the price now faced a crucial resistance zone.
🐮 Break out from 0.5 fib level of the daily swing down (yellow fib), can pump the price toward 0.382 and 0.5 fib levels of the weekly swing down.
🐻 And rejection from the current resistance zone will cause a correction to $21k or maybe lower.
also in the short-term time frame price shaped rising wedge which is a bearish pattern(review my last analysis).

BTC 8/11Currently holding a bearish position. BTC should test the bottom gap 19k-21k then rebound all the way to 28k flying through the 24-28 gap. First 24 to 21 then potentially 19. Potential dump tomorrow maybe, the sooner I can begin my master btc plan the better.

ETH_In correction (elliot_wave_analysis)
hello everyone
I was wrong about wave four from the last chart August 7th.
Now we have reached the Fibonacci level from wave 1. In my opinion, ETH will make a correction to around $1360 in the near future.
like and updates follows.
Peace and out.

SOL - USDT 1HChart, targets and stoplossHello everyone, let's take a look at the 1H SOL to USDT chart as you can see the price has come sideways from the uptrend channel.
Let's start by setting goals for the near future that we can consider:
T1 - $ 44.85
T2 - $ 45.73
T3 - $ 46.47
T4 - $ 47.2
and
T5 - $ 48.23
Now let's move on to the stop loss in case of further market declines:
SL1 - $ 43.56
SL2 - $ 43.02
SL3 - $ 42.48
SL4 - $ 41.68
and
SL5 - $ 40.72
Looking at the CHOP indicator, we can see that in the 1H range we have more and more energy and the MACD indicator shows a local downward trend.
