From Leonardo to Trading: The Evolution of Fibonacci LevelsIn the labyrinthine landscape of financial markets, where volatility reigns supreme and uncertainty lurks around every corner, traders seek reliable navigational tools to steer through the tumultuous waters of price movements. Among the myriad techniques at their disposal, Fibonacci analysis emerges as a stalwart companion, offering a nuanced understanding of market dynamics rooted in mathematical precision. In this comprehensive exploration, we delve deep into the multifaceted realm of Fibonacci levels, unraveling their historical significance, evolutionary trajectory, practical applications, and the diverse perspectives that shape their interpretation.
Tracing the Roots:
To appreciate the profound impact of Fibonacci analysis on modern trading methodologies, a journey back in time to the 13th century is warranted. It was during this epoch that Leonardo of Pisa, known colloquially as Fibonacci, unveiled a numerical sequence that would transcend mathematical realms and find profound resonance in the domain of financial markets. Beginning with 0 and 1, each subsequent number in the sequence is the sum of the two preceding ones, laying the groundwork for a sophisticated understanding of market movements rooted in the natural order of mathematics.
Evolution in Financial Analysis:
While Fibonacci himself might not have envisaged the application of his sequence in financial markets, the 20th century witnessed a paradigm shift as visionaries such as Ralph Elliott and Robert Prechter pioneered its integration into trading methodologies. Elliott's Wave Theory, with its emphasis on repeating patterns and sequences, forged an intriguing connection with Fibonacci numbers, laying the groundwork for a symbiotic relationship between mathematical principles and market analysis. This union catalyzed a renaissance in technical analysis, ushering in an era where Fibonacci levels became indispensable tools in the arsenal of traders worldwide.
Unveiling Fibonacci Retracement Levels:
At the heart of Fibonacci analysis lies the concept of retracement levels, a cornerstone of technical analysis that echoes the natural order observed in the Fibonacci sequence. These levels, including 23.6%, 38.2%, 50%, and 61.8%, serve as pivotal markers in identifying potential zones of price reversal, offering traders valuable insights into market sentiment and trend dynamics. By applying the Fibonacci retracement tool to significant highs and lows, traders gain a nuanced understanding of market psychology, discerning the underlying rhythm of price movements amidst the chaos of market fluctuations.
Venturing into Fibonacci Extension Levels:
Beyond retracement levels, Fibonacci extension levels offer a panoramic vista into the future trajectory of price movements, illuminating the path for traders seeking to navigate the complexities of trending markets. With extensions such as 161.8%, 261.8%, and 423.6%, traders can delineate potential targets for price continuation after a correction, harnessing the mathematical harmony inherent in the Golden Ratio to set profit targets and manage risk effectively. These extension levels, rooted in the timeless principles of Fibonacci analysis, serve as guiding beacons for traders navigating the ever-shifting tides of financial markets.
Practical Applications and Precautions:
While Fibonacci levels furnish traders with a potent framework for analysis, it is essential to exercise caution and supplement Fibonacci analysis with corroborating indicators and risk management strategies. By integrating tools such as Moving Averages, Relative Strength Index, and candlestick patterns, traders can enhance the robustness of their trading decisions, mitigating the inherent uncertainties of financial markets and maximizing the efficacy of Fibonacci analysis.
A Tapestry of Perspectives:
As we reflect on the journey of Fibonacci levels through the annals of financial history, we encounter a tapestry of perspectives that weave together to form a rich tapestry of knowledge and insight. From Larry Pesavento's exploration of harmonic price patterns to Philip Carret's pioneering work in long-term investing, the legacy of Fibonacci continues to inspire and guide traders in their quest for market mastery. These diverse perspectives underscore the enduring relevance of Fibonacci analysis in an ever-changing landscape, reaffirming its status as a timeless ally in the pursuit of profit and prosperity.
Conclusion:
In conclusion, the comprehensive exploration of Fibonacci analysis reveals its enduring significance as a cornerstone of technical analysis in financial markets. From its humble origins in the mathematical treatises of Leonardo of Pisa to its integration into modern trading methodologies, Fibonacci analysis embodies the timeless principles of mathematical harmony and market psychology. As traders navigate the labyrinthine paths of price movements, they find solace in the elegant simplicity of Fibonacci analysis, a steadfast companion in their quest for success amidst the ever-shifting currents of financial markets.
Thank you for reading! I hope this article proves to be interesting for all of you!
Fibonaccianalysis

The Art of FibonacciBitcoin has been on the rise, and I would like to share my Master Fib.
This angled fibonacci structure encompasses the entirety of Bitcoin's history
and can be used to help discover price action patterns,
facilitating future trade decisions.
The chart can be useful on both logarithmic and linear price scales.
This idea highlights the fib structure on the log scale.
This particular fibonacci-based structure utilizes the following levels :
0, 0.214, 0.236, 0.35, 0.382, 0.5, 0.618, 0.65, 0.764, 0.786, and 1,
and extends 20 levels above and below 0.
The core channel from which the structure is built is established using the following 3 points:
These 3 points create the core channel of the master structure:
The final version of this chart has been optimized for, and makes use of, the 10 day timeframe.
While I personally prefer using this chart on a smaller timeframe for everyday use,
the 10 day timeframe was chosen as a suitable balance of factors, including the following:
maximizing the amount of bitcoin historical data and fib data displayed
maximizing chart clarity at all zoom levels
maximizing visibility of price action reactions
maximizing published idea usefulness lifespan
When viewing the fib structure on alternate timeframes,
reactions in price can be seen as high as the monthly timeframe,
all the way down to the 1 minute timeframe.
Utilizing various timeframes can help display more pronounced, obvious, or acute reactions to fib levels.
1day price action fib reaction (April 2018 - July 2019)
1hour price action fib reaction (April 3/4 2022)
1min price action fib reaction (March 5 2024 - 5 days ago)
Even on the 10 day timeframe, reactions can be seen as far back as December 2009... bouncing off the 6.214!
There are many such reactions to this fib structure throughout the entire history of bitcoin.
What's amazing is that the 3 points used to create the structure are from December 2017 to November 2021!
So, let's take a quick look at some of the reactions in price to some of the various fib levels.
Doing this will add validity to the effectiveness and usefulness of the fibs.
And finally, here's a look at where we are today, on the linear scale, just before the 10day candle close:
Now that we have established some validity of the fib structure, we can use it to help us make future trading decisions, particularly when the price of bitcoin approaches, rejects, breaks through, or retests the various levels.
Does, and will, bitcoin always react to every level? No.
But I think this is one of the best bitcoin fib structures I've seen that encompasses every single displayed candle while maintaining such accuracy and effectiveness.
Its influence on the bodies and wicks of past and present candles can be seen.
I think it is likely to guide and influence future candles.
I estimate that the further above or below that price is from the core channel,
the less accurate and influential the levels and angles will be.
I also estimate that the further away we are, in time,
from the 3 points that build the core channel,
the less accurate and influential the levels and angles will be.
That being said, we, being humans, only have so many 10 day candles left, so... yeah.
*Bonus*
Keep zooming into the light
(on the chart)
Thank you for checking out my idea!
I hope that you like it and find it useful.
If you do, please give it a boost.
And feel free to comment.
//Durbtrade

Disney Rejected 38.2% Fibo but Upside IntactStratos Markets Limited (www.fxcm.com):
CFDs are complex instruments and come with a high risk of losing money rapidly due to leverage. 66% of retail investor accounts lose money when trading CFDs with this provider. You should consider whether you understand how CFDs work and whether you can afford to take the high risk of losing your money.
Stratos Europe Ltd (trading as “FXCM” or “FXCM EU”), previously FXCM EU Ltd (www.fxcm.com):
CFDs are complex instruments and come with a high risk of losing money rapidly due to leverage. 70% of retail investor accounts lose money when trading CFDs with this provider. You should consider whether you understand how CFDs work and whether you can afford to take the high risk of losing your money.
Stratos Trading Pty. Limited (www.fxcm.com):
Trading FX/CFDs carries significant risks. FXCM AU (AFSL 309763). Please read the Financial Services Guide, Product Disclosure Statement, Target Market Determination and Terms of Business at www.fxcm.com
Stratos Global LLC (www.fxcm.com):
Losses can exceed deposits.
Any opinions, news, research, analyses, prices, other information, or links to third-party sites contained on this video are provided on an "as-is" basis, as general market commentary and do not constitute investment advice. The market commentary has not been prepared in accordance with legal requirements designed to promote the independence of investment research, and it is therefore not subject to any prohibition on dealing ahead of dissemination. Although this commentary is not produced by an independent source, FXCM takes all sufficient steps to eliminate or prevent any conflicts of interests arising out of the production and dissemination of this communication. The employees of FXCM commit to acting in the clients' best interests and represent their views without misleading, deceiving, or otherwise impairing the clients' ability to make informed investment decisions. For more information about the FXCM's internal organizational and administrative arrangements for the prevention of conflicts, please refer to the Firms' Managing Conflicts Policy. Please ensure that you read and understand our Full Disclaimer and Liability provision concerning the foregoing Information, which can be accessed via FXCM`s website:
Stratos Markets Limited clients please see: www.fxcm.com
Stratos Europe Ltd clients please see: www.fxcm.com
Stratos Trading Pty. Limited clients please see: www.fxcm.com
Stratos Global LLC clients please see: www.fxcm.com
Past Performance is not an indicator of future results.

Rishilaser - A niche stock ready to resume upmoveThe stock has taken good support at fibonacci retracement levels. A close above 85 would be a safe entry to buy with swing high being the first target. ADX also supports the view
Entry - Above 85
Stop Loss - 77
Target - 118


BNBUSDT | ABC Pattern - Pullback Entry & Target Mega BullflagA bullish scenario for long-term view after a confirmed descending triangle breakout with a potential pullback entry position targeting ABC pattern at 100% - 161.8% Fib extension upper resistance of the mega bull flag.
S1/S2: pullback descending triangle support / ema20w zone
T1: 100% fib extension +50%
T2: 161.8% +90%
Indicator: RSI week - tapping into OB area with no sign of bearish divergence.

GE continues its bullrun LONGGE on the weekly chart has been in a trend up with some corrections along the way since a
double bottom in the summer of 2022. It has had some sections spin-off including the health
care poriton of the company. This company as a mega-cap industrial with cash on hand
is independent of interest rate concerns. Much of its business in long term contracts. I see
GE as a great long-term long trade. I am focused on accumulating long shares as well an
options into 2026. The last correction on this chart was this past October. I will average more
in at this time but am really looking for another smaller correction like last October for a
bigger buy to add to the positions. GE is safe from the volatility of most of the technology
stocks and in my opinion, is a good stock to "back up the truck".

SOLUSDT| Potential ABC Correction Wave Wave Analysis - weekly timeframe with a possible ABC correction wave
> Target: Fibonacci retracement 61.8 - 78.6% +30% upside
> Entry: TFD Falling downtrend channel breakout
Key support: WMA20W - target correction zone
Indicator: RSI Week - overbought but still no signs of divergence

BTC : 5Day MACD Fib WavesBitcoin Bitstamp 5Day moving average convergence/divergence
and fibonacci-based primary and secondary sine wave structures
established from historical MACD positive and negative momentum.
The MACD is displayed using the standard fast and slow lengths of 12 and 26, respectively.
Signal smoothing length is the standard value of 9.
For visual clarity, the signal line is not displayed...
but I have left in the colored fill between the MACD line and signal line,
so you can still see where the signal line would be.
Also included is the colored fill between the MACD and zero line.
The wave structure template used in this idea is roughly relative to a standard fibonacci channel,
using the following levels : 0, 0.214, 0.236, 0.50, 0.764, 0.786, and 1.00.
The primary fib wave template is displayed using solid lines.
The positions of the upper and lower bounds of the wave structure
are established using the March/April 2021 high, and the June/July 2022 low.
The horizontal positioning of the wave structure is established
using the March/April MACD high for the lowest wave value.
The highest value of the 1.00 wave (amplitude), as well as its' wavelength,
is established using the 0.50 midline level interactions...but more on that soon.
Note,
while the build and placement of the fib wave structures mimic a standard fib channel, it is not exact.
Looking closely, you'll notice that the midline isn't exactly in the middle of the 0 and 1.00 wavelines.
The structure compresses towards the bottom, thus it is not vertically symmetrical.
Either way, these fib wave levels surely line up with the MACD rather impressively.
Also of note,
by applying a horizontal fibonacci channel using the lowest values of the 0 and 1.00 wave levels,
and adding 0.35, 0.382, 0.618, and 0.65 to the existing levels,
one can see interesting interactions between the MACD and these horizontal levels.
Returning to the primary wave structure...
we can see some very interesting interactions between the MACD and the waves.
Here we look at the pink/blue wave levels :
And here, we look at the 0.50 green midline :
These midline interactions were used in creating the amplitude and wavelength of the entire wave structure.
By looking at all the interactions, I believe that it is fair to assume
that interactions similar to these could occur in the future
when the MACD reaches the various levels of this fibonacci wave structure.
Ok.
So what if, in the future, the MACD reaches beyond the upper and lower bounds of the fibonacci wave structure?
My first thought was to just extend the current wave structure
by adding more levels above and below the existing structure :
This could indeed be useful.
But, when I looked at the current structure, and then looked at historical MACD values before 2017,
I concluded that this structure doesn't necessarily apply to that data.
If I were to predict future MACD action beyond this structure,
especially a massive logarithmic rise/drop similar to what happened at the end of 2020/beginning of 2021,
I would need to think about this completely different, and find a another method...
one outside of simply adding more levels above and below the existing structure.
What did I find?
Let's return to the midline interactions that we looked at earlier.
We see the MACD hits the green midline and reverses 3 times before breaking through the it,
and then the MACD rises to the white 1.00 fib wave level.
I realize the following might be reaching a bit far,
but, what if this particular MACD behavior pattern occurs again in the future?
If the possibility of this occurring again exists,
is there any existing MACD data that I can use to form an entirely new fib wave structure?
A new structure that when placed properly, allows this behavior pattern to occur once again?
Here is what I found.
I can place a brand new wave on the chart, one with a larger wavelength, and a much larger amplitude.
I can modify its' wavelength, amplitude, and position,
so that it mimics the midline of the existing wave structure, but on a larger scale.
Take a look... here it is, displayed with a dashed line :
Now I ask, is it possible to estimate the other levels of this new structure using this waveline
and any existing MACD data?
Here is what I found :
Is this stretching a bit too far? Maybe.
But, I think that this way of thinking is what is necessary to imagine
what the MACD may look like in the future if there is a massive logarithmic swing in either direction.
And of course, because this new fib wave structure is built using less data than the previous structure,
and involves more estimation, it is likely to be less accurate as well.
So, if all of this possibly plays out, what would the MACD look like if it did reach these types of levels?
Well, using an unpublished pinescript indicator that I wrote,
I can give you an idea of what it would look like...
If you take all of the existing MACD data, offset it horizontally to the right by 500,
and then multiply the values by 4.20, you get this :
Awesome, right?!?!
Interestingly, this projection also fits the initial fib wave extensions
that I used in one of the previous images above. Take a look :
So, in conclusion, this is how I created the main chart of this idea.
I tried to include my logic and reasoning behind it.
Is this useful? I think so.
Naturally it depends on several factors such as whether you agree with the logic and conclusions of this idea,
whether you use the MACD to help you trade, the timeframes of your trades, as well as your trading style.
If anything, I think this chart is definitely worth looking at every now and then,
especially when the MACD gets close to the various levels.
Regarding sine waves, I have found some other waves that can be applied to the MACD that could prove useful.
I refer to them as sub-waves. These are not placed within a unifying fib structure...
they are individual waves, each with different amplitudes and wavelengths.
All sub-waves :
I think that these sub-waves can be useful at levels in between the fib wave levels of the two main structures,
and overall help add to the validity of the notion of using sine waves in conjunction with an MACD while trading.
Finally, here is a bonus 5Day MACD fib grid image...
Thank you for checking out my idea.
I hope it makes you look at sine waves, fibs, and the MACD differently.
Please give it a boost if you liked it, and feel free to comment.
//Durbtrade

Bitcoin: Bull Run Targets through FibonacciLet me explain. These are all Fibonacci Extensions. The Market Maker is officially done imo so I am very comfortable posting these finished schematics. Many Extensions reach the exact ATH at 69k as you can clearly see...
The Schematics are numbered Chronologically.
#1-#8 are placed in the order they were created.
#3 are the SUPPORT Schematics that are highlighted in RED.
#1 and #2 are monthlies because they are considered longer term.
HOWEVER, every single schematic can affect any timeframe so there is zero bias.
--For anyone thinking, "well theres lines everywhere so whats the point?"
--All of these 'lines' are mathematically perfect so there is no arguing with them because they are all perfect and unique in placement.
The linked idea is my old one... so this new idea is the revamped one. (better)

How to trade the Fibonacci indicator in 2024Today, we’ll start with what Fibonacci is and how to use it to spot significant market turning points.
Let’s start with...
A short story about Fibonacci
In 13th century Italy, lived a man named Leonardo Pisano – one of the greatest mathematicians of all time.
Leonardo (also known as Fibonacci), learnt all about Arabic and Indian mathematics during his travels in North Africa and around the Mediterranean regions.
Each time he travelled to a new place, he kept noticing a consistent pattern that repeated itself throughout nature.
The sequence he defined was as follows.
0, 1, 1, 2, 3, 5, 8, 13, 21, 34, 55, 89, 144…
Basically, all you do is take the last two numbers and add them up to get the next number.
0 + 1 = 1
1 + 1 = 2
1 + 2 = 3
2 + 3 = 5
3 + 5 = 8
8 + 5 = 13
And so on…
Fibonacci first contrived this pattern through a pair of breeding rabbits but he then saw this pattern throughout nature - in the breeding of honeybees , the shape of seashells as well as plants.
This sequence also applies to trading and investing charts and is called the Fibonacci Retracement indicator.
The Fibonacci Retracement indicator is used to help identify possible support and resistance levels for any market.
The idea is all high liquid markets tend to move, to and retrace back, to certain levels after a big price move.
The indicator is used to calculate the ratios and percentages using the Fibonacci sequence.
Let’s look at an example with the South African JSE ALSI 40.
Fibonacci on the JSE ALSI 40
Looking at the above daily chart of the JSE ALSI 40, you can see the index has fallen from a Swing High point of (100%) at 70,522 down to a Swing Low point (0%) to 65,386.
On your platform, when you add the Fibonacci Retracement tool onto your chart, you'll drag it from the swing high to the swing low price of the uptrend to see six main horizontal fib lines present themselves:
Fib line #1: 100% (Swing high)
Fib line #2: 61.8%
Fib line #3: 50%
Fib line #4: 38.2%
Fib line #5: 23.6%
Fib line #6: 0% (Swing low)
Traders use these lines to establish and identify supports (floor) and resistances (ceiling) levels.
And with these levels you’ll be able to spot good entry, stop loss and take profit price levels.
Once you draw the Swing High and Swing Low on the JSE ALSI 40, the Fibonacci lines will be plotted on the chart.
You would also have seen the market then went to one of the high points at 61.80% at 68,560.
The price then retraced back to the 23.6% level at 66,598.
So you can see where we are going with this.
As a reversal trader, you could have sold (gone short) the index around 68,560 and held it until it hit the 66,598 line at 23/6%.
That’s where you would have banked a gain just by waiting for the market to bounce off a fib line.
That’s a good introduction and a different way for you to trade and use the Fibonacci Retracement tool with your trading in 2024.
Let me know if this was helpful!

Upside potential unlocked as bears hibernate - Alt frenzy? Bitcoin has passed through the fib values of 0.618 and 0.615, known as the "golden ratio". A compelling zone to indicate that there will be a test for support on the longer time frame. Once we can establish support, which given FOMO, may even shoot through the 0.75 before finding a footing on the weekly. Bitcoin, once support on the longer time frame is poised to enter a Bull market opening up alt coins to shine in the next foreseeable future
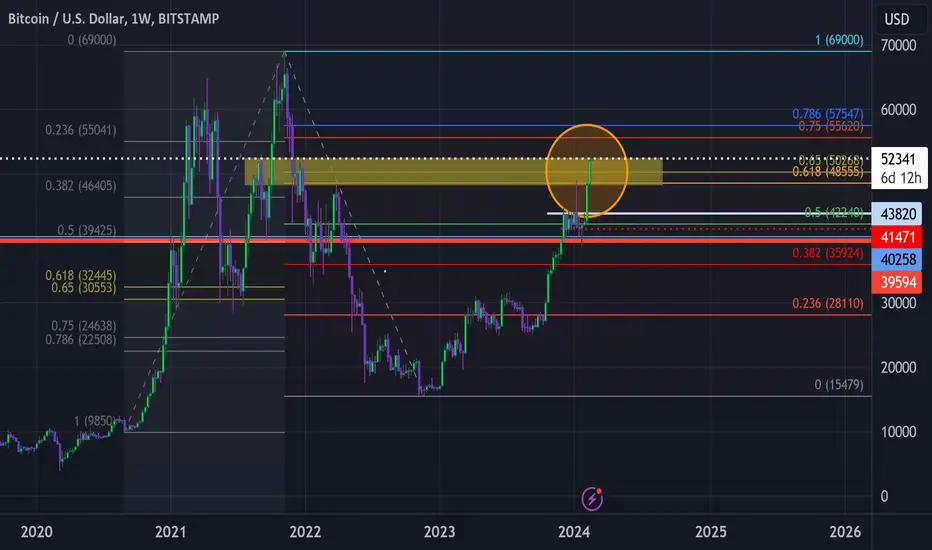
Long term *reliable* Fibonacci levels - lose or rally up? The Fibonacci levels are projected based on weekly price move of BYBIT:BTCUSDC.P from August 2020 till January 2021 .
For reliance discovery please follow yellow arrows. These significant price reaction are happened after revealing the levels. This shows these Fibo levels are highly reliable and has proved it can project the resistance and support levels with higher trust and accuracy. But still it is projection and anytime can be expired.
We are now over an important level of ~48900, obviously we have 2 scenarios for next ~2 weeks;
1) remain
2) lose
Right now there are still 6 days until weekly close, I would expect it closes under this level in upcoming 2 weeks. Unless, we will ride up till ~55500 level. Based on market behaviors it would be logical and stronger to range between 38221 and 48900 for sometime and then rally up.
What is your opinion?

Scalp-sell USDCHF then Buy at the OTEPure technical analysis
We think the picture speaks for itself.
Wait for USDCHF create Change of Character in the short red line, wait for the price to pullback to the red line area and set sell position to 0.5 - 0.618 fib zone. In this area, put buy limit order and set take profit at the previous high (fresh minor resistance).
Cancel setup in change of character doesn't happen.

Tricky Moves for GBPUSDPure technical analysis.
After making a bullish move from November 23, 2023, GBPUSD has completed Elliott Waves (first 12345), and then made a sideways movement since mid-December 2023. In this sideways movement, GBPUSD made micro-Elliott Waves and has completed them. The extension of this wave is predicted to complete leg 3 of the second 12345 waves in the range and reverse downwards.
On this large time frame (D1/H4), this is a retracement to the bullish wave in the previous large time frame. In the small time frame (H1), this is an opportunity to sell GBPUSD into the 0.618 Fibonacci zone of the large time frame, which is the flip zone area as well as the area that still leaves an imbalance wide enough to be filled.
Another reason to sell is the divergence on the oscillator which indicates buyers are starting to get exhausted.
To enter, wait until the price reaches the middle or top of the range, where there is a lot of equal high liquidity (range 1.27100 - 1.28250). Pay attention to price movements in smaller time frames (M5 - M15) to get an entry sell position. We prefer to enter at the 1.27040 level or higher and aims for 2R to the support zone at 1.23710 that acted as 0.618 fib level of the higher time frame, as well as the former bullish flip zone. Stop loss is at 1.28700 to avoid stop loss hunting/purge.
Cancel the setup if the price exceeds 1.28166 with high volume.
Note: if the price reaches take profit and shows reversal symptoms, take a buy position. Analysis will be provided later.

Sellers are Ready for EURUSDPure technical analysis.
EURUSD appears to have completed the 4th leg of Elliott Waves and is approaching previous support at 1.07464. There is still 1 leg of the Elliott Wave left to be fulfilled (leg E) which is predicted to be a pullback to the 0.618 Fibonacci zone, where there is equal high liquidity to be taken and then EURUSD will start a new wave (12345).
For entry, wait for a pullback to the 1.01000 - 1.10485 zone and wait for signs of reversal (engulfing candles or double/triple top in the smaller time frame). Ride the bearish waves to the strong support zone at 1.06110, an area that was previously also a flip zone. Stop loss at level 1.11135 or slightly higher to avoid fakeout (stop loss hunting/purge).
Cancel the setup if the price rises to 1.11135 with high volume.

BTC near term Retrace zones of interest: 40.4k a MUST HOLDThe current bounce wave looks to be done.
Now we watch and prepare at each support.
Which supports hold or not will be telling.
42,789 is the first support, a Genesis fib.
42,200 is next, Covid + local fib confluence.
41,405 is a minor support that may slow bears.
40.4k is the CRITICAL support that bulls MOST HOLD
.
This is an update to the fib picture idea posted here:
================================================================================================

BTC in the most important zone of this Bull RunBTC is currently hovering within a very important zone.
Zone is defined by confluence of Genesis and Covid fibs.
These high timeframe fibs have caught all major turns.
The zone of relevance is $ 42,200 to 42,789 (on coinbase).
This may be a turning point into retrace before continuation.
Bulls' best strategy will be to hold this zone thru the weekend.
Strong break should jump to 45K then 52k very quickly.
Rejection here could send us to new lows around 32k.
So it is the most important zone for this halving cycle.
.
These two fib sequences are posted individually as well:
The full Genesis Sequence:
The Covid Stimulus series:

Long idea Amber Enterprises#amber
Can go long above 3157 that is a strong resistance and retracement level of the last downtrend. Above that targets will be 3725, 4020. Sl will be 2890.

$TLT - 20 year US Treasury, possible support -I'm huge ultra BULLISH on US treasuries currently, so please excuse my bias.
Not in any specific order, however here are all the factors in this thesis...
1. Interest rates have dramatically increased since Jan 2021, and the overall bond market, including treasuries, had its worst 2 years on record, going back to 1915.
2. Since Nov 2022 just after Halloween, Jerome Powell, "top FED dude", has already said that interest will no longer get increased and that there's possibly three RATE CUTS this year 2024. Even if he said, "Rates will remain unchanged" is enough to make treasuries bounce back to even. (par value).
3. Looking at everything in Barron's most recent "Top Income Plays for 2024" from last week, US Treasuries now offer the most bang for buck interest rate 4.10% with the lowest risk, compared to every other income asset in that article. (i.e, Dividend stocks, muni bonds, REITS, preferred stocks, etc.,)
4. US treasuries are back by the full faith of the US Government.
5. There's now a website that tracks Congress women & men trades, capitol trades.com. And there's A LOT of them buying US Treasuries.
6. There's massive geopolitical risk right now and WW3 is now a word being used.
7. Bottomline: between the yield of +4% and the upside appreciation of treasuries being at the biggest discount in US History, I believe any pull back should bought.
8. COMPLIMENT OPTION STRATEGIES
A. You could buy 100 shares of TLT and the following are low risk option strategies to compliment your 100 shares of TLT.
i. Sell short term (30 days out) 1 call. If you buy 100 shares of TLT, then you can sell 1 covered call on TLT out of the money OTM, and take that premium and purchase another share of TLT. think "snow ball" effect. The strike I am selling on 1000 shares of TLT is Ten $98 strike TLT calls with 2/23 expiration. Then take that money and bought 10 additional shares of TLT.
ii. If you want to get fancy with this, you can also add to the above covered call BUY WRITE and do a VERTICAL PUT SPREAD, aka Credit Put Spread to add to the income (which adds to the "Income Snow Ball" of something that is appreciating. Mo Money Mo Money!
a. Sell $90 strike Put on TLT, 30 days out
b. Buy $87 stake Put on TLT,, same exp, to cover your short put.
c. This produces an extra $200 which you could spend on blow (or groceries) or you can buy 2 more shares of TLT. Weeeeeeeeeeeeee! thats capital generating income, that's generating income, being used to buy more of the thing that's appreciating in value, that's also generating income. THAT'S A LOT OF CHEDDAR!!
After one month, THEN REPEAT. :)

USD US Dollar DXY BearishBearish on two potential scenarios.
I am not a financial advisor. This is not meant to be, and does not constitute, financial, investment, trading, or any other types of advice or recommendation.

GOLD, SHORTGold has been on an uptrend path since a new low was updated at 1812 (Friday, 6th October 2023. The bulls took over from 1812 until there was a break of structure when the price updated the LH from 2013 (11th January) to 2002 on Wednesday, 17th January 2024. The break of structure could mean that if gold price fails to retest the recent HL of 2061 on the Daily, then the recent LH of 2002 will be retested in an attempt to update that LH to possibly 1974.
Price is expected to retrace to at least 50% level in 2020 before a potential rise to retest the 2060 level but the price is expected to have a strong resistance at 2045-2048 level. However, the fundamentals lining up for the week (Flash Manufacturing PMI, advance GDP m/m, unemployment claims, Core PCE price index m/m would actually determine the direction of the gold pricing and it is necessary to keep an eagle eye on the event proceedings.
A failure to break up the 2045-2048 resistance could mean the SELLERS may drive down the GOLD Price to 2002 and further plundering down to 1974 to confirm a new low update.

Pyth Network/Teter.... analyst Pyth Network,,, It can go up to the indicated fibo points, it has also hit the flag pattern and is going up as high as the flagpole, the trend line is also broken, everything is ready for further growth.
