AAPL Set for a Breakout? | Technical Checklist & Projections
▍Observation & Context
▪ AAPL has been moving sideways within a clearly defined range for the past three months .
▪ On July 07 , price tested the range resistance decisively, showing some interest in the upside.
→ Let's first explore the bullish breakout scenario.
▍What Makes a Good Breakout ?
Before we talk about targets, let’s define what a good breakout looks like:
▪ A strong bullish candle breaking through the resistance in one clean move .
▪ Followed by a retest of the broken resistance (now acting as support).
▪ After that, price should ideally:
1. Form a higher low , and
2. Reach the next resistance or target zone before pulling back.
▍Target Price – Method 1: Extension of the Range
🔹 Near-Term Target: 1.5–1.618x Fibonacci Extension
- A common zone where momentum often pauses.
- Aligns with the previous high from the last downtrend.
- Technically, to reverse a trend, price needs to take out the previous high. Even though the range has “cooled off” the pressure, we still respect that level.
🔹 Ultimate Target: 2x Range Extension
- Represents a 100% projection of the previous range.
- Commonly used in range breakout targets.
🔹 Dream Target: 2.618x Fibonacci Extension
- Aligns with the start of the last downtrend , adding significance to the level.
- Often marks the exhaustion point of strong trends.
▍Target Price – Method 2: Projection from Higher Low
Note: The new higher low is not yet confirmed at the time of writing. The levels below assume an upward breakout without dropping below 207.22 . However, the same logic can be applied once the higher low forms.
🔹 Near-Term Target: Same as Method 1
🔹 Ultimate Target: 100% Projection of Prior Swing
- Projecting the prior swing (from previous low to recent high) from the new higher low .
- This level also aligns with the 1.5–1.618x Fibonacci extension of that swing, increasing its significance.
🔹 Dream Target: Another 100% projection
- Rare, but happens when momentum is very strong .
- In such cases, price might skip any retracement and launch directly into a second leg , equal to the previous swing.
- Here, the level aligns perfectly with the start of the last downtrend , just like the 2.618x extension in Method 1.
▋Mental Notes
▪ No one knows for sure if the breakout will be real or fake. But when it happens, knowing what to look for and where price might go next gives us a clear plan of action .
▪ The market will always find ways to surprise. Stay open and follow the flow.
▋Not Financial Advice
The information contained in this article is not intended as, and should not be understood as financial advice. You should take independent financial advice from a professional who is aware of the facts and circumstances of your individual situation.
Fibonacci Extension

Bitcoin hits second target MacroBitcoin just hits second target, Volume is getting smaller, could indicate that buyers are weakening. We should keep an eye, maybe a corection is soon to be seen.
Litecoin to $1100 (12X) In This Coming AltseasonBased on tried and true fractals, multi-fib confluences, and historical price action, Litecoin is poised to hit prices between $900-1500 this cycle. The multi-fib confluences are pointing to $1100-1200 range as the most likely target. This is expected over the next 6-12 months if things continue to play out how I am expecting. As of today SEC approval of a LTC ETF is imminent but yet to be actualized.

JINDAL STEEL: Leading Diagonal Starting?JINDAL STEEL & POWER appears to be constructing an initial impulsive advance that may very well be taking the form of a Leading Diagonal. The advance from the 770 lows has so far developed into a structure where Wave 4 has overlapped with Wave 1 territory, suggesting that a classical impulse structure may not be applicable here. Instead, the price action fits neatly within the characteristics of a leading diagonal pattern, which allows such overlaps.
Wave 1 terminated at 923.80 followed by a corrective pullback into Wave 2 at 833.60. The subsequent rise into Wave 3 reached 985.80, which completed near the 100% extension of Wave 1, supporting the diagonal scenario where extensions are often limited. This was followed by a clear a-b-c correction into Wave 4, which found support at 882.65. Notably, the c-leg of Wave 4 reached close to 1.618 times the length of Wave a, adding further symmetry to this structure.
The current advance may therefore represent Wave 5 of this diagonal, projecting towards the 1036 to 1131 region of Fibonacci extensions. However, since leading diagonals typically signal the start of a larger structure, this entire formation could well be unfolding as either the first leg of a higher degree impulse (Wave 1) or as an initial Wave A of a larger correction. The labeling is thus kept open as "1/a" to reflect both possibilities at this stage.
The invalidation level for the current bullish scenario remains at 882.65, below which this entire leading diagonal interpretation would require reassessment. Until then, the bias remains upwards as the final leg of this structure seeks completion.
Disclaimer: This analysis is for educational purposes only and does not constitute investment advice. Please do your own research (DYOR) before making any trading decisions.

XAUUSD Video Analysis Brief – Weekly Forecast Summary (2025)This video summarizes the key scenarios and technical outlook for Gold (XAUUSD) on the weekly timeframe, integrating both Fibonacci-based projections and macro fundamentals.
Core Setup
Gold is currently positioned near the 161.8% Fibonacci extension (~$3,276).
A breakout toward $3,500 is possible before a potential corrective move.
Scenario 1: Bullish Continuation
Gold breaks above $3,435 → rallies to $4300 → continues toward major Fibonacci targets:
TP: $4,320, which is the Fibonacci level 261.8%
Scenario 2: Correction First
Gold fails to hold above $3,435 → triggers a healthy correction to:
TP1: $2,920
TP2: $2,650
If support 161.8% level holds in the correction zone, a renewed bullish phase is expected.
Macro Alignment
Central bank gold buying (notably BRICS) supports the long-term bid.
Fed policy leaning dovish → tailwinds for gold.
Inverse correlation with DXY:
DXY below 98.95 → bullish for gold
DXY above 100 → signals correction
Effect on Altcoins
If correction is risk-on driven, capital may rotate into altcoins.
If triggered by macro stress or USD strength, alts may fall alongside gold.
This analysis offers a multi-scenario framework to navigate the next major moves in gold, with key levels to watch for traders, investors, and macro analysts alike.

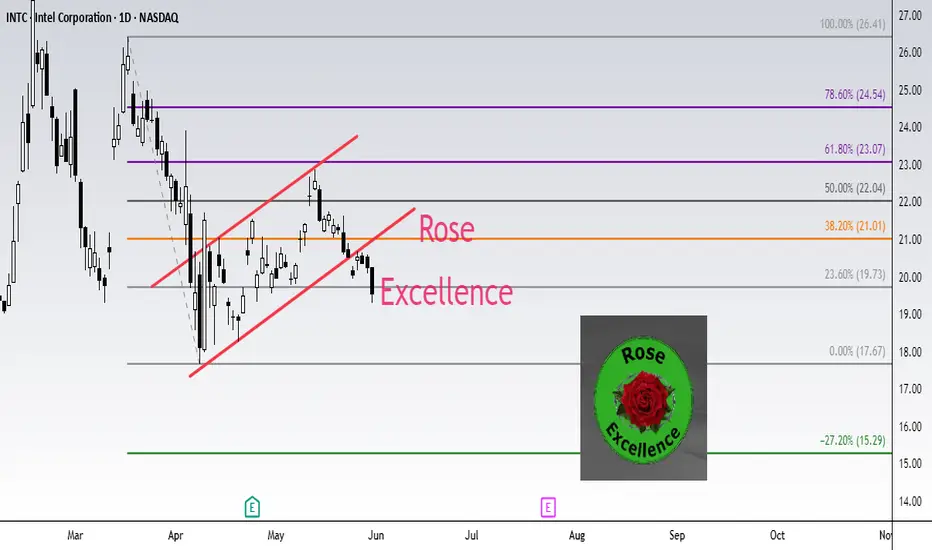
INTEL INTC Short setup target 15.29Fibonacci technical analysis : Intel Corporation NASDAQ:INTC has already found resistance at the Fib level 61.8% (23.07) of my Down Fib. The May 30th Daily candle has closed below retracement Fib level 23.6% (19.73), confirming a sell signal. A Bear Flag pattern has also formed. My Down Fib guides me to look for NASDAQ:INTC to eventually go down to hit first target at Fib level -27.2% (15.29).
NASDAQ:INTC – Target 1 at -27.2% (15.29), Target 2 at -61.8% (12.26) and Target 3 at -78.6 (10.79)
Stop loss slightly above the 50.0% retracement Fib level (22.04).
Enjoy the trading process and take time to smell the roses🌹
S&P ES Long setup target 5963.50 / Calls SPY target 596Fibonacci technical analysis : S&P 500 E-mini Futures CME_MINI:ES1! has already found support at the Fib level 78.6% (5623.50) of my Down Fib. Last Daily candle (May 2) has closed above retracement Fib level 78.6%. My Down Fib guides me to look for CME_MINI:ES1! to eventually go up to hit first target at Fib level 127.2% (5963.50).
CME_MINI:ES1! – Target 1 at 127.2% (5963.50), Target 2 at 161.8% (6205.50) and Target 3 at 178.6 (6322.75)
Stop loss slightly below the 61.8% retracement Fib level (5506.25).
Option Traders : My AMEX:SPY chart Down Fib shows price to go up to Target 1 at 127.2% (595.82), Target 2 at 161.8% (620.50) and Target 3 at 178.6 (632.50)
Stop loss slightly below the 61.8% retracement Fib level (549).
Enjoy the trading process and take time to smell the roses🌹

CADCHF Update | ~150pipsSimilar to USDCHF price broke below a major range and is now pulling back towards the latest breakout zone.
Bulls are looking strong after securing the lower support level and we could see about 150pips as price action looks for targets around 0.61000.

GOLD forms a DOUBLE TOP. Support 3200. Trend reversalGOLD is forming support for the double top reversal pattern
A break of 3200 will confirm the market's intention to reverse the trend and go downwards.
Scenario: There is a lot of important news from the US and Great Britain ahead. If the general fundamental background remains and the dollar continues its bullish trend, then we will be close to a breakdown of 3200.
Thus, a break of 3200 and consolidation below the level will be a signal that we are ready to go down.

NZDUSD is preparing for a reversal and a fallNZDUSD is in consolidation and preparing to exit it. Ahead is possible breakout of trend support and fall to 0.5757
The reason is as follows: change of fundamentals background (positive signals on tariff war), dollar growth and market reversal.
Scenario: break of consolidation support at 0.5885, price consolidation below this level - this will be a signal ready to start distribution, i.e. downward movement.
Primary target 0.5 fibo, secondary target 0.7 fibo

VIRTUALUSDT can derail support with momentumVIRTUAL is consolidating after the rally, but it cannot continue its growth yet. A descending triangle with a clear base support and a fourth retest relative to 1.877 is being formed, which in general only increases the chances of support breakout and decline
Scenario: if the compression of this format (within the descending triangle) continues and the price continues to compress to the support at 1.877, then in this case it will be possible to catch a breakout through a limit order. A sharp impulse is possible. As the first target I will wait for a decline to 0.5 fibo (1.73)

Fibonacci Extensions: Mapping Market Psychology Beyond the TrendHello, traders! 💫
Fibonacci numbers have traveled far from ancient Italian math to modern trading charts. In technical analysis, Fibonacci Extensions aren’t just mystical ratios; they’re a structured way to project potential price targets based on crowd psychology and trend continuation.
But what are they really, and why do so many traders draw those lines with near-religious fervor?
🧠 A Quick Historical Detour
Leonardo Fibonacci introduced the sequence to the West in the 13th century based on patterns he observed in Indian mathematics. The key idea is that each number in the sequence is the sum of the two before it: 1, 1, 2, 3, 5, 8, 13, 21...
When you divide specific numbers in the sequence, you get ratios that repeat throughout nature — and, intriguingly, financial markets. These include:
0.618 (the “golden ratio”)
1.618
2.618, and so on.
While Fibonacci Retracements look backward to gauge potential pullbacks, Fibonacci Extensions look forward to mapping possible continuation levels after a price move.
📊 Fibonacci Extensions
To use Fibonacci Extensions, you need three points:
The Start of a Trend (Point A)
The End of the Trend or Impulse Move (Point B)
A Retracement Low/High Where Price Bounces or Consolidates (Point C)
This ABC move applies Fibonacci ratios to project levels beyond point B, helping traders visualize where the price might go if the trend continues.
Common Extension Levels Include:
1.272
1.618 (golden ratio)
2.0
2.618
Each level acts as a kind of psychological milestone — not a guarantee, but a place where market participants may take profits, reassess, or react.
🔎 Let’s Take a Real Example: BTC/USDT Weekly
It's not that Fibonacci numbers have magical power. The theory is based on self-fulfilling behavior. When enough traders watch the same levels — and act on them — they can influence real outcomes.
The chart illustrates how Fibonacci retracement levels can be used to understand the depth and structure of a correction during a bullish cycle.
Low (~$4,783) in March 2020 (COVID-19 Сrash)
to the High (~$65,834) in November 2021 (Bull Market Peak)
From there, the price corrected throughout 2022–2023. Let’s look at what happened at each level — and what it tells us on the graph.
🔍 Why This Matters
Your retracement levels aren’t just lines — they mapped the psychology of the market:
Investors Testing Conviction at 0.5
Panic at 0.618
Capitulation Near 0.786 — but Without Full Breakdown
And Finally: A Rebound in 2023, Leading to New Highs in 2025
This kind of structure is textbook Fibonacci behavior — and is part of why retracement levels remain a core part of institutional technical analysis.
⚖️ Final Thought
Fibonacci Extensions are not about telling you where the price will go — they’re about framing where the price might go if the current trend keeps moving. It’s a lens through which to read market psychology, momentum, and expectation. Combined with volume, structure, and broader trend context, they potentially help analysts build a more nuanced market narrative.
And maybe Leonardo Fibonacci would have appreciated that his 800-year-old math is still trying to decode modern human emotion, just on candlestick charts.

EURUSD: Back to 1.1200Using the Fibonacci extension tool, we could see price hasn't closed and rally above 2.0. Maybe we could get some turn around before continuing bullish on EURUSD.

The Golden Code: Unlocking the Markets with Fibonacci Sequence “Mathematics is the language in which God has written the universe.” – Galileo Galilei
If this is true, then the Fibonacci sequence is the poetry of that language, especially in trading.
📚 What is Fibonacci? Why Should Traders Care?
Fibonacci is more than just a sequence of numbers — it’s a universal law of growth and proportion. From galaxies to sunflowers, and now to the charts on your TradingView screen, Fibonacci is everywhere.
In trading, Fibonacci retracement levels are used to identify potential reversal zones, where price is likely to bounce or stall, making it one of the most powerful tools in a trader’s arsenal.
But few truly understand its depth, and fewer still use it intelligently.
Let’s dive into the power of the Fibonacci sequence, how it influences retracements, and how you can use it to your trading advantage, whether you’re a scalper, swing trader, or position trader.
🧠 The Fibonacci Sequence: Where It All Begins
The Fibonacci sequence is a series of numbers where each number is the sum of the two preceding ones:
0, 1, 1, 2, 3, 5, 8, 13, 21, 34, 55, 89, ...
Some Math somebody? Take your seats and calculators away! 😂😂
📉 Fibonacci Retracement Levels & How They're Calculated
These levels are percentages based on relationships between Fibonacci numbers.
✅ 0.236 (23.6%)
Divide a number by the one three places ahead:
Example: 13 ÷ 55 = 0.236
Another: 21 ÷ 89 = 0.236
✅ 0.382 (38.2%)
Divide a number by the one two places ahead:
Example: 21 ÷ 55 = 0.382
Another: 34 ÷ 89 = 0.382
✅ 0.500 (50.0%)
Not directly from Fibonacci, but commonly used due to psychological midpoint in markets.
✅ 0.618 (61.8%) – The Golden Ratio
Divide a number by the next number:
Example: 34 ÷ 55 = 0.618
Another: 55 ÷ 89 = 0.618
This is the famous Golden Ratio, which appears in nature, art, and financial markets.
✅ 0.786 (78.6%)
Derived from the square root of 0.618:
√0.618 = 0.786
📈 Fibonacci Extension Levels & How They're Calculated
Extensions project price targets beyond the retracement.
✅ 1.000 (100%)
A full projection of the original move.
✅ 1.272 (127.2%)
Square root of 1.618:
√1.618 = 1.272
✅ 1.618 (161.8%) – The Golden Extension
Divide a number by the previous one:
Example: 55 ÷ 34 = 1.618
Another: 89 ÷ 55 = 1.618
✅ 2.000 (200%)
A full double of the original move.
✅ 2.618 (261.8%)
1.618 + 1.000 = 2.618
This creates ratios that are found in nature, architecture, music, and, yes, price movements.
🔍 Fibonacci Retracement: Mapping Pullbacks with Precision
When price moves impulsively in one direction, it often retraces a portion of that move before continuing in the same direction.
Fibonacci retracement is used to map this pullback.
Here’s how traders use it:
Identify a clear impulsive move (either bullish or bearish).
Plot the Fibonacci retracement tool from swing low to swing high (for bullish moves), or from swing high to swing low (for bearish moves).
Watch how price reacts around key levels:
38.2% = Shallow pullback
50% = Midpoint (psychological)
61.8% = Golden Zone
78.6% = Deep retracement (but still valid)
🔥 Pro Tip: Most institutional traders love the 61.8% retracement, often placing hidden liquidity and traps around that area.
🔄 Fibonacci Extensions: Predicting Take-Profit Zones
Once price retraces and continues its trend, Fibonacci extensions help identify possible target zones:
Common extension levels:
1.272
1.618 → Golden Target
2.000
2.618
For example:
After a bullish retracement to 61.8%, price often rallies to 1.272 or 1.618 extensions, making these ideal profit-taking zones.
🔄 Real-Life Market Behavior: Fibonacci in Price Action
Let’s take a real example:
🟨 Example: XAU/USD Bearish Retracement
Impulsive rally from $2,832.99 to $2,930.77.
Price pulls back to $2,880 – exactly at the 50% Fibonacci retracement.
Followed by a strong continuation to the upside.
Price reach for the 127.20% and beyond to 161.80% Fibonacci extension of the original rally before pausing for some times — textbook Fibonacci behavior.
💡 This isn’t magic. It’s structure, order, and smart money playing on the same field.
🧬 Fibonacci + Confluence = Confirmation
Fibonacci works best when combined with other tools:
Support/Resistance
Order Blocks
Imbalances
Trendlines
Candlestick Patterns
✅ A 61.8% retracement + bullish order block + bullish engulfing = a high-probability long setup.
✅ A 78.6% retracement + unfilled imbalance = possible stop-hunt trap or liquidity grab.
🧠 Fibonacci Psychology: Why It Works
Fibonacci works because it reflects natural human behavior:
Fear and greed create overextensions and pullbacks.
Traders place stops and entries near these key ratios, causing self-fulfilling reactions.
Algorithms and institutional models often base trade entries on Fibonacci confluences.
💥 Common Mistakes Traders Make
❌ Using Fibonacci on every small swing – noise, not signal
❌ Forcing the retracement tool to “fit” your bias
❌ Ignoring higher time frame structure
❌ Using Fibonacci alone without confluence
Remember: Fibonacci is a guide, not a guarantee.
📈 How to Trade with Fibonacci (Step-by-Step)
First, identify market structure (trending or ranging).
Second, mark swing high and swing low.
Third, plot retracement tool accordingly.
Fourth, look for confluence zones:
38.2%, 50%, 61.8%...
Price action signals (e.g., pin bars, engulfing)
Institutional concepts (order blocks, imbalances)
Enter with confirmation, not just based on levels.
Set stop loss below/above structure or 78.6% line.
Target extension levels or previous high/low.
🌀 Fibonacci in Different Trading Styles
Scalpers
Use Fibonacci on 1min–5min timeframes to catch micro pullbacks and entries.
Swing Traders
Use Fib retracements from daily or 4H structure to plot entries and targets.
Position Traders
Use weekly/monthly Fibonacci zones for macro views and long-term targets.
🧠 Final Thoughts: Fibonacci Is Structure, Not Sorcery
The Fibonacci sequence is a map of order in a chaotic world. In trading, it helps bring discipline, clarity, and precision.
It’s not about being right every time, it’s about stacking probabilities in your favor.
🧭 Ready to Master Fibonacci?
If you’ve read this far, drop your thoughts in the comments and share your favorite Fibonacci setup!
Let’s build a community of traders who use mathematics and structure, not hope and guesswork.
Follow for more educational breakdowns, trading insights, and strategy walkthroughs — posted weekly.

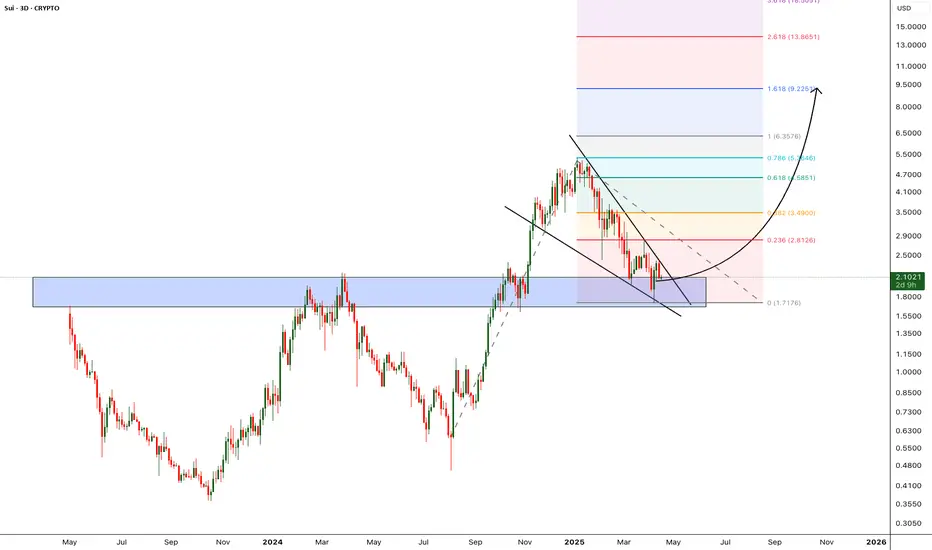
SUI - Double Digit is next - Alt season LeaderCorrection of the SUI is over, currently trading around the previous Support zone. i'm expecting this support to hold and bounce back from the support zone.
Once the price breaks from the falling wedge pattern we can expect the bullish momentum to start and hit new all time high.
Entry: after wedge breakout
Target 1: 2.8
Target 2: 3.49
Target 3: 4.5
Target 4: 5.3
Target 5: 6.3
Target 6: 9.2
SL below 1.68
Cheers
GreenCrypto
COTI WAVE 3 is coming COTI has completed its initial phases, Wave 1, 2 of Elliot waves and is preparing for Wave 3📈.
Also COTI V2, released recently, aims to revolutionize web3 privacy.
COTI’s market capitalization is $96 million, suggesting substantial potential gains during the upcoming bull market🚀.
This information is not financial advice. Conduct thorough research before making investment decisions.

Mastering Fibonacci Retracements & Extensions on TradingView!1. Introduction to Fibonacci in Trading
Fibonacci levels are widely used in trading to identify potential reversal zones, support, and resistance levels. These levels are derived from the Fibonacci sequence, a mathematical pattern found in nature and financial markets. Traders rely on Fibonacci retracements to find potential entry points and Fibonacci extensions to determine profit targets. The most critical area of interest is the golden pocket zone, which ranges between 0.618 and 0.65. Price often reacts strongly in this zone, either reversing or continuing its trend, making it a key level for traders to watch.
2. Key Fibonacci Levels for Trading
Several Fibonacci levels are commonly used in trading. The 0.5 level, although not an actual Fibonacci number, is often observed as a psychological retracement level. The golden pocket zone, which consists of the 0.618 and 0.65 levels, is considered the most important for potential reversals. The 0.786 level represents a deeper retracement and is frequently used by traders for more precise entries before a strong price move. On the other hand, Fibonacci extensions, such as -0.618 and -1.618, are used to project potential price targets. These levels serve as reference points for identifying support and resistance, allowing traders to make more informed trading decisions.
3. How to Draw Fibonacci Retracements on TradingView
To effectively use Fibonacci retracements, traders must first identify a swing high and a swing low on the chart. This process starts by recognizing a strong uptrend or downtrend. Once identified, the Fibonacci tool in TradingView can be used to plot retracement levels. By selecting the swing low and dragging it to the swing high in a bullish setup, or vice versa in a bearish setup, traders can visualize the key Fibonacci levels. It is essential to adjust the settings to only display 0.5, 0.618, 0.65, 0.786, -0.618, and -1.618 for better clarity. This method provides a structured approach to analyzing potential price reactions and planning trades with greater accuracy.
4. Trading Strategies Using Fibonacci Levels
A. The Golden Pocket Entry Strategy (0.618–0.65)
One of the most reliable trading strategies involving Fibonacci retracements is based on the golden pocket zone. When price retraces to the 0.618–0.65 area, traders look for confirmation signals before entering a trade. These confirmations may include bullish or bearish candlestick patterns, such as engulfing candles, pin bars, or hammer formations. Additionally, traders may use momentum indicators like RSI or MACD to identify divergences, which suggest a potential trend reversal. A spike in volume at these levels can further validate the trade setup. A typical strategy involves entering a trade within the golden pocket, setting a stop-loss slightly below the 0.786 level for risk management, and targeting Fibonacci extensions for profit-taking.
B. Fibonacci Extensions (-0.618 & -1.618) for Profit Targets
Fibonacci extensions serve as valuable tools for setting take-profit levels in trending markets. Once price confirms a reversal from a retracement level, traders use extensions to project future price movements. The -0.618 extension is often considered a conservative target, providing an early profit-taking opportunity. Meanwhile, the -1.618 extension is a more aggressive target, generally used in strong trends where price momentum is high. By integrating Fibonacci extensions into their strategy, traders can optimize their exits, ensuring they capture the full potential of a move while minimizing premature exits.
5. Common Mistakes & How to Avoid Them
Despite its effectiveness, Fibonacci analysis requires proper execution. One common mistake traders make is drawing Fibonacci levels incorrectly by selecting the wrong swing points. Accuracy in identifying the correct high and low points is crucial for reliable retracement levels. Another mistake is over-reliance on Fibonacci without additional confirmations. Traders should always seek confluence with other technical indicators, such as support and resistance levels, moving averages, or volume analysis. Additionally, failing to wait for confirmation signals can lead to premature entries, increasing the risk of losses. Understanding these pitfalls and applying Fibonacci with proper validation techniques can significantly improve trading outcomes.
6. Pro Tips for Using Fibonacci Like a Pro
For best results, traders should use Fibonacci analysis on higher timeframes, such as the 1-hour, 4-hour, or daily charts, as these provide more reliable signals compared to lower timeframes. Confluence plays a crucial role in validating Fibonacci levels, so traders should always look for overlapping support and resistance, trendlines, or moving averages. Additionally, backtesting Fibonacci strategies using TradingView’s replay mode can help traders refine their approach and gain confidence in their setups before applying them in live trading. By combining Fibonacci with other technical tools and maintaining discipline in execution, traders can enhance their decision-making process and improve their overall trading success.
Final Thoughts
Mastering Fibonacci retracements and extensions can significantly improve trade accuracy. By focusing on the golden pocket zone (0.618–0.65) and using Fibonacci extensions like -0.618 and -1.618 as profit targets, traders can refine their strategies and maximize profitability. Understanding how price interacts with these levels and applying additional confirmations ensures more precise trade entries and exits. With practice and proper analysis, Fibonacci can become a powerful tool in any trader’s arsenal.
__________________________________________
Thanks for your support!
If you found this idea helpful or learned something new, drop a like 👍 and leave a comment, I’d love to hear your thoughts! 🚀
Make sure to follow me for more price action insights, free indicators, and trading strategies. Let’s grow and trade smarter together! 📈

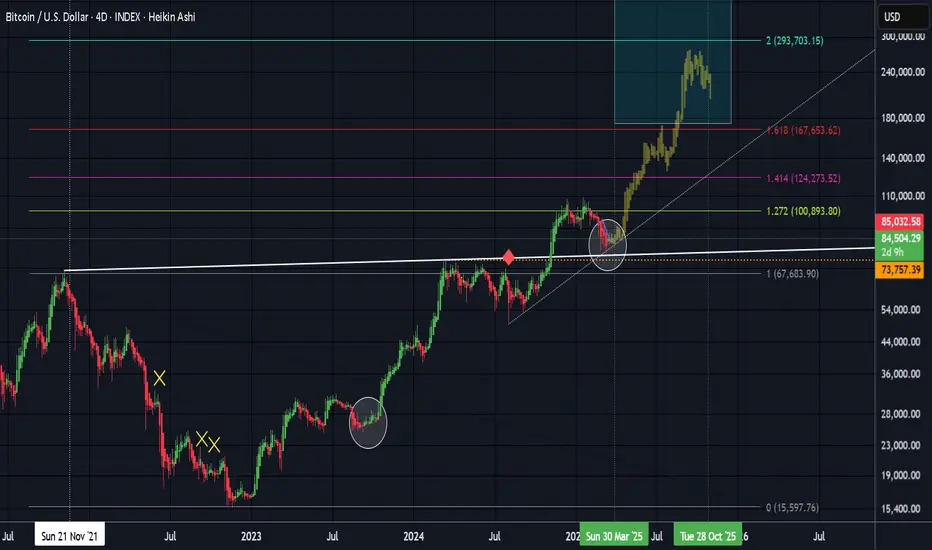
Projected path for Bitcoin based on fibsBitcoins projected path based on Fib expansion levels and previous price action (come back to this one)
Manappuram Finance: Long-Term Breakout Alert🚀 Manappuram Finance: Long-Term Breakout Alert! 🚀
🔹 CMP: ₹230 | Stop Loss: ₹170 | Target: ₹290 | ₹372
🔍 Why Manappuram Looks Promising?
🔄 Technical Breakout:
A rounding bottom (or cup-and-handle) breakout with a well-defined base formation—indicating potential long-term upside.
📊 Accumulation Opportunity:
As the breakout occurs, retests may follow—offering an ideal opportunity for staggered accumulation. Long-term investors can accumulate on dips for better risk-reward.
📈 Target Calculation:
📏 Pattern Depth Approach: Targets are derived from the depth of the rounding bottom or cup-and-handle pattern.
📊 Fibonacci Validation:
✅ Retracement Levels (Stop Loss Zones): ₹138 & ₹230
✅ Extension Levels (Price Targets): ₹81.5, ₹230 & ₹138
📌 Pro Tip: Plot these Fibonacci levels yourself to build conviction and sharpen your analysis.
📉 Risk Management:
Stop loss is carefully aligned with Fibonacci retracement to minimize downside risk.
Follow strict position sizing to safeguard capital—especially in volatile market conditions.
⚠️ Caution: Market conditions can shift quickly—adjust your position size based on your risk tolerance and trading plan.
📍 Outlook:
With a confirmed breakout and strong technical alignment, Manappuram Finance offers a high-probability swing trade for long-term investors.
📣 What are your thoughts on this breakout? Share your views in the comments!
📅 Follow for more technical insights and market updates.
📈 #ManappuramFinance #BreakoutAlert #TechnicalAnalysis #SwingTrading #InvestmentOpportunity
📉 Disclaimer: As a non-SEBI registered analyst, I encourage you to conduct independent research or consult a financial professional before making investment decisions.

Bitcoin - This indicator is always right! Crash to 40k in 2026.What we can see on the chart is Bitcoin cycles. We can statistically predict Bitcoin moves with this simple chart, because it's always right and never wrong. What can we say with certainty?
Statistically:
Bitcoin's bull markets last for 742 to 1065 days
Bitcoin's bear markets last for 364 to 413 days
Correction is every time weaker, but still huge
The recent uptrend on Bitcoin started in December 2022 and ended in January 2025 (791 days). We know that statistically bull markets last for 742 to 1065 days, so this indicator tells us that the bull market ended! This indicator was never wrong, so do your own research. It's always like this. Moon boys calling for 300k, 500k, or 1M in 2025 do not follow my TradingView profile because otherwise they would know this strong fundamental fact. The market cap of Bitcoin is already too big, so forget about 500K or 1M in the short term because the market cap would be higher than gold. Gold is the number 1 asset in the world.
Statistically, Bitcoin crashes every 4 years by 86% to 77%. The market cap is getting bigger as institutions step in, so this time I expect a weaker crash (around 65%). Still, it's a huge crash, and many investors will sell at a loss as usual. Knowledge of the Bitcoin cycles will save you a lot of money.
Bitcoin halving is coded to occur once every 210,000 blocks, or roughly every four years, and will continue in this fashion until the final supply of 21 million BTC is reached. It is assumed that the last BTC will be mined in 2140. After that, transaction fees are supposed to be the only source of block rewards for miners.
Write a comment with your altcoin, and I will make an analysis for you in response. Also, please hit boost and follow for more ideas. Trading is not hard if you have a good coach! This is not a trade setup, as there is no stop-loss or profit target. I share my trades privately. Thank you, and I wish you successful trades!

Bitcoin - 60% crash to 32K | ETH is dying | Trump scam?Technically, Bitcoin is entering a huge bear market! This is what my charts and fundamentals tell me at the moment.
Trump returned to the White House on January 20, 2025. This day, Bitcoin hit a new all-time high (109,588 USD), and since then, Bitcoin has been going only down! In 2019, Trump said he is not a fan of crypto. x.com
So isn't it weird that Bitcoin has been going down since the beginning of his presidential post? (On January 20). Random or planned? Answer by yourself, but something seems to be fishy here. What about the latest Trump post on TruthSocial about the strategic crypto reserve? The market reacted very positively, but after a few days, the whole market completely crashed and is now finding its new low. Was this another trap? Clearly, everyone who bought into this news is at a loss on his trading account; that's for sure.
What is happening to Ethereum? Ethereum is almost at the same price it was in 2018!! 7 years ago, the price of Ethereum was 1440 USD; the current price is around 1700 USD. I predict ETH to go to 750 USD in 2026. Why is this new technology struggling? Investors all over the world and early adopters are very disappointed by the performance of this coin. It also seems like the crypto market completely collapses, and only Bitcoin is surviving. Even though Bitcoin hit only 109k, which was most likely the ultimate top for the next few years, it was also less than everyone expected. I don't really want to talk about other altcoins because they are down 95% to 99%, and this bull market did nothing (sideways price action). In conclusion, this was the weakest bull market in history.
From a technical point of view, Bitcoin (and all altcoins) is breaking down on the weekly chart! The bullish market structure is broken, and we entered a new downtrend. Where to buy BTC, ETH, SOL, XRP, and other coins? You can write me a comment below, and I will tell you. I start with BTC—buy Bitcoin at the 0.618 FIB retracement. This FIBO is at 32 688 USDT, so we need to wait 1 year for the price to come to this level. Be patient.
So what to buy? Maybe focus on very low-cap coins; they do not follow the general trend (bull or bear). I have a tip for many coins, such as ATC (AutoTCrypto). Contract EQBMxFekc39SONbY8Mes8IwnZZlsPzeZhwz2c7sqMkkjI0uy. Where to buy? Use a decentralized exchange, such as dextools or ston.fi.
Write a comment with your altcoin + hit the like button, and I will make an analysis for you in response. Trading is not hard if you have a good coach! This is not a trade setup, as there is no stop-loss or profit target. I share my trades privately. Thank you, and I wish you successful trades!

Hedera Goes From April Highs, To ATH, To Elliot Wave Theory? Lets break down what COINBASE:HBARUSD may be setting up for a long-term scenario!
We saw a impressive Bullish Rally from beginning of November 2024 that facilitated a Breakout of the April 2024 High @ .1842 to then create its All Time High @ .4010.
With this Price Action going from a Significant Low to create a new Higher High, we can apply the Elliot Wave Theory which is first supported by seeing some sort of Fibonacci Retracement from the Low to New High and we see that February of 2025 delivered a Fibonacci Retracement to the Golden Ratio Zone twice to now be showing support from Bulls pushing price higher!
Technically, with Wave 1 having been corrected successfully by Wave 2, both being completed, we now can expect price to give us another extension starting Wave 3, giving us a Break of the ATH created by Wave 1, to then confirm our directional bias and validate the Elliot Wave Theory.
Based on the Fibonacci Extension, we can project a potential "Roadmap" price may follow while outlining the rest of the Impulse and Corrective Waves where we see Price ultimately ending Wave 5 at the Potential Range Target of ( .7571 - .89441 )
Rules:
- The 2nd Wave cannot retrace the 1st Wave more than 100%
- The 3rd Wave can never be the shortest of the Impulse Waves ( 1,3,5 )
- The 4th Wave cannot retrace the 3rd Wave more than 100%

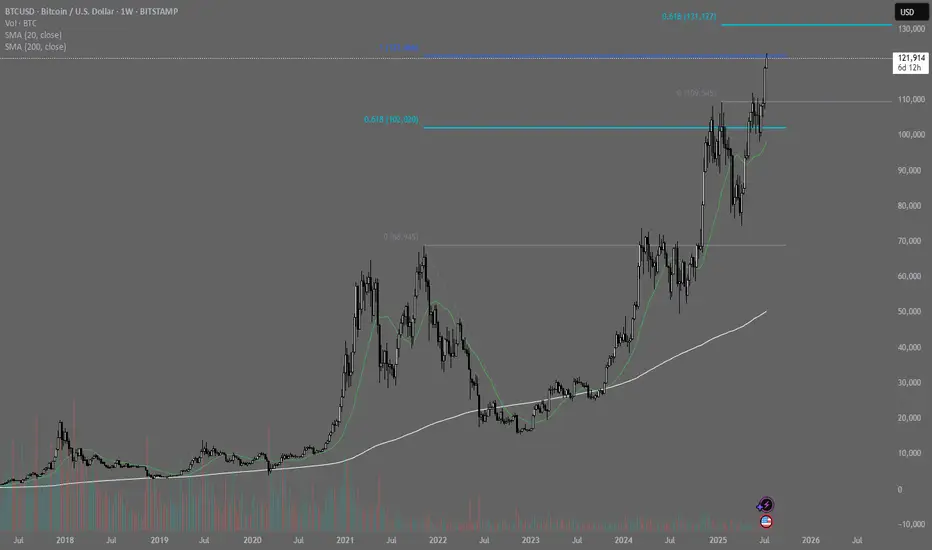
Bitcoin - Historical trap (122k then 60k in 2026)Bitcoin is in the final stage of the bullish cycle, and we want to look for the best price to sell and prepare for the 2025/2026 bear market! The best price to sell Bitcoin is at the 1.618 FIB extension or at the main long-term 2017-2021-2025 trendline. This is exactly at 122,069, as we can see on the chart.
Many people are saying that it's over for Bitcoin and that Trump's post was a giant trap. I think we will see a final 2 waves on Bitcoin to form an ending diagonal wedge pattern (1-2-3-4-5). Bitcoin is in wave 3.
I am also bullish because of the 50-week moving average. Historically, Bitcoin reacted to this MA very precisely. I always recommend using simple moving averages with 20, 50, 100, and 200 periods because this is what the big players are using as well. These MAs are very popular among giant institutions, banks, and investors.
I think a huge altseason should kick in anytime soon now because Ethereum is very undervalued, and BTC.D needs a break as well. ETH could be a much better choice for the final 2025 pump.
Write a comment with your altcoin + hit the like button, and I will make an analysis for you in response. Trading is not hard if you have a good coach! This is not a trade setup, as there is no stop-loss or profit target. I share my trades privately. Thank you, and I wish you successful trades!
