BNB/USDT 1DIntervalBNB/USDT on a one-day time frame. We will start by identifying a downtrend line from which we can see how the price has gone up and is currently struggling to stay above this level.
Moreover, at this point we can see the formation of the Cap and Handle formation, which is characterized by a first large and a second smaller low, after which an upward price break can be observed. Moreover, the recent declines were caused by the bombardment of the media with negative information about the Binanc exchange, which lowered the valuation of the BNB token.
Going further, when we unfold the fib retracement grid, we will see that the price has been rejected by a very strong resistance zone from $319 to $351, but if we return to it and the price goes up, the path towards the next significant resistance around $443 will open.
Looking the other way, we will define the places of support in a similar way. And here we can see the first support at the level of $286, then we can determine the second support at the level of $253.7, which could potentially fill the formation. However, if the formation is broken, we still have a very strong support zone from $231 to $202.
Please look at the RSI indicator, which shows a rebound towards the upward trend line, while the STOCH indicator shows a strong downward movement, which resulted in a small price movement on the chart, but there is still room to deepen the correction.
Fibonacci Extension

BTC DominanaceHello everyone, I invite you to every Friday's review of the leading cryptocurrencies, let's start by checking the situation regarding BTC's dominance over the rest of the market. We will start by defining, using the yellow line, a local upward trend that was dynamically interrupted by a sudden capital flow.
Moving forward, we will unfold the Fib Retracement mesh to check potential support locations. And here we can see that even the level of 0.618 golden FIB point was quickly broken, and currently the closest support is at 51%. However, if this support is broken, we may observe further capital flow and, consequently, a return to the area of the next important support at the level of 48.47%.
When we unfold the fib retracement in the second direction, we can mark the main resistance zone from 54.45% to 55.37%, which effectively stops the inflow of capital into BTC.
We can also switch to a one-day time frame, and after zooming out the chart, we can determine the main downward trend line using the white line.

DOW - At ATH's 38k next Target. BLACKBULL:US30 is sitting at the top of the move with what is looking like one more move higher into 38k before we see a decent retracement.
In the smaller TFs there is a pattern setting up giving us potential upside targets.
I go into more details of these levels to watch in my group.
Once the high comes in we look at the retracement to see if its going to be bullish or bearish. But first we need a top, then we can go from there.
I hope this helps. Enjoy the week.

Bitcoin sell the ETF news. 20% crash is comingBitcoin is crashing after the BTC ETF launched on Nasdaq - iShares (ticker IBIT on TradingView). This is not looking good; the crash looks really strong on the 1-minute chart. Everyone bought into the ETF News, and now the whales are taking advantage of it and want liquidity at approximately 39k. Why 39? We can see multiple swing lows in this zone. I turned bearish on Bitcoin today. Let me know what you think about my analysis, and please hit boost and follow for more ideas. Thank you, and I wish you successful trades!
Bitcoin is the first decentralized, peer-to-peer digital currency. One of its most important functions is that it is used as a decentralized store of value. In other words, it provides for ownership rights as a physical asset or as a unit of account. However, the latter store-of-value function has been debated. Many crypto enthusiasts and economists believe that high-scale adoption of the top currency will lead us to a new modern financial world where transaction amounts will be denominated in smaller units.
The smallest units of Bitcoin, 0.00000001 BTC, are called Satoshis (or Sats in short), in a nod to the pseudonymous creator. At Bitcoin price now, 1 Satoshi is equivalent to roughly $0.00048.
The top crypto is considered a store of value, like gold, for many — rather than a currency. This idea of the first cryptocurrency as a store of value, instead of a payment method, means that many people buy the crypto and hold onto it long-term (or HODL) rather than spending it on items like you would typically spend a dollar — treating it as digital gold. Let me know what you think about my analysis, and please hit boost and follow for more ideas. Thank you, and I wish you successful trades!

Bank Nifty Bullish EntryBank Nifty has given a very good technical entry today to go positionally Bullish.
Flag Breakout in Daily chart and Inverted Head & Shoulder Breakout in intraday chart with a retest to touch ALL TIME HIGH!
2% Target can be easy coming in very short time.

Ethereum is bullish and expecting a 27% riseEthereum is very bullish, in my opinion. We see that the price went below the parallel channel, but there is no bearish follow-through. In my opinion, this is a bear trap, and we will continue to go higher. 27% pump is my net target; take profit at the top of the trendline, as you can see in the picture. The good news is that the ABC correction has been completed successfully. It is starting, guys. Let me know what you think about my analysis, and please hit boost and follow for more ideas. Thank you, and I wish you successful trades!
Ethereum has pioneered the concept of a blockchain smart contract platform. Smart contracts are computer programs that automatically execute the actions necessary to fulfill an agreement between several parties on the internet. They were designed to reduce the need for trusted intermediates between contractors, thus reducing transaction costs while also increasing transaction reliability.
Ethereum’s principal innovation was designing a platform that allowed it to execute smart contracts using the blockchain, which further reinforces the already existing benefits of smart contract technology. Ethereum’s blockchain was designed, according to co-founder Gavin Wood, as a sort of “one computer for the entire planet,” theoretically able to make any program more robust, censorship-resistant and less prone to fraud by running it on a globally distributed network of public nodes.
In addition to smart contracts, Ethereum’s blockchain is able to host other cryptocurrencies, called “tokens,” through the use of its ERC-20 compatibility standard. In fact, this has been the most common use for the ETH platform so far: to date, more than 280,000 ERC-20-compliant tokens have been launched. Over 40 of these make the top-100 cryptocurrencies by market capitalization, for example, USDT, LINK and BNB. Since the emergence of Play2Earn games, there has been a substantial increase in interest in the ETH to PHP price. Let me know what you think about my analysis, and please hit boost and follow for more ideas. Thank you, and I wish you successful trades!

Bitcoin is ready to go higher to 48600 USDT. Here is whyBitcoin is ready to go higher. The price is inside this ascending parallel channel, and the bullish uptrend is intact. Usually, when you see an ascending channel on Bitcoin during a huge uptrend, it breaks to the upside. Let me know what you think about my analysis, and please hit boost and follow for more ideas. Thank you, and I wish you successful trades!
Bitcoin is the first decentralized, peer-to-peer digital currency. One of its most important functions is that it is used as a decentralized store of value. In other words, it provides for ownership rights as a physical asset or as a unit of account. However, the latter store-of-value function has been debated. Many crypto enthusiasts and economists believe that high-scale adoption of the top currency will lead us to a new modern financial world where transaction amounts will be denominated in smaller units.
The smallest units of Bitcoin, 0.00000001 BTC, are called Satoshis (or Sats in short), in a nod to the pseudonymous creator. At Bitcoin price now, 1 Satoshi is equivalent to roughly $0.00048.
The top crypto is considered a store of value, like gold, for many — rather than a currency. This idea of the first cryptocurrency as a store of value, instead of a payment method, means that many people buy the crypto and hold onto it long-term (or HODL) rather than spending it on items like you would typically spend a dollar — treating it as digital gold. Let me know what you think about my analysis, and please hit boost and follow for more ideas. Thank you, and I wish you successful trades!


A Confluence of Cup & Fib - Adani Ports :)For any script - When a News, Fundamentals and Technicals meet - then there its bound to
The recent positive ruling from the Supreme Court on the side of Adani Group against Hindenburg Report has definitely boosted Investor morale on all counters of Adani
From a Fundamentals perspective Adani Ports is a Rock Solid script as it has global presence in Physical Real Estate of each port and is continually trying to scale up across the world.
From Technical point of view on Monthly Chart:
1) Price Broke out of Long Term Parallel Channel (since IPO)
2) Rounding Bottom / CUP pattern BO also done on Monthly
3) The Cup pattern bottom retracement was at Fib 0.786 level and hence the Cup Target 1390 is exactly meeting Fibonacci Extension Target of 1.272
Confluence of Cup & Fib - is a double confirmation of structure and now that Channel is also broken out positively, the additional Fib extn targets will also be met
Targets 1390, 1665, 2450
Disclaimer:
Stocks-n-Trends is NOT a SEBI registered company. We do not provide Buy / Sell recommendations - rather we provide detailed analysis of how to review a chart, explain multi--timeframe views purely for Educational Purposes. We strongly suggest our followers to "Learn to Ride the Tide" and consult your Financial Advisors before taking any positions.
If you like our detailed analysis, please do rate us with your Likes, Boost and share your comments
-Team Stocks-n-Trends

EURUSD|Same direction with market trends and sales positionsAccording to the general structure, we realize that the sales pressure is still higher than the purchase transactions, so we mostly try to go along with the market trend with the sales transactions.
Returning from the support area, we wait to reach the specified resistance areas, which are valid price areas of 1.09629 and 1.10247. By seeing the appropriate confirmation, including stick candles, pin bars, and hammers, we can enter into sales transactions in these areas.
The support areas in my opinion are the prices of 1.08520 and 1.07800 for the target of sales transactions and seeing the price return from these areas, we can have short-term reactions from these areas.
resistance level= 1.09629 and 1.10247
support level=1.08520 and 1.07800

Inventing the "Growth" Story of Inventure "Growth & Securities"Inventure - A leading provider of investment advisory service and distributes financial products like mutual funds, insurance products, etc.
The stock turned Multi-bagged when it multipled from 0.80 / Share to 6.75 / share in a matter of 22 months. Now - after a perfect 0.786 retracement on the Fibonacci scale - it is all set to beat its earlier bull run.
Here are the Technicals:
Fib 0.786 Retracement on Monthly
Perfectly following a Parallel Channel on monthly since 10 years
A beautiful Rounding Bottom pattern - about to BO above 3.15 for Target of 4.8
Resistances:
A Multi-year resistance from its IPO duration in 2011 is pushing the price down from 3.1 levels. Inventure is all set to make new highs only 3.15 is taken out decisively on WCB
Targets
Short Term: 3.9
Rounding Bottom: 4.8
Fib Extensions: 6.15, 11.05
A True Multi-bagger in the making
Disclaimer:
Stocks-n-Trends is NOT a SEBI registered company. We do not provide Buy / Sell recommendations - rather we provide detailed analysis of how to review a chart, explain multi--timeframe views purely for Educational Purposes. We strongly suggest our followers to "Learn to Ride the Tide" and consult your Financial Advisors before taking any positions.
If you like our detailed analysis, please do rate us with your Likes, Boost and share your comments
-Team Stocks-n-Trends

Fib Circles for LifeThis is my first educational post.
This is not long or short.
This is just fib circles.
This tool is great for non-linear support and resistance.
you can also draw horizontal lines at the top of each circle to make your traditional fib extensions and retracements.
these can be used on any timeframe just like your standard linear fib ext/ret
The biggest rule of thumb is to draw this shape on a 45 degree angle.
you can check angles with the info line if a swing low to high in any area of the pa looks closed to 45 degrees.
Fib circles are magic. and colorful. and excellent for logarithmic chart.
try for yourself!


EGLD 200$ by Feb 11th?I love the idea of fractals, specially when it is to see a revival of a huge parabolic run.
Are you a believer of the 1.618 religion?

Why Fibonacci Works along with Ichimoku - $SPY - ExplainedYou read a lot about Fibonacci and realize it's everywhere but you doubt it. It is too good to be true. I present the chart where it shows that you gotta believe it. Well let's put it this way. If some believe in Fibonacci and trade accordingly it will move the market and that is exactly what happened today. I am still long on AMEX:SPY (I have gamble puts expiring Feb)
Still long because it respected the support. I believe it will be range bound as 476 is a huge resistance because if it crosses that it has to fly, There are lots of headwinds and the market has already built in the rate cuts which may come sometime later. One thing to note which no one is talking about - If there is a rate cut what does it tell you about the economy!

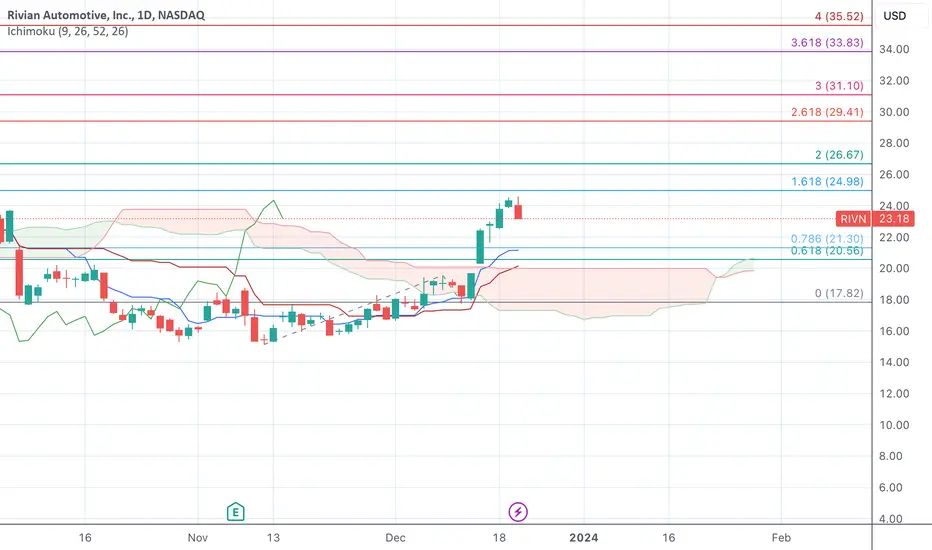
Validating $RIVN Ichimoku and Fibonacci - Trend AffirmedI want to validate RIVN on Ichimoku and Fibonacci.
The trend seems to be intact and not broken as it h as a big support at 20 as shown below. If it breaches the 26.8 resistance which is the Fib Resistance, it has to just fly from there.
Will watch closely and please provide the feedback
Navigating the Markets with Fibonacci ChannelsToday we delve into the fascinating world of Fibonacci Channels, a powerful tool for traders looking to identify potential non-horizontal support and resistance levels in the market.
Throughout the video, we provide a step-by-step guide on how to place Fibonacci Channels on price charts, allowing you to visualize and understand their significance in identifying key price levels. We also showcase real-world examples to demonstrate how Fibonacci Channels can be used to find points of interest, such as trend reversals and price targets.
Furthermore, we discuss the integration of Fibonacci Channels with other technical indicators, providing insights into how this combination can enhance your trading strategy. By the end of this video, you will have a comprehensive understanding of Fibonacci Channels and the ability to confidently incorporate them into your trading approach. Get ready to unlock the potential of Fibonacci Channels and take your trading skills to the next level!

#USDCHF possible bullish scenarioPrice is currently testing the lower boundary of a daily bearish channel , the 1 FIB extension level , and a long-term support area . This supportive cluster could potentially lead to the formation of a low around this price level.
On the other hand, the bearish move in price appears to be a corrective bearish ABC move , correcting approximately 61.8% to 78.6% from the previous bullish move.
If you've found this analysis helpful, please take a moment to like, comment, or share your thoughts with me.

EURUSD H4/H1/M30 Long entry in to 5 Wave.I'm currently looking for long on EURUSD. Count is derived from h4,h1,m30.
Entry to (5) Wave of Elliott Wave count.
There is nice looking end of ABC in lower degrees.
SL: Under Invalidation level = TOP of (1)
TP: TOP of (3); Also posible TP on Higer level - use FIB Expansion from (1)+(2).

Is $43310 a Local Top for #Bitcoin?Hi Padawans,
I've recently acquired the candlestick pattern from the 4000 to 69000 rally and strategically positioned it in the current scenario.
Disclaimer: I am not a financial advisor.
The 2.618 projection aligns with the 43310 mark.
Disclaimer: I am not a financial advisor.
May the force guide your endeavors.
Cheers,
CryptoObi

Fibonacci Retracement/Extensions- How & Why? | Live ExampleFibonacci retracements in technical analysis of various assets use a mathematical sequence discovered by Italian mathematician Leonardo Fibonacci. This sequence is a series of numbers where each number is the sum of the two preceding ones: 0, 1, 1, 2, 3, 5, 8, 13, 21, and so on. In stock trading, Fibonacci retracements are used to identify potential levels of support or resistance during price corrections.
Imagine you have a stock that has been rising in price for some time. Suddenly, it starts to decline. Traders who use Fibonacci retracements believe that during this downward movement, the stock price will likely retrace or bounce back to certain levels before continuing its downward trend.
These retracement levels are derived from the Fibonacci sequence. The most commonly used levels are 38.2%, 50%, and 61.8%. For example, if a stock's price drops from 100 to 80, traders would expect it to bounce back to around 88.20 (38.2% retracement), 90 (50% retracement), or 93.20 (61.8% retracement) before continuing its decline.
While their effectiveness is debated just like any other tool, many traders including myself believe that these levels act as psychological support or resistance points due to the large number of market participants who follow this approach.
Let us get back on the example above.
I drew a trendline which had helped me back in 2021 to predict the top in GOLD. This is the perfect example of how EVERY PRICE movement matters. The Fibonacci levels are derived from levels from 2008. In this example the Fibonacci extension level 3.618 held as a perfect resistance for the price of GOLD.
2008 to 2023, isn't this amazing? How long can a single price movement can have its affect!
How to draw a Fibonacci Retracement/Extension?
It's fairly simple. Just plot one end of the fib to the high of the price movement and the other to the low or vice versa.
I'll answering all your queries in the comments below. Please feel free to reach out!

Update on $STNE - Still Watching Fib and IchimokuMy update on $STNE. Still long and this is just showing my progress

Celestia target $27!Hello,
I put a fib extension on the Celestia chart and it turned out that the 3,618 level corresponds to the $24 price and the 4,236 level corresponds to the $27 price. From our point of view, it is a feasible target, at least in the first phase of the bull market, since Celestia is a solid project.
Below is our fundamental analysis, which you can also find on our Celestia website
SOCIAL & MASS MEDIA: Score 8 out of 10
AUDIT & SECURITY: Score 6.3 out of 10
TOKENOMICS: Score 3.6 out of 10
ECOSYSTEM DEVELOPMENT: Score 8 out of 10
TEAM & DEVELOPERS: Score 8.8 out of 10
PRODUCT & UTILITY: Score 4.8 out of 10
PARTNERS & INVESTORS: Score 7.5 out of 10
OVERALL SCORE: 6.56
