A wave count for BTC, my current planI am looking at the wave 4 retracement lows, I have 4 levels of confluence (2xFibs, MA and POC) for around 22/23k. In normal market conditions.... ;-) If there is such a thing these days.
Fibonacci Extension

EURUSD H1, ABOVE 1.0591,TARGET 1.0674 -1.0806As expected,EURUSD hit 1.0635.
As I said in the previous idea, "So far, EURUSD still rejected from1.0340. While Above 1.0340, Potential Rebound to target 1.0635 & 1.0800."
For now, while Above 1.0591,EURUSD Still Bullish. Open The Way To Target 1.0674-1.0806 Area.
1.0459-1.0591 Neutral Area, Short Term Consolidation.
But, Below 1.0459, would Cancel EURUSD Short Term Bullish. Open The Way To Retest 1.0348.
Below 1.0348 Would be a Strong Bearish.

Chance to collect for long-term, 5.3 - 3.8On 4H TF
BINANCE:NEARUSDT is trading around 6.0
NEAR is hit a support at 1.272 Fib Extension but it might be drop one more to 3.8 before rally.
What next, wait and see

WLUNA attempting to rallyA small sliver of hope, WLUNA is responding very nicely to fibs and has formed a clean impulse wave to the upside from it's low of 0.000065 based on the projection of miniscule 1&2 I'm assuming a 2.618 extension for miniscule 3, and a retracement to 61.8 in miniscule 4 with an estimated target of around 0.00385.

SUPER STRONG SUPPORT, next to 0.002034On daily chart
BINANCE:SOLBTC is in good support zone with Fibo Clusters. You can see on the chart.
#Two_Bottom is a good sign to open long order.
What next, wait and see

Dead cat bounce, in range 35 - 38KOn daily chart
BTC is creating a temporary bottom around 29K and prepare to bounce before drop again.
BINANCE:BTCUSDT has two supports at 23300 and 20800. You can see on the chart.
A good zone to use DCA way from 23300 - 20800
What next, wait and see

Winter Is Coming » The Great Reset? As you can see, this is a monthly view of the SPDR S&P 500 index - ticker symbol $SPY - on a monthly basis.
We have just closed Q1, 2022 with a truly epic rally: $AAPL had its best stretch since 2003, and a series of hot stocks ($AMZN, $GOOGL, $TSLA, $GME) have either confirmed stock split plans or have mentioned the serious possibilities of it.
We have closed the month with a bullish engulfing candle on the monthly chart.
$QQQ's monthly chart looks like a hanging man - today's selling put us just under an engulfing.
We're going to see some interesting action in Q2, and in the next few weeks, but don't let yourself be fooled into thinking Feb24/Mar14 was the bottom by idiots like Cramer.
Good luck out there.
I invite anyone to present their bullish or bearish thesis in the comments section!


Ascending Broadening Wedge Breakdown on ROKUI will be targetting the 1.618 Retrace from the Previous Low to High on this short trade.

BTCBottoms in? Or $20K w3 then $7K W5. Let me know what you guys think in the comments. And remember Big Mike loves all of you even the people watching my video while they poop. ;)

5/18/22 CFCF Industries Holdings, Inc. ( NYSE:CF )
Sector: Process Industries (Chemicals: Agriculture)
Market Capitalization: $22.623B
Current Price: $101.61
Breakout price: $109.50
Buy Zone (Top/Bottom Range): $99.80-$84.80
Price Target: $152.30-$154.00 (2nd)
Estimated Duration to Target: 187-195d (2nd)
Contract of Interest: $CF 11/18/22 105c
Trade price as of publish date: $14.10/contract

5/18/22 SBLKStar Bulk Carriers Corp. ( NASDAQ:SBLK )
Sector: Transportation (Marine Shipping)
Market Capitalization: $3.267B
Current Price: $30.65
Breakout price: $32.00
Buy Zone (Top/Bottom Range): $30.55-$26.80
Price Target: $39.60-$40.00 (4th)
Estimated Duration to Target: 225-232d (4th)
Contract of Interest: $SBLK 11/18/22 30c
Trade price as of publish date: $5.00/contract

5/18/22 SPYDSPDR Series Trust High Dividend ETF ( AMEX:SPYD )
Sector: Miscellaneous (Investment Trusts/Mutual Funds)
Market Capitalization: $ --
Current Price: $43.04
Breakout price: $43.80
Buy Zone (Top/Bottom Range): $43.40-$42.40
Price Target: $44.20-$44.40 (1st), $46.20-$46.90 (2nd)
Estimated Duration to Target: 69-70d (1st), 142-150d (2nd)
Contract of Interest: $SPYD 6/17/22 42c, $SPYD 9/16/22 42c
Trade price as of publish date: $2.50/contract, $2.95/contract

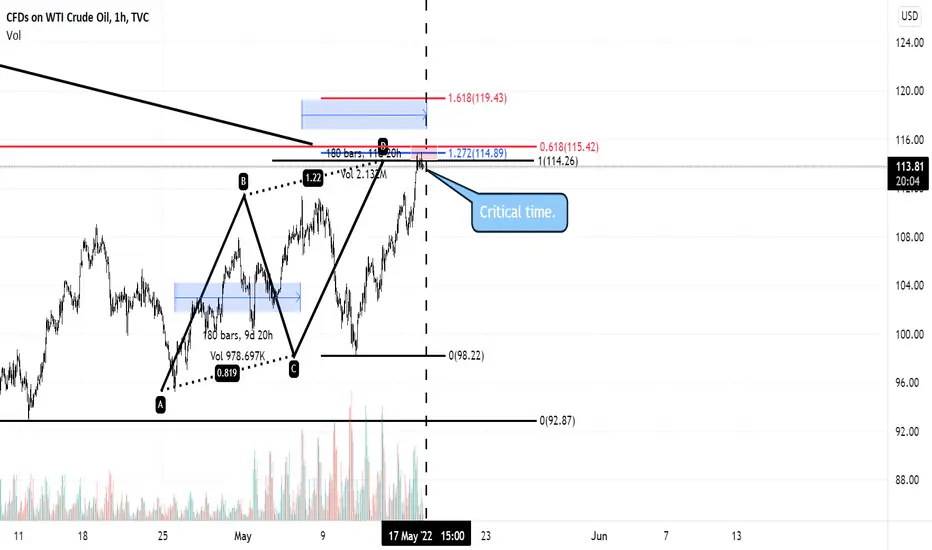
USOIL - AT A KEY LEVEL!!OIL is up over $17 over the last week and has come into a critical area between 114.26 - 115.42.
This is the area where we have the ABCD completing and also the 61.8% Fib level from the March high.
We have a critical turn point coming up which gives us A-B=C-D in time. I will post the AI in the update area with expected trend for the day and we could get a minimal move back down to 105-107 area but possibly more with a bigger correction.
Above 116 and it could get to the 1.618% expansion of the last correction near 120.
I hope this helps. Enjoy the day.👍👍
BTC bull weekly chart 15th of May 2022hi guys,
this is my bull idea for BTC using Elliot waves & Fibo timezones. According to this we should see a run up to 70 k in the following months followed by a deep correction on E wave. Later the price projection takes us to 160.000 $.
NFA, DYOR.

autumn befor winter for BTCbased on the price and time fibbo levels which has projected from the the third bullrun (wave3) to the end of the covid effect, I can see that Bitcoin almost has copleted it first part of bear market and its going to draw a right shoulder while hunting 64k buyers and fall down to the origin of wave 5 around 12k.
we couldn't expect bull market befor next 1.5 year,

XRPIDK but I think that was about it, time for a recovery.
And possible wedge breakout.
If yes that is a massive bearish wedge that started back in 2021 and a break out above .68c would be significant IMO.

Easy 5:1 ETH Short On the CardsFTX:ETHPERP Trade thoughts:
With the aggressive downside move this week, buyers trying to take back control of market, but bears are not finished. I think bear market is upon us as weekly structure has been taken out for BTC, and for ETH its just a matter of time - once we break and close below 1889 on weekly timeframe bear market will be confirmed for me. This is last attempt to push the market back up by Bulls.
PA is without question trending down with price below the 4H 50 EMA, and consistent lower lows, lower highs.
Good time to sit back and wait for the next short opportunity with PA destined to head back down.
Keep stops above structure level and an easy 5:1, and possibly 15:1 once you can safely tighten stops after stop hunt attempts. Keep above 2456 until you can be certain.

2W BTC bull run profit targets To determine possible stepping stones in the incredible journey of our favorite asset class (yes - bitcoin) we look at the bi-weekly chart, and draw fibonacci trend extension from near 0 to the peak in 2019 and to the all time low after that (122, 19690, 3120). We also draw the 100 moving average line to observe how BTC successfully bounced off it 2 times - in an essence confirming there there never was a bear market in the bitcoin life-time, at least not from the bi-weekly perspective.
We witness the HODLers triumph. (Well done, party people!)
We notice:
1) bitcoin currently is testing resistance at 1.618 extension level. This is a good time to take profits and to wait for a pull-back to re-enter. pull-backs to 30k, 20k are very likely in the next few months. even below 10k levels are possible if there is a significant negative news. No matter what happens - we predict that bitcoin wont' fall below 100 MA on the 2W timeframe. Fundamentals are way too strong: more and more institutional buy-ins, public interest all time high, relentless money printing by the governments).
2) using our tea-leaf indicator we predict new all time high above 40k before august 2021, and 85k levels by the end of 2024.
3) we watch out for ETH 2.0, and bitcoin profits moving into slakeable assets such as PolkaDot.

ALGOUSD: Hidden Bullish Divergence at an .886 Visible on WeeklyWe have a Bullish Shark Here and if it plays out we could first see a rally to the 1.13 Extension above and as high as the 1.618 Extension Above

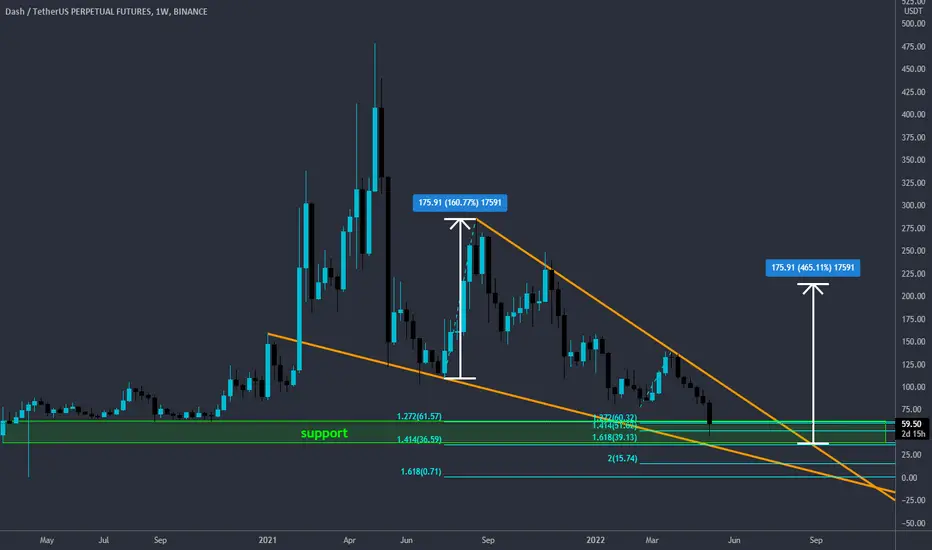
DASH falling wedge#DASH/USDT
$DASH inside falling wedge.
there is a long term support zone between $60 and $36 that is the same with lower line of wedge.
🐮 holding this support zone will increase price to upper line and if break out from wedge the target of this pattern will be around $200 in long term.
🐻 break down from lower line will drop price to $16 and $0.7.
MATIC/USDT - Waiting game for $9 targetHello traders and investors,
Today we look at polygon matic / USDT pair with the usual critical eye.
Looking at the recent moves, I see that intermediate blue wave 3 reached the 3.618 Fibonacci target with a series of 1-2 1-2 1-2 extensions.
I believe that May 2021 pick was intermediate blue 3 rather than primary purple wave 3 because I compare the size of the red minor degree wave 2 and wave 4 (he look similar 35days correction and 37 days correction).
Therefore I assume that we are currently in the creation of intermediate blue wave 4 and it will take some time to complete (1.618 or 2) of wave 2, with a retracement that should bring us in the same region of wave 4 of one less degree. (Ahimé at $0.33).
If that is the case, I will once again fill my bag and wait for the explosive composition of intermediate wave 5 of primary 3 which is currently at 2.618.
I have no rush in buying now. Waiting for the market to play out, if minor wave A red is actually the end of the entire correction, it means that it took only 38.2% of the time of intermediate wave 2 and retrace only 23.6%. It's possible, but I will be waiting for the market to unfold in the next few days before considering an alternative.
What do you think? What's your target?

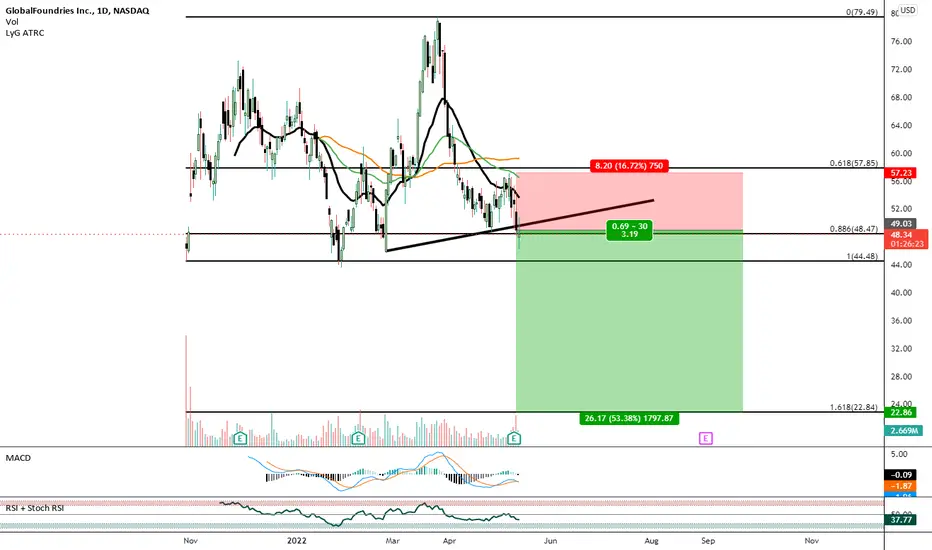
MACD Bearish Convergence Below Demand Line on GlobalFoundriesI have bought the Quarterly PUTs on this as i believe it is due for a 1.618 Retracement after it breaks through it's last support levels.