Elliott Wave CheatSheet with Fibonacci Targets - LogScaleHi EW Fans,
added some interesting and helpful Fibonacci Numbers in Terms of Elliott Wave from an old Sheet i have found in the Web. You need to switch your Chart and your Fibonacci Tool to Log-Scale.
Greetings
Fibonacci Projection

Bitcoin testing exponential average of 89 and possibly 200If it dips to the 0.618 retracement, the price will drop to $10,000/$9,000, testing the 200 average.

conservative long bitty on 1 hour chartexpecting bitty to bottom at circa 20.3k, but seems market stabilizing ahead of my bottom target, will long bitty with stop loss at 20.9k in case market will go against my trade. long target for my hourly chart is around 26.8 to 28k the daily 200Moving Average.

NQ - correction or turning bearish?NQ currently has an immediate resistance turned support at 12900.
Near term support zone is between 12750 - 12900.
12750 is where I marked D which is a confluence of:
1. the 100% fib projection of the previous correction from A to B (projected onto C)
2. the 50% fib retracement level of the BC mini swing up
As long as NQ does not go below 12750 (+/- 50), it is still within "normal" correction for now. No need to "panic" yet!
p/s all bullish bets off if NQ had a close below 12700
Disclaimer: Just my 2 cents and not a trade advice. Kindly do your own due diligence and trade according to your own risk tolerance and don't forget that money management is important! Take care and Good Luck!

BTCUSD's Fibonacci Tea Leaves Provide Some Helpful HintsBTCUSD's Fibonacci Tea Leaves May Provide Some Helpful Levels
BTC's Downtrend Since November 10, 2021
BINANCE:BTCUSDT (BTC) has been in a downtrend since its all-time high of $69,000. But it has trended higher in a fairly choppy pattern since its major low on June 18, 2022. Many debates have arisen over whether BTC and other cryptocurrencies have found a lasting bottom that will lead to another bull market. The same questions and arguments arise for equity indices, which have experienced a bear market along with cryptocurrencies.
The Debate Whether BTC Has Formed a Lasting Low
Many different methods—fundamental and technical—have been explored to solve the question of where BTC's price goes next and whether a rally back to all-time highs has begun or whether another series of price declines lies ahead.
One fundamental method some analysts use is called on-chain analysis, but that has likely been the basis for opposing conclusions depending on the biases of the analyst. Glassnode's on-chain analysis has suggested recently that an inflection point may require the capitulation of long-term holders (HODLers). In Forbes this week, Glassnode is quoted as saying: "Bottom formation is often accompanied by shouldering an increasingly large proportion of the unrealized loss." It explained further that "for a bear market to reach an ultimate floor, the share of coins held at a loss should transfer primarily to those who are the least sensitive to price, and with the highest conviction." In any event, this article will not attempt to comment on the validity of any particular fundamental view —the fundamental view provided only for context and newsworthy information.
Important Levels from Fibonacci Analysis
Fibonacci ratios can be used in a variety of ways in technical analysis. Fibonacci analysis does not have any particular edge over all other forms of analysis, but instead, it is one of many tools that may offer helpful information in analyzing the price activity of a liquid security.
No form of technical analysis, including Fibonacci, is infalliable, and none serves as a crystal ball that predicts every price move or wiggle. Simply put, technical analysis does not offer a photographic view of the future of price. If it did, markets could not function effectively or efficiently (unless the photographic view of the future were limited to a select few by cost or other means).
But using Fibonacci ratios to analyze price may help identify both time and price areas that can be important to watch. In particular, it helps to see how price interacts with such levels.
BTC's Longer-Term Fibonacci Retracement Levels
Fibonacci retracements apply the Fibonacci ratios to an identifiable price move between a high and a low or between a low and a high. These ratios are applied to the distance between a selected high and low so that as price retraces a previous move, the ratios can be viewed as either support or resistance.
For BTC's major retracement levels, see the horizontal levels on the primary chart above and the horizontal levels on the Supplementary Chart 1 below. The primary chart above shows the retracement levels from the all-time low ($2.22) to the all-time high ($69,000). Retracement levels tend to have greater significance when, as here, they apply over a long period of time and cover price action at the highest degree of trend. (No swing high or low has more significance than an all-time high and all-time low of a security or other asset.)
Price appears to have remained stuck below the .618 retracement (R) of BTC's entire price range. This major .618 R level is the horizontal yellow line on the main chart above, and it lies at 26,359.37 . BTC broke through this key level on June 13, 2022. It had tested this level on May 12, 2022, when it held as support the same day (note the long candle shadow piercing the .618 R on May 12, 2022, and the close above this level).
The fact that price has remained contained below the .618 R for almost a month and a half has bearish weight, though it's not conclusive. The importance of this level combined with the fact that another important longer-term Fibonacci level lies very near to it (a Fibonacci cluster) suggests that this area may attract price in the near term. It will be important see whether these levels repel price, or whether price can break above them.
The next chart shows the Fibonacci cluster described. The .618 R level of BTC's entire range has been drawn on the chart next to the other key level, the .618 projection of the first leg in the bear market as measured from the start of the second leg. This .618 projection lies at 25,950 .
Supplementary Chart 1: Fibonacci Cluster with Two Longer-Term Fibonacci Levels Shown in Yellow
BTC's Fibonacci Channel Containing Price Since the All-Time High
A Fibonacci channel is another approach to Fibonacci. It shows Fibonacci relationships in a more dynamic way. The zero line works as a baseline from which all other Fibonacci levels are then drawn parallel using Fibonacci proportions. The zero line contains price in much the same way as a regular uptrend or downtrend line.
The primary chart above shows the Fibonacci channel for BTC's price. It has identified a significant number of support and resistance areas. The most prominent area is the diagonal .618 line which has acted as support a number of times such as in February and March 2022 and in May 2022. The .618 diagonal line also operated as resistance a few times (e.g., December 2021 and mid-January 2022).
Note how the .618 diagonal line for the channel held support at the pivotal selloff on May 12, 2022, and on this date, the .618 diagonal line coincided with the .618 R ( horizontal yellow line showing BTC's .618 retracement of its entire price range).
Finally, over the past 10 days, it appears that BTC's price has been working to push through the .236 diagonal line (teal). It has pushed above it slightly on several days but closed back below it: note the candle wicks piercing the line with closes below it. Today's push above the .236 diagonal line may end the same way as prior days.
But if BTC holds the .236 diagonal line as support, the next level will be the zero diagonal line (blue), which was strong resistance at the end of the rally in late March 2022.
Importantly, to even approach the zero diagonal line (blue), BTC's price must push through the major .618 R (horizontal yellow line) unless BTC's price consolidates or pulls back and only later tries to reach the zero diagonal line on August 19-20, 2022 . Why this date? BTC's .618 R (horizontal yellow line) coincides with the zero diagonal line (blue) on August 19-20, 2022. See the blue-filled circle on the main chart above showing where the two levels coincide. August 19, 2022 is significant date for equity indices: it is monthly options expiration, which can sometimes, though not always, serve to shift the direction of equity indices. This will be interesting to track.
Tug of War Between BTC's 1.00 Projection Level at 12,173 and the Horizontal Fibonacci Cluster at 25,950 to 26,359
The Fibonacci cluster described above includes the major .618 retracement (horizontal yellow line on the main chart above) as well as the .618 projection (horizontal line shown in Supplementary Chart 1). As noted, the Fibonacci Cluster coincides with the zero diagonal line from the Fibonacci Channel on August 19-20, 2022.
This Fibonacci cluster and the zero diagonal line may play tug of war with another key level at 12,173 (see green horizontal line on Supplementary Chart 1 below). This 12,173 level is the Fibonacci 1.00 projection of the first wave of the decline as measured from the start of the second wave of the decline. Each wave of the decline has been labeled on Supplementary Chart 1 below. Perhaps price will tag them both in the coming weeks.
Supplementary Chart 1: Fibonacci Cluster with Two Longer-Term Fibonacci Levels Shown in Yellow
Fibonacci Time Analysis with Potential Dates for Turning Points
Supplementary Chart 2 below shows some Fibonacci time analyses drawn vertically with TradingView's Trend-Based Fib Time tool. The blue circles indicate where the Fibonacci proportions in time identified—or nearly identified, meaning within one to three days—a significant price move. The red circles indicate upcoming dates at Fibonacci proportions in time based on the length of time of the prior price swings.
Coincidentally, consider the August 19-20, 2022 date discussed above where a horizontal .618 R of BTC's entire price range coincides with the zero diagonal line of the Fibonacci channel. This falls quite close in time to another Fibonacci time-based level: the 1.272 extension of the time span between March 28, 2022 high and the June 18, 2022 low (shown vertically in teal). Note also how other recent minor price highs in the past month were captured by this Fibonacci time-based tool.
Lastly, October 29 to November 1, 2022 also appears that it might have significance. Three golden ratios (.618, 1.618, and 2.618) based on the entire price decline in terms of time, and based on the March 28-June 18, 2022 price decline, fall in this period. It may be worth watching what sort of price moves lead to this level and whether other technical evidence supports a potential reversal there.
Supplementary Chart 2: Fibonacci Time Analysis
BITSTAMP:BTCUSD
COINBASE:BTCUSD
KRAKEN:BTCUSD
BINANCE:BTCUSDT
CME:BTC1!

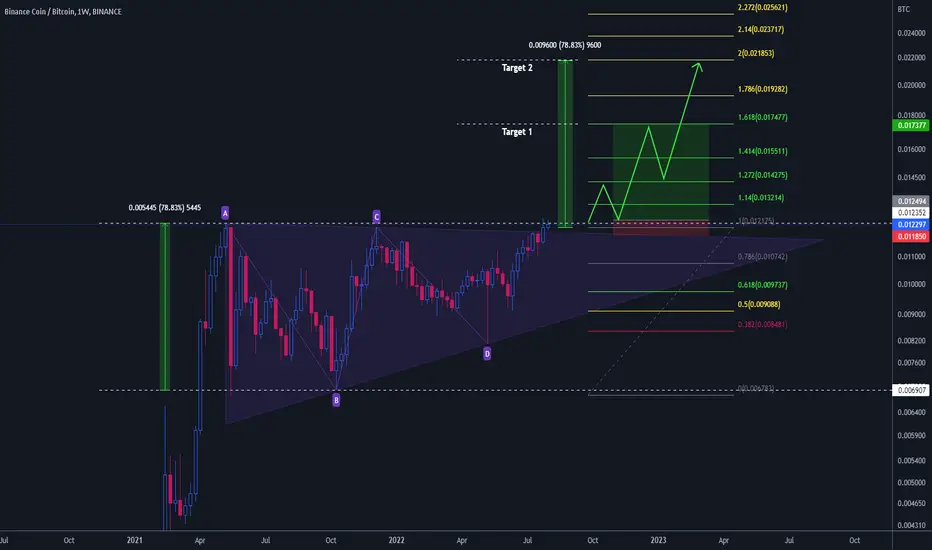
BNB/BTC in ascending triangleBNB is a utility token from Binance exchange.
With it, it is possible to have discounts on trading fees and passive income in DeFi/CeFi.
On the chart we have an ascending triangle about to be broken.
BTC May Be Stalling at Symmetry ResistanceBTC May Have Stalled Right at Symmetry Resistance
BTCUSD may have stalled today at symmetry resistance today. The symmetry resistance is measured using a Fibonacci-style projection (called an extension on the TV tool settings). The levels derive from projections of prior counter-trend rallies since the YTD low on June 18, 2022.
The first symmetry resistance lies at 22,710.95. The second symmetry resistance lies at 23,024.65. This area is right where price stalled today and pulled back significantly. Note that these two resistance levels are green-colored Fibonacci projection lines. And these two price points are highlighted with an orange circle (blue border). In short, they project the first two corrective waves off June 18 lows from the most recent low (designated by a blue arrow).
This symmetry level coincides almost exactly with the top of the parallel trading channel (bear flag) in which BTC has traded since its June 18 low.
The fact that price reversed here suggests that the breakout in volatility may likely be accompanied by a resumption of the larger-degree downtrend.
But price must be given a chance to retest the top trendline of the bear-flag channel as well as symmetry resistance. It may even attempt a whipsaw break (i.e., a false breakout) up to the 1.272 extension, a common target when using Fibonacci projections. Those lie at the second orange circle on the chart above: 23,746.02–24,229.36. Price doesn't have to do anything we think it should, but this merely suggests a possibility of 1.272 projections being tested before the looming breakout (described in my related post below).
Volatility Compression Suggests Looming Breakout
Previous posts discuss potential Fibonacci targets as well as the volatility compression that has developed in BTC's price action over the past month. This volatility compression signals a likely volatility expansion. Typically, breakouts in volatility accompany breakouts in price ranges. Although many bottom-pickers may attempt to view each new downdraft as the final low, the more reliable approach is to favor trend continuation over trend reversal as the higher-probability scenario. See, e.g.,
The past 7 months presents an excellent example of this concept. Those favoring trend continuation at each new low in BTC or KRAKEN:ETHUSD YTD have had much more success (protecting capital, profiting from directional trades) than those expecting major trend reversal upon each corrective rally.
CME:BTC1!
BITSTAMP:BTCUSD
COINBASE:BTCUSD
KRAKEN:BTCUSD
BINANCE:BTCUSDT

BTCUSDT AB=CD Harmonic potential targetBTCUSDT AB=CD Harmonic potential target plus major Head and Shoulders target. Oscillator Ehlers' Stochastic Center of Gravity ( ) hidden bearish divergence. 30M overbought.

BTCUSDT AB=CD intraday target updateI'm updating my targets from this harmonic pattern AB=CD at 3.33 Fibonacci ratio plus one more Fibonacci Retracement level.

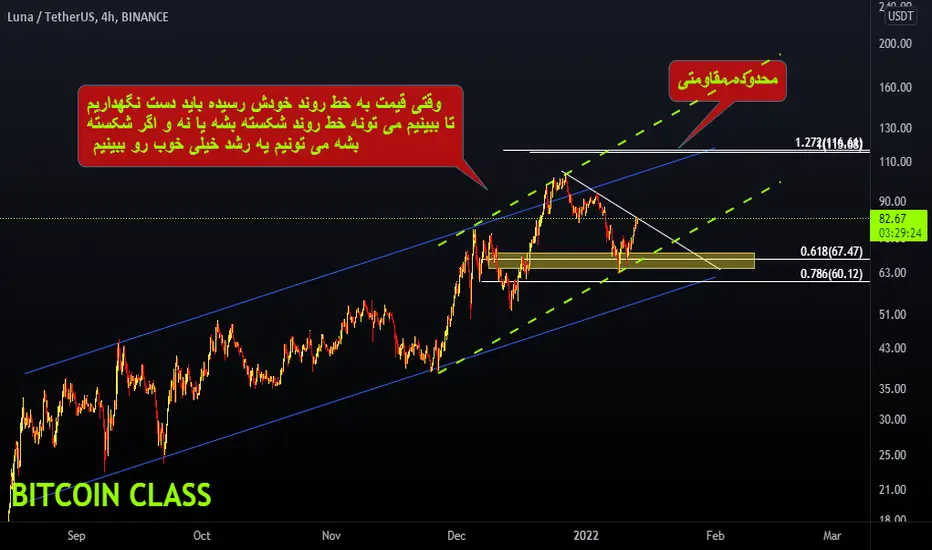
Hand to triggerBINANCE:LUNAUSDT
When the price reaches its trend line, we must hold on
To see if the trend line can be broken or not and if it is broken
Well, we can see a very good growth
Tesla will reach ≈ 3200 by Mid of 2022 ? 5/Jan/221)On Charts : Charts consist of 3-Dimensions - The X-factor ( Time or Cycle ), The Y- factor ( Price Geometry ), AND The Z-factor ( The Speed ).. 2)On Elliot Wave / Market Structure : Unlike Textbook written rule : ALL Impulsive wave comprise of ONLY a-b-c sub-waves NOT 1,2,3,4,5 waves.. AND there is NO Truncated 5th wave BUT ONLY wrong wave counts...

NQ - Bear or correction?Despite the horrendous sell-off in the past week and all the negative news (omicron variant, bond tapering fear, persistent inflation), the fact remains that NQ's uptrend has not been breached and we are still only in "correction" (and not "bear") territory.
Nasdaq is now at an intermediate support, which is:
1. a prior resistence turned support at A
2. 50% fib retracement of BC swing up
3. 100% fib projection of the previous AB swing down at C
A worse case scenario for this "correction" is for NQ to retrace all the way to the rising longer term trendline (red) around 15300. Should this happen, then NQ could find more solid support here (which is also the 61.8% fib retracement of the BC swing). Even at this level. the correction would have been around 8.8%, similar to the last few major corrections we have been seeing this year.
So my take is not to get too bearish at this juncture. The signs could be clearer after the next Fed meeting minutes on Dec 15. For now, I'll let the rising trendline speaks for itself.
Disclaimer: TA is about improving our odds of a successful trade (not a guarantee). This is just my own analysis and opinion for discussion and is not a trade advice. Kindly do your own due diligence and trade according to your own risk tolerance and don't forget that money management is important! Thank you. Do give me a thumbs up if you agree. Feel free to let me know what you think! :)

GO LONGFIB channel shows a strong support taken and bottommed out look for SL @ 302 & enter above 326 short term target 356,mid term 380, long term 470. disclaimer apply, do your own research please. thanks.

Interesting Fib Circle PeaksOn this chart it can be seen that Fib circles correspond to opposite peaks within the current uptrend (red ovals)
I'm not sure of the correlation and causation of this, but it is pretty cool to see
Price will likely continue up through the channel placed

Fib Circle Rise (Inverse) XRPBTC is within a huge symmetrical triangle
Its not a matter of if, a matter of when.
Above is the "fib circle dump" scenario. I have applied this inversely to the XRPBTC chart, which would implicate a moonshot along the side of the circle

Classic Fibonacci retracement to 0.382This is going to be a textbook Fibonacci retracement from a clearly exhausted rally back to 0.382. Keep an eye on this set up it will happen quick and continue on its upward macro trend. The high impact new coming out of japan will help the downward pressure to 0.382....a key natural level.
This is not financial advice.

BTCUSD I see BTC going back to its ATH , and if price breaks above I see it heading up to the next fib level which is 75,525 ish- on this monthly fib circle.
Price has reacted and respected all previous Fib Circle levels.
My sell break and buy break areas are listed there.
If it breaks my by break at 63993 it will go to the ATH at around 64,745.0 Here price will either break or reject back down to about 60k
If price doesn't break 63,993 but instead breaks the sell break at 63662, then I predict price will retrace back down to 60k as well

ETH/USDTBINANCE:ETHUSDT
According to Bitcoin, which is being reformed, most currencies
Almost have a fall guard but if the atrium fails
A break in the 3470 range could be as high as 1 Fibonacci support
Have a fall and then be backed up again

BTC/USDTBINANCE:BTCUSDT [/symbol
Hello serve friends as in the pre-resistance analysis
We had identified the broken and managed the entire range of resistance
Get out of its way and now the market needs a correction
And then can continue its path upwards again

BTC Descending scenarioBINANCE:BTCUSDT
If you look closely at the previous channels, you can see that with little penetration
We saw a sharp drop to the bottom of the price channel, so if the bottom of the channel
If it breaks, there is a possibility that we will have a severe fall
So friends who want to position shorts are waiting for the canal floor to fail
They are expensive and in case of failure, there is a possibility of falling up to 38 thousand

BTC Assending senarioBINANCE:BTCUSDT
To be able to take a long position more easily, wait first
Until the price reaches the bottom of the channel and then make a decision and in
The second case is the emergence of strong ascending candlesticks that you can
Analyze the volume of the candlesticks and then enter

BTC Ascending scenarioBINANCE:BTCUSDT
The bullish scenario is that if the price can
Form a new roof by getting confirmation with a small amount
You can enter into a transaction and have capital management
And after breaking the roof of the triangle, add volume again

Bitcoin AnalysisBINANCE:BTCUSDT
If you look closely at the last few candles, you can see the power
Buyer and seller are almost equal and this is the mark
The giver is that we have to wait for a strong fall or a strong rise from the market
