BITCOIN → Correction or trend reversal? Why is 101K important?BINANCE:BTCUSDT.P is exiting the upward channel after a false breakout of the key resistance level of 110K (previous ATH). Liquidation?
Quite an interesting situation with James Wynn. As they say, money loves silence, especially when it comes to a highly manipulated market... A week after the whale's actions, Trump decided to play the market again by creating emotional swings: he announced tariffs on the EU, canceled them, then made claims against China and is now ready to reintroduce tariffs on the EU. Things didn't end well with James... Liquidation before the rally?
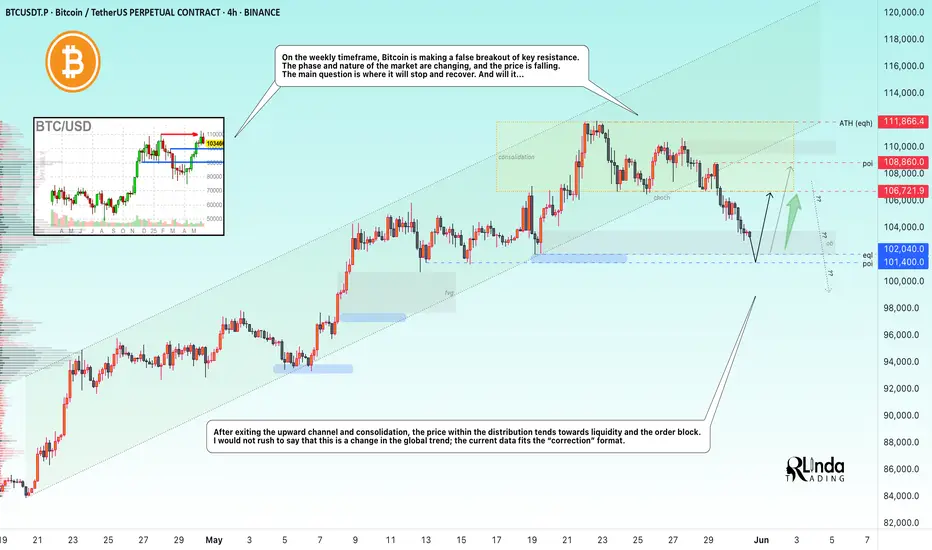
On the weekly timeframe, Bitcoin is making a false breakout of the key resistance level of 110K. The phase and nature of the market are changing, the price is falling, breaking the structural support of 106500. The main question is where the stop and recovery will be. And will there be one...
After exiting consolidation and the upward channel, the price within the distribution is moving towards liquidity and the order block. I would not rush to say that this is a change in the global trend; the current data fits the “correction” format.
Support levels: 102000, 101400
Resistance levels: 106700, 108800
102-100K is a fairly important zone for the market; a breakout in this area could open the way to a (local) bottom. Bulls may not be able to hold the market, in which case a global sell-off could form. Therefore, I believe that retesting the 102000 level will end with a liquidity grab and a correction along the trend, during which the price may test the 106K - 108K level, which will determine the future of the market: consolidation, growth, or decline...
Best regards, R. Linda!
Fibonacci Retracement
EURUSD 4H ELLIOTT WAVE COUNT – DOWNSIDE TARGET CONFIRMED!Good Morning, Traders,
I’m sharing my wave analysis for EURUSD with you. After completing its first five waves, it formed the A-B wave and is now expected to move into the C wave.
The target level for the C wave is currently 1.11838.
I meticulously prepare these analyses for you, and I sincerely appreciate your support through likes. Every like from you is my biggest motivation to continue sharing my analyses.
I’m truly grateful for each of you—love to all my followers

BTC/USD 4h Char ReviewHello everyone, I invite you to review the current situation on BTC taking into account the 4-hour interval. We can see how the price is maintained just below the upward trend line, while a downward trend channel may be forming locally.
Here you can see how the price decline is maintained in a strong support zone from $ 105,000 to $ 103,150, however, if the support zone is broken, the price may quickly fall to the support area at $ 100,700
Looking the other way, you can see that when the trend reverses, we first have resistance at $ 106,560, the next is at $ 108,590, and then you can see very strong resistance at the level of the last ATH in the area of $ 112,000.
On the MACD indicator and the RSI indicator, you can see how we are maintaining in the lower part of the range, which indicates that the price bounce is still taking place to continue the growth.

Draw on liquidity on altsSimple analysis really, we measure previous range and identify areas below premium that will attract price

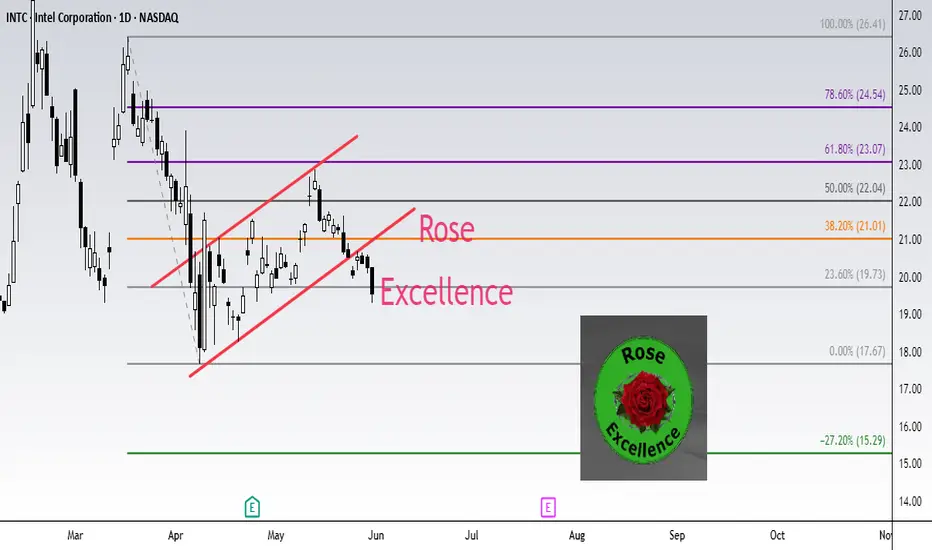
INTEL INTC Short setup target 15.29Fibonacci technical analysis : Intel Corporation NASDAQ:INTC has already found resistance at the Fib level 61.8% (23.07) of my Down Fib. The May 30th Daily candle has closed below retracement Fib level 23.6% (19.73), confirming a sell signal. A Bear Flag pattern has also formed. My Down Fib guides me to look for NASDAQ:INTC to eventually go down to hit first target at Fib level -27.2% (15.29).
NASDAQ:INTC – Target 1 at -27.2% (15.29), Target 2 at -61.8% (12.26) and Target 3 at -78.6 (10.79)
Stop loss slightly above the 50.0% retracement Fib level (22.04).
Enjoy the trading process and take time to smell the roses🌹
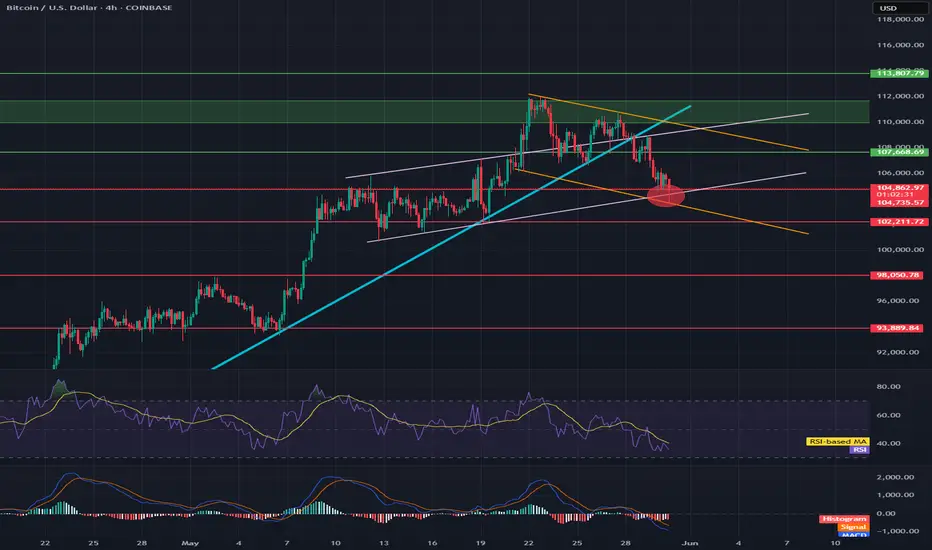
Will BTC hold its price?Hello everyone, I invite you to review the current situation on BTC. When we enter the four-hour interval, we can see how the BTC price has left the ongoing upward trend line at the bottom, and what's more, we can see how the current movement is creating a local downward trend channel in which the price is currently on the border of the previously created upward trend channel, which gives a strong support point.
Here we can see how the current downward movement has entered the support circle that starts around $ 104,800 and ends around $ 102,200, this is the place where two conflicting channels have converged. If these supports do not hold the price, we can see a quick recovery to around $ 98,000, and then to the level of $ 93,900.
Looking the other way, we can see that when the trend reverses, we first have resistance at $107,670, then a resistance zone from $110,000 to $111,700 is visible, at the border of two channels, and then resistance is visible around $113,800.
On the MACD indicator, we can see a return to the downtrend, while on the RSI we return to the lower part at the lower border, which could potentially provide energy for a future upward movement.
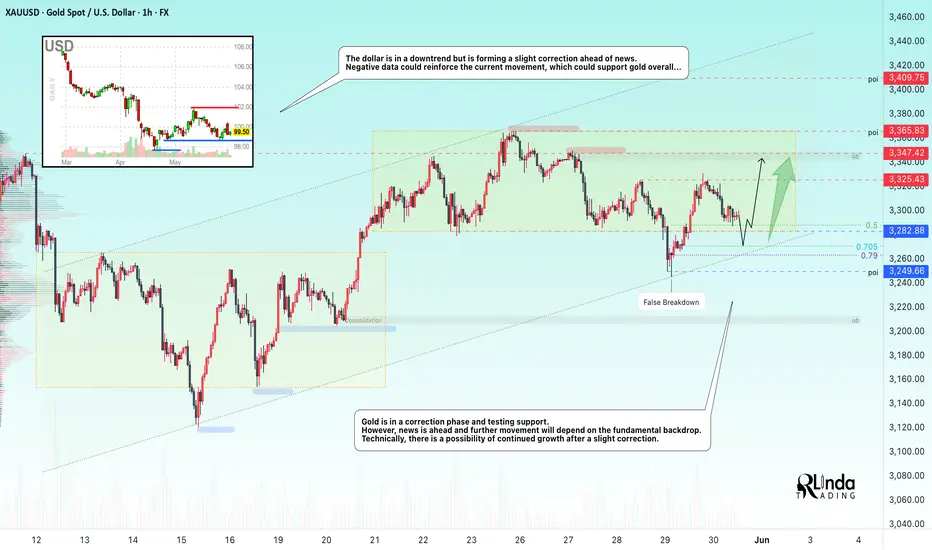
GOLD → Retest support before news...FX:XAUUSD is in a correction phase amid a rising dollar. The price is heading towards the liquidity zone, which may support gold. Markets are awaiting PCE data...
Gold is back in the red: PCE inflation and tariff news will decide everything. On Friday morning, gold fell, retreating from its recent rebound from weekly lows of around $3245. The price is under pressure from the strengthening US dollar, which was supported by court rulings on Trump's tariffs, but the situation around tariffs remains tense on all sides...
The focus is on PCE inflation data. A weaker result could weaken the dollar and support gold. Traders remain cautious in anticipation of volatility.
Support levels: 3282, 3270, 3260
Resistance levels: 3325
A retest of 3282-3270 could end in a false breakdown, but only if the fundamental backdrop is against the dollar, which would only support the price of gold. The price is most likely to be stopped by trend support, but no one can rule out the fundamental factor of surprise...
As a target, during a bullish impulse, it is worth considering intermediate highs...
Best regards, R. Linda!
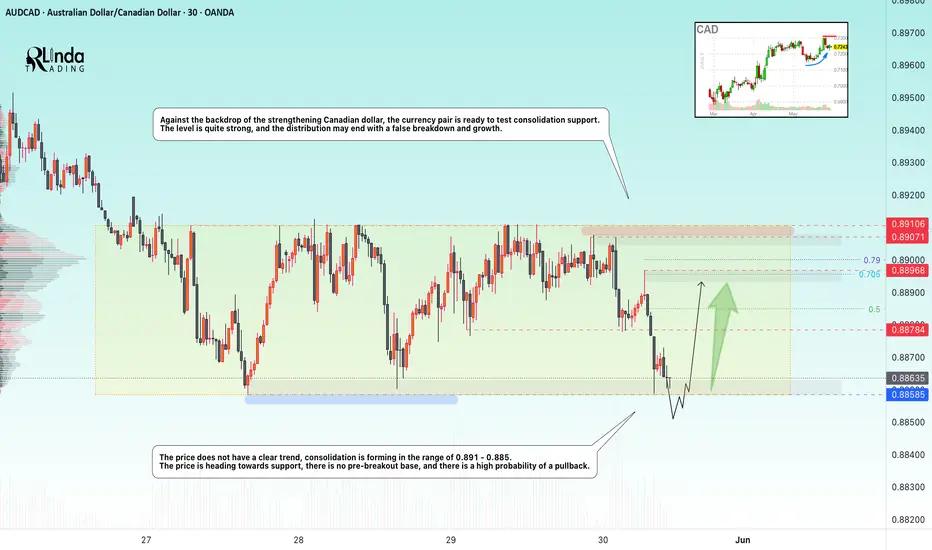
AUDCAD → Support retest. False breakdown?FX:AUDCAD is within the range. The price is heading towards support within the local distribution. There may not be enough potential for a breakdown of support...
Against the backdrop of the strengthening Canadian dollar, the currency pair is ready to test consolidation support. The price has no clear trend, consolidation is forming in the range of 0.891 - 0.885. The price is heading towards support, there is no pre-breakout base, the level is quite strong and the distribution may end with a false breakdown and a rebound...
Support levels: 0.8858
Resistance levels: 0.8878, 0.8897
Below the level of 0.8858, there is a fairly large liquidity reserve, and there is no global trend, which means a neutral situation. Retesting the support zone after a sharp decline may end in a false maneuver and growth.
Best regards, R. Linda!
$BTC Trend Broken - $102k NextThe trend has broken.
₿itcoin respects thy squigglets 🤓
$102k CRYPTOCAP:BTC here we come 🥸
If that doesn't hold, the 200DMA prophecy ~$95k will be fulfilled 🥲

GOLD- BULL SIGN - BUY CALL - Bullish Flag patternMarket is making a Bullish Flag Pattern and it seems when breaksout with a Buy Stop order, it will move to its projected TPs

BTCUSDT Market Analysis UpdateBINANCE:BTCUSDT Hi everyone, I hope you are doing well and I have put my opinion in Bitcoin price on the chart for you. and hope this helps you! Simple, concise, useful
Bitcoin (BTCUSDT) has broken below a key trendline, and we are now seeing a potential retracement towards a demand zone around $66,771.5, which could act as a strong support level.
Breakdown & Retest: BTC has fallen below a significant trendline, confirming a bearish move. A possible retest of this zone before further decline is likely.
Long Entry Consideration: If price stabilizes and shows bullish confirmation at the highlighted demand zone, it could provide a strong long opportunity.
Bearish Scenario: A clean breakdown of this level could signal further downside potential, requiring caution before entering long positions.
RSI Oversold? The RSI is showing a potential reversal area, but confirmation is key before making any trades.
📉 Waiting for confirmation before entering!
Let me know your thoughts in the comments!
Best regards

GBPUSD - SO MANY BULLISH SIGNS ! confirmed TPs HIT GBPUSD- Market is moving in a Bullish Channel since long. Market has formed Bullish continuation pattern and that's how we can predict a projection of TPs which is also well within a channel. Market has also retraced and bounced back from the FIB LEVEL of 0.382 which is also a good support level followed by the 3 white soldiers pattern.
ENTRY POINT & STOPLOSS with TPs :
we plan entry on the break out of resistance level (market has instant entry point) which is break of HH and keeping our SL below the HL / FIB 0.382 level or the resistance level.

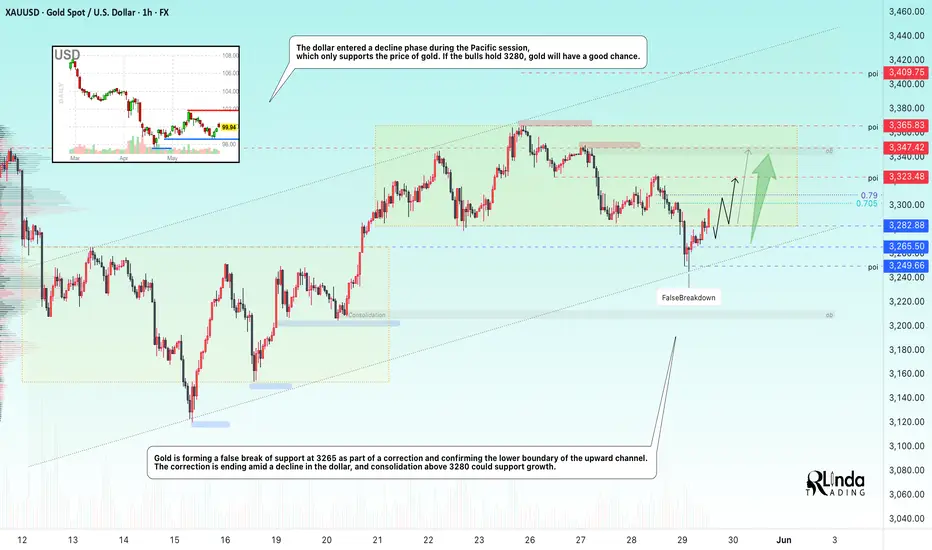
GOLD → False breakdown and support from the falling DXYFX:XAUUSD , as part of a correction, confirms the upward trend line and returns to the consolidation (range), making a false breakdown of support amid the dollar's correction...
The US dollar remains stable thanks to the Fed's hawkish minutes and the court's decision to block Trump's tariffs. Investors are waiting for Friday's inflation data (PCE), which could weaken the dollar and give gold a chance to rebound. Additional influence will come from US GDP data, jobless claims, and geopolitical news.
On D1, gold is rebounding from strong support and heading towards resistance at the rising trend line. If economic risks remain high, gold could continue its rally despite conflicting bearish patterns...
Resistance levels: 3300, 3310, 3325
Support levels: 3290, 3285, 3265
Gold is forming a false breakdown of support at 3265 as part of a correction and confirming the lower boundary of the upward channel. Consolidation above 3280 will confirm that bulls are holding the market amid high economic risks. Gold may test 3300-3310 and form a correction before continuing its growth towards 3325.
Best regards, R. Linda!
DOGEUSDT → Long squeeze before growth?BINANCE:DOGEUSDT.P is consolidating. A range with clear boundaries has formed. Before a possible breakout, a liquidation (false breakdown) may form
On D1, the structure is quite positive. Earlier, the price tested the downward resistance, but there was no reaction (fall) as such. Instead, the price is consolidating within the range of 0.211 (0.205) - 0.23 - 0.253.
Bitcoin, like the entire crypto market, is consolidating within fairly clear boundaries. Based on the current situation, it would be logical to wait for one part of the market to be liquidated before the price can move in either direction. Based on the bullish market, there may be a retest of support in the form of a false break...
Resistance levels: 0.2308, 0.253
Support levels: 0.213, 0.2116, 0.205
DOGE is consolidating with a focus on the 0.23–0.211 range. Against the backdrop of a bullish trend, a liquidation (long squeeze) relative to the lower boundary of the 0.23–0.205 range is possible before growth continues. A false break of support and liquidity capture would be useful maneuvers before implementation. However, if the market is aggressive enough and resistance at 0.23 is broken with subsequent consolidation above this level, it could trigger premature growth.
Best regards, R. Linda!

LTC/USDT 4H ChartHello everyone, let's look at the 4H LTC to USDT chart, in this situation we can see how the price is moving in a specific yellow triangle, in which we can see an attempt to exit from the bottom. On the other hand, the blue lines mark the main channel of the downtrend and here we can see how the price is fighting with its upper limit, but it is a strong resistance.
Let's start by defining the goals for the near future that the price has to face:
T1 = 101 USD
T2 = 111 USD
Т3 = 124 USD
Т4 = 147 USD
Now let's move on to the stop-loss in case the market continues to fall:
SL1 = 90 USD
SL2 = 80 USD
SL3 = 63 USD
The RSI indicator shows a rebound, but the movement remains around the middle of the range, which further leaves room for a potential deepening of the rebound.

BTC Trap & Reverse: The Power of SFPs in ActionBTC continues to chop in a tight range near its previous all-time high. While price action may appear messy at first glance, traders using a combination of structure, Fibonacci levels, and order flow tools are spotting clean opportunities — especially through Swing Failure Patterns (SFPs).
🔍 What Just Happened?
Bitcoin recently rejected from the 0.786 Fibonacci retracement level — a classic reaction zone. What made this move powerful was the SFP that formed at that level. Price swept above a prior high, triggering breakout buys, only to reverse. This type of move traps late longs and offers an ideal short entry.
🧠 Educational Insight: Why SFPs Are One of the Best Setups
SFPs (Swing Failure Patterns) are some of the highest-probability trades you can take for a few key reasons:
1️⃣ Liquidity-driven: They form where stop losses cluster — above highs or below lows — creating a magnet for price.
2️⃣ Clean invalidation: The wick high/low gives a natural stop-loss level, keeping risk tight.
3️⃣ Fast reaction: Once trapped traders are forced to exit, price often reverses sharply — giving you strong follow-through.
4️⃣ Confirmable with order flow: Using tools like Exocharts, you can see aggressive longs/shorts piling in just before the reversal. This adds conviction to the setup.
📏 Current Confluence:
Rejection from the 0.786 Fib retracement
SFP confirmed on high volume
1:1 trend-based Fib extension sits at ~$105,410
That level also lines up with the 0.666 Fib retracement
Anchored VWAP around $105K
Liquidity pool right at that zone too — a likely magnet
🎯 Trade Idea:
Short triggered at the SFP wick, stop just above it. First target: the 1:1 extension near $105.4K. Risk-reward is excellent with high probability if price continues to unwind late longs.
✅ Key Takeaway:
In ranges like this, you don’t need to guess direction — you need to react to structure. SFPs give you that edge. When paired with real-time tools like Exocharts and anchored VWAPs, these trades become sniper entries rather than coin flips.
Let the market show its hand — and trade the reaction, not the prediction.
📌 Summary:
This is how you avoid overtrading in chop: wait for key levels, watch how price reacts, and let trapped traders create the move. If BTC revisits the $105K region, it’s a major area to watch for reaction — or to take partials if you’re in a short.
The best trades come from patience + precision.
_________________________________
If you found this helpful, leave a like and comment below! Got requests for the next technical analysis? Let me know.

GOLD → Consolidation ahead of news. Retest of resistanceFX:XAUUSD remained above the key support level of 3280 and is testing intermediate resistance. Against the backdrop of the dollar's decline, the metal has a chance to continue its growth...
Gold is trading in consolidation ahead of the Fed meeting minutes. Easing trade risks and the dollar's recovery triggered a correction from the recent peak of $3366. Against the backdrop of the dollar's correction, the metal is entering a phase of local rally and testing resistance at 0.5f
The Fed is maintaining a cautious tone, and the market is waiting for signals on interest rates. The escalation of the conflict in Ukraine and the threat of new sanctions from Trump did not cause significant concern in the markets. Investors are waiting for drivers
Resistance levels: 3322, 3348, 3363
Support levels: 3290, 3282, 3265
A small correction may form from 3322 before growth continues. The market is interested in liquidity in the 3348-3363 zone, and the price is likely to test this zone. However, further developments depend on the fundamental background. Rising economic risks or hints of interest rate cuts could support the price of gold.
Best regards, R. Linda!

EURJPY → False breakout of resistance. Reversal?FX:EURJPY is testing the resistance of the trading range as part of a distribution movement, but the situation ends with a false breakout and price consolidation within the flat.
Against the backdrop of the falling dollar, the Japanese yen is strengthening and thus exerting a corresponding influence on the currency pair. EURJPY is forming a false breakout of resistance within a distribution movement formed after a retest the support of the flat. The price returns to the channel. After a false breakout of resistance and a return of the price below a strong key level, a base is forming in the form of support at 163.2 (trigger).
Resistance levels: 163.4, 163.6
Support levels: 163.2, 162.7
A breakdown of the 163.2 trigger and price consolidation below the key level could intensify the sell-off, triggering a further decline.
Best regards, R. Linda!

BTC/USD 4h Chart ReviewHello everyone, I invite you to review the current situation on BTC. When we enter the four-hour interval, we can see how the BTC price is moving in the upward trend channel, in which several upward waves can be marked, which may indicate the beginning of another wave of growth.
Here you can see how the current rebound has brought the movement closer to a strong resistance zone from $ 110,400 to $ 113,200, only breaking out of this zone on top can give the price an increase in the area of strong resistance at $ 121,000.
Looking the other way, you can see that when the trend reverses, we first have a support zone from $ 106,600 to $ 105,400, however, if this zone is broken, we can see a quick return of the price to the area of strong support at $ 102,000.
The RSI indicator shows how a support line was formed from which the indicator bounced many times, giving the price an increase, while the MACD indicator maintained the upward trend and created room for another upward movement when the price recovered.

GOLD → Correction before possible growthFX:XAUUSD entered a liquidation phase (rally) within the trading range at the opening of the session. The dollar's rise is to blame. The focus is on supporting consolidation...
Investors remain interested in gold as a safe haven asset amid geopolitical risks and declining demand for US assets.
The key drivers remain news about tax reform in the US, trade negotiations, and upcoming macro data.
Gold is consolidating, but since the opening of the session, the price has been heading towards support. Against the backdrop of an upward trend, a trigger for bearish liquidity is likely to form before growth.
Against the backdrop of the dollar's growth, gold is entering a correction phase. At the moment, all attention is on support and the liquidity zone of 3265. A false breakdown will trigger a price buyback.
Resistance levels: 3322
Support levels: 3282, 3265
Since the price is still within the range and a countertrend correction is forming in the market, in our case, it is worth considering an intraband trading strategy. A false breakdown of support could trigger growth to intermediate resistance or to the upper border of the channel.
Best regards, R. Linda!

BITCOIN → False breakout of 110K. Negative background???BINANCE:BTCUSDT.P hit a new all-time high of almost 112K on the back of improved economic and fundamental data, but the party didn't last long before Trump's next speech...
Yesterday, Trump spoke and announced new tariffs on the EU. The markets reacted quite aggressively to this news. Despite the fact that the market has practically bought back all the losses, the question itself remains open. The introduction of 50% tariffs on Europe will increase the risk background, which could trigger a fall in both the stock market and cryptocurrencies. In this case, money will flow into gold (a safe asset)...
Technically, Bitcoin is forming a false breakout of the global resistance level of 110K (previous ATH). The price is reacting and forming a bearish momentum (coinciding with the change in the fundamental background).
The area between 109.8 and 110.3 is a resistance and liquidity zone relative to the previous ATH. If the bears hold the resistance, Bitcoin may get stuck inside the 110K - 106.8K (105K) range.
Resistance levels: 109.8K, 110.3K, 112K
Support levels: 106.8K, 105K
Accordingly, if the 110K resistance holds amid the correction, consolidation below the resistance will confirm the formation of a false breakout, and in this case, Bitcoin may move to the 110K (112K) - 105K (102K) range. However, situations change daily, and if Bitcoin does break through 110K and manages to consolidate above its previous ATH, this will be a signal for growth...
Best regards, R. Linda!

HH HL intact.FLYNG Closed at 50.80 (25-05-2025)
HH HL intact.
No Bearish Divergence yet on bigger tf.
54- 56 is the resistance for now.
If this level is crossed with Good Volumes,
we may witness further New Highs around 60+
On the flip side, 49 - 49.50 & then 47 - 47.50
may act as Good Support Levels.
However, breaking 45 will bring more Selling Pressure
towards 42 - 44

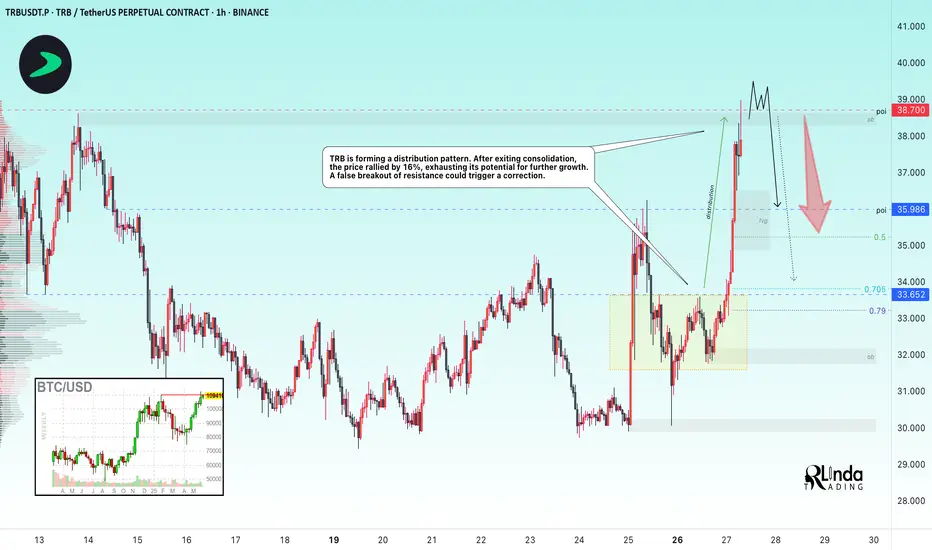
TRBUSDT → High probability of a false breakoutBINANCE:TRBUSDT.P is testing resistance in the 38,700 range as part of a rally. The current strong movement may end in a false breakout...
TRB is forming a distribution pattern. After exiting consolidation, the price rallied 16%, exhausting its potential for further growth.
A false breakout of resistance could trigger a correction.
Bitcoin looks controversial in the overall situation. After a false breakout of the 110K resistance, the price is consolidating below the level. If the flagship correction begins, it may also trigger a correction in altcoins...
Resistance levels: 38,700
Support levels: 35.98, 33.65
If the price fails to consolidate above the level and continue to rise, this will confirm the absence of bullish potential. A false breakout and price consolidation below 38.700 will trigger a correction to 36 - 33
Best regards, R. Linda!