Play on levelsILP Analysis
Closed at 60.04 (20-05-2025)
Immediate Resistance is around 60.
However, Weekly Closing above 58-59
would be a positive sign.
Upside, it has the potential to touch 64 - 65
& then 67 - 68.
Fibonacci Retracement

GOLD → Short squeeze before a drop to 3150?FX:XAUUSD is consolidating. The market needs a driver, but due to the unstable fundamental background, traders have switched to a wait-and-see mode. Consolidation could turn into strong movement at any moment. But in which direction?
Gold under pressure: the market is waiting for signals from the Fed and negotiations. The dollar is putting pressure on the market amid expectations of trade negotiations with India, South Korea, and Japan, as well as statements from the Fed.Earlier, the metal was supported by the weak dollar after Moody's downgraded the US credit rating, but growing interest in risky assets and hopes for peace between Russia and Ukraine reduced demand for gold. Key factors — negotiations and comments from the Fed — will continue to influence the dynamics of the dollar and gold.
Technically, the price is in a downtrend and within consolidation. A breakout from consolidation could be accompanied by strong momentum, but I believe that there will be no countertrend movement and that a retest of resistance could end in a decline...
Resistance levels: 3265.5, channel resistance
Support levels: 3206, 3153
The most likely scenario within the bearish trend is a short squeeze and a downward breakdown from the triangle (the fundamental background and economic risks are slowly but surely declining, and gold may lose value). A false breakout of 3250-3265 could trigger a continuation of the trend towards 3150-3120.
Best regards, R. Linda!

PENDLEUSDT → Resistance retest. One step away from distributionBINANCE:PENDLEUSDT is preparing for distribution after a prolonged consolidation. The price is testing a key resistance level, which, if broken, will trigger a rally...
The coin is breaking through the flat resistance and consolidating above the upper border of the range. The key level is 4.400. If the bulls hold their ground above this level, the growth may continue.
Bitcoin is showing bullish dynamics, which supports the altcoin market. The bullish trend may continue in altcoins as well. Pendle may move from consolidation to distribution.
Resistance levels: 4.32, 4.400
Support levels: 4.024, 3.622
If the coin manages to consolidate above the key resistance level, thereby confirming the breakout, the price may move to aggressive growth. In this case, the target could be 4.800.
Best regards, R. Linda!

AVAX/USDT Potential UpsidesHey Traders, in today's trading session we are monitoring AVAX/USDT for a buying opportunity around 21.00 zone, AVAX/USDT is trading in an uptrend and currently is in a correction phase in which it is approaching the trend at 21.00 support and resistance area.
Trade safe, Joe.

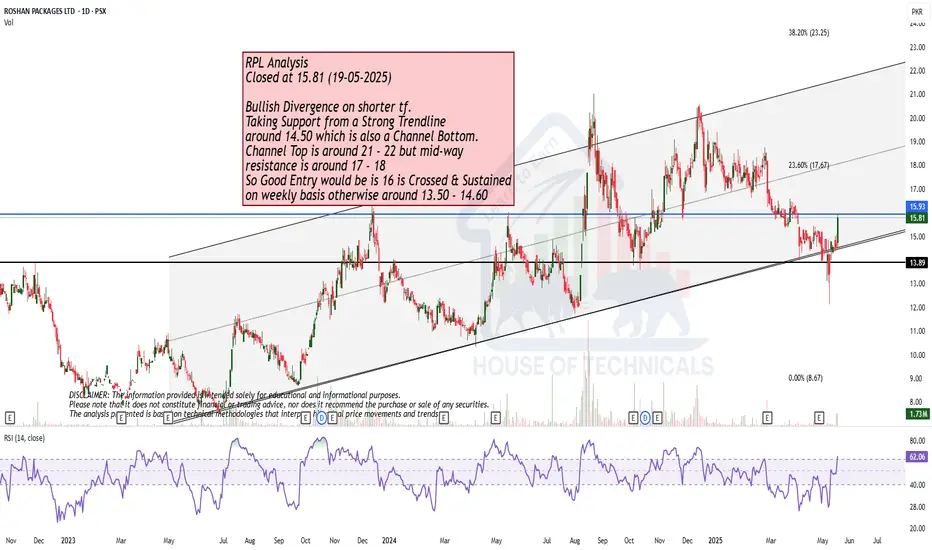
Taking Support from a Strong Trendline
Bullish Divergence on shorter tf.
Taking Support from a Strong Trendline
around 14.50 which is also a Channel Botom.
Channel Top is around 21 - 22 but mid-way
resistance is around 17 - 18
So Good Entry would be is 16 is Crossed & Sustained
on weekly basis otherwise around 13.50 - 14.60
Bullish on bigger tf but Strong Resistance ahead.
Bullish on bigger tf.
Strong Resistance around 128 - 129
If this Resistance is Crossed & Sustained
on monthly basis, we may witness upside
towards 200+

GOLD → Retest of trend resistance before declineFX:XAUUSD is recovering amid uncertainty, but there is a fairly strong resistance zone ahead that could hold back growth and trigger a decline...
Since the opening of the session, the price has recovered slightly after a week-long decline. Growth is being held back by two-sided risks: on the one hand, pressure on the dollar and Moody's downgrade of the US credit rating are supporting the metal, while on the other hand, high bond yields and possible US trade agreements are limiting growth.
Investors are awaiting new statements from the Fed and are monitoring US negotiations with key partners. Amid concerns about fiscal stability and weak economic data, gold may remain in positive territory, but positive trade news could turn it down again.
Resistance levels: 3257, 3265
Support levels: 3206, 3153
A false breakout of the specified resistance will confirm the inability to continue growth. Consolidation after a false breakout of 3257 - 3265 below 3257 could trigger a reversal and a fall to areas of interest...
Best regards, R. Linda!

USDJPY → Support retest. Is the trend continuing?FX:USDJPY is storming key support within the local downtrend. Pressure is intensifying the dollar's decline...
The dollar index is beginning to fall, which is also reflected in the currency pair.
Selling pressure is intensifying. A local downtrend is forming, with an attempt to break through key support at 144.82, below which the path to 143.4 - 142 opens up. Consolidation of the price below 144.82 could intensify the sell-off.
Resistance levels: 145.34, 146.07
Support levels: 144.82, 143.44, 142.35
Global and local trends are downward, and the fall of the dollar can only provide additional resistance, which will intensify the sell-off. A break of key support and consolidation of prices below 144.82 will trigger further sell-offs.
Best regards, R. Linda!

BITCOIN → Consolidation in a triangle amid a BULLISH TRENDBINANCE:BTCUSDT is consolidating. A symmetrical triangle is forming against the backdrop of a bullish trend. Given the current technical nuances, we can bet that this consolidation is forming with the aim of continuing growth...
Fundamental nuances have gradually improved over the past few weeks, and the cryptocurrency market has revived slightly. Technically, I like the market structure on D1. After strong growth, the price is not going to fall, consolidation is forming. The market is bullish, after 2-3 weeks of consolidation, a bullish distribution is forming. The cycle has repeated itself twice. On D1, you can see how long tails are forming downward within the consolidation, indicating that whales are buying up all attempts to fall, keeping the market away from risk zones. Accordingly, at the moment, I would say that consolidation may continue for some time, and I do not rule out an attempt to retest the triangle support before growth, or entry into a deeper zone to retest the distant liquidity zones of 101400 and 100700 before continuing growth.
Resistance levels: 103.6, 104.4, 105.0
Support levels: 102.5, 101.4, 100.6
A decline can be considered if the price breaks the triangle support and sticks to 101400, forming a pre-breakdown consolidation (if there is no upward rebound).
However, at the moment, intraday trading can be considered, i.e., from the consolidation boundaries. A signal to exit the consolidation upwards and continue growth will be consolidation between 103.5 and 105.0 and compression towards the upper boundary.
Best regards, R. Linda!

XAU/USD 4H Chart Analysis – Wave 5 Setup in PlayHey traders! Just wanted to share this clean Elliott Wave setup I’m tracking on Gold (XAU/USD).
We’ve just completed what looks like a textbook Wave (4) correction, finding support right at the lower boundary of this long-term ascending channel. Price also respected the 38.2% Fibonacci retracement perfectly, lining up around the $3,090 level. That level is acting as a key demand zone right now.
🌀 According to the wave count:
Wave (3) topped out near $3,500
Wave (4) retraced sharply into the channel base
We are now potentially at the launch point for Wave (5) — the final impulse leg
💹 Wave (5) Projection:
Targeting the upper channel boundary, which aligns closely with $3,740–$3,750
This area also completes the measured move and matches key structural confluence
📈 Technical Confluence Supporting the Bullish Bias:
RSI bounced cleanly from oversold territory
Bullish EMA crossover (20/50) is happening right near the bounce zone
We’re also seeing a break of the corrective trend line, suggesting momentum is shifting back in favor of the bulls
📍 Key Levels to Watch:
$3,149: minor pullback area / possible retest
$3,283: Fib 23.6% resistance — needs to be cleared for confirmation
$3,500: Major resistance & previous high — breakout zone
$3,747: Wave 5 target
⚠️ Invalidation Zone:
If price breaks below $3,090, and especially $3,041, I’ll be reassessing the wave count. That would suggest a deeper Wave 4 or a breakdown in bullish structure.
📌 Conclusion:
I’m watching this setup closely. Gold looks poised for a strong upside leg if current levels hold. The structure is clean, momentum is turning, and we’ve got multiple confirmations in place. I’ll be scaling in with proper risk management and looking to ride this potential Wave 5 to new highs.
Drop your thoughts below — are you long on Gold? Let’s talk setups 👇
@WrightWayInvestments
@WrightWayInvestments
@WrightWayInvestments

DOGE → Retest of the panic zone. One step away from a downtrendBINANCE:DOGEUSDT.P is facing selling pressure. After distribution (pump), the price enters a correction phase (dump) and storms the panic zone, a breakout of which could intensify an uncontrolled decline.
DOGEUSDT squandered all the potential accumulated in late April and early May. The distribution ended in the 0.2600 zone, after which the coin entered a correction phase. At the moment, the coin is testing the panic zone of 0.21400
All attention is on the base of the triangle at 0.21400. This is the panic zone. When the support breaks, buyers will be liquidated, and sellers may increase sales, which could trigger a bearish momentum.
Resistance levels: 0.222, 0.2307
Support levels: 0.2145, 0.2135
The main idea is a continuation of the decline. The trigger is a breakdown of support at 0.2135 and consolidation of the price below this zone, only in this case will the price continue to fall.
!!! The structure will be broken if the price reverses and consolidates above 0.222 and confirms the bullish sentiment with price consolidation above 0.23, in which case we will again consider growth.
Best regards, R. Linda!

PEPE/USDT is Nearing an Important ResistanceHey Traders, in today's trading session we are monitoring PEPE/USDT for a selling opportunity around 0.00001330 zone, PEPE/USDT is trading in a downtrend and currently is in a correction phase in which it is approaching the trend at 0.00001330 support and resistance area.
Trade safe, Joe.

BTC/USD 4H Chart targets and stoplossHello everyone, let's look at the 4H BTC to USD chart, in this situation we can see how the price has come out of the downtrend channel on top, and the upward movement after leaving the channel is close to the height of the downtrend channel.
Let's start by defining the targets for the near future that the price has to face:
However, at the beginning we can see how the price is struggling with a strong resistance zone from $103882 to $108349. Next, we have potential targets:
T1 = 112,740 USD
T2 = 116,525 USD
Т3 = 120,000 USD
Now let's move on to stop-loss in case the market continues to fall:
SL1 = 100,551 USD
SL2 = 97,446 USD
SL3 = 92,525 USD
SL4 = 88,286 USD
The RSI indicator shows that in the 4H interval, the movement is at the upper limit of the range, which clearly affects the sideways movement on the chart.

BTC Preparing for A Move Towards $110k Are You Ready?Bitcoin Market Update: BTC Preparing for a Move Towards 109,200 and 110,000 Levels
Bitcoin (BTC) appears to be gearing up for a potential upward move targeting the 109,200 to 110,000 price range. Over the past several days, Bitcoin has been consolidating within a tight range, indicating accumulation and market indecision. However, the latest price action has shown a strong bullish breakout, confirmed by a solid bullish candle, followed by a healthy retest of the breakout zone.
This retest suggests that Bitcoin may now be preparing for its next leg upward. The current price area presents a possible buying opportunity, especially as we approach the key black-marked zones on the chart. These levels are significant because they hold pending liquidity from previous days’ highs and also correspond to notable swing highs—areas where the market previously reversed.
Traders should remain alert and not miss this potential opportunity. It's crucial to monitor the market closely for any structural shifts or additional confirmation signals, such as bullish patterns, increased volume, or momentum indicators aligning with the upward trend.
As always, conduct your own research (DYOR) before making any trading decisions. Market conditions can change rapidly, and informed decisions backed by solid analysis are essential for successful trading.

GOLD → The fight for 3,200 continuesFX:XAUUSD has recovered after a bearish distribution. The price has returned to the range but continues to test the fundamental threshold of 3200.
The fundamental background has been gradually improving recently, which is putting pressure on the gold market, increasing the profit-taking ratio and the level of sales. After the resolution of the tariff war, all attention has shifted to the negotiations between Russia and Ukraine, and de-escalation could also reduce economic risks. As well as the escalation of the conflict in the Middle East...
Technically, the price is returning to the range after a deep false breakout but is facing strong resistance and pressure from sellers. Further developments depend on the 3200 level, which is of fundamental importance.
Resistance levels: 3225, 3236, 3257
Support levels: 3204 - 3200, 3194
The battle for the 3200 area continues, with bulls likely to try to keep the price above 3200, in which case the market may test the 0.5-0.7 Fibonacci zone. However, given the recent improvement in fundamentals, the price may return from these zones of interest to 3200 with the aim of continuing the assault to break through and continue the downtrend.
Best regards, R. Linda!

GBPJPY → Return to range. Possible price decline.FX:GBPJPY is forming a local bearish trend amid a correction in the dollar. The price is returning to the range and entering strong resistance.
Amid a correction in the dollar, the Japanese yen is strengthening, putting pressure on the currency pair.
GBPJPY is returning below a strong level (within the range) and consolidating in the selling zone, which could trigger a continuation of the decline towards areas of interest. Technically, the global trend is neutral and the currency pair is forming a rebound from strong downward resistance. If the bears keep the price below 193.45 - 193.74, the local downward trend may continue.
Resistance levels: 193.45, 193.74, 194.22
Support levels: 193.04, 192.35, 191.65
Price consolidation below 193.74 - 193.45 will confirm that bears are holding the range resistance. The sell-off may continue, and in this case, the price will head towards the indicated zones of interest and liquidity.
Best regards, R. Linda!

$SOL and Most Major Alts Get Hard Rejection from 200DMAMost of your favorite Alts such as CRYPTOCAP:SOL had hard rejections from the 200DMA.
If this trend breaks into the red box we should see a retest around the .236 Fib and 50DMA ~$140
RSI also looks McDonald's toppy
Not a good time to FOMO.
PS. Normally i dont post TA this late in the night from the US but I'm gonna consider doing more if i get some decent engagement.
Lmk if you think i should post more at these midnight hours 🎃

DOGE/USDT: Key Buy Opportunity at 0.22800 Support Zone!Hey Traders, in today's trading session we are monitoring DOGE/USDT for a buying opportunity around 0.22800 zone, DOGE/USDT is trading in an uptrend and currently is in a correction phase in which it is approaching the trend at 0.22800 support and resistance area.
Trade safe, Joe.

LTC-USDT 1W chart ReviewHello everyone, let's look at the 1W LTC chart to USDT, in this situation we can see how the price approached the upper limit of the inheritance trend channel, only when it manages to get out of it, the price will be able to go further towards the inheritance trend line.
Going further, let's check the places of potential target for the price:
T1 = $ 105
T2 = $ 115
Т3 = 129 $
T4 = $ 147
Let's go to Stop-Loss now in case of further declines on the market:
SL1 = $ 97
SL2 = 80 $
SL3 = $ 63
Looking at the RSI indicator, we see
As he approached the center of the range, but we still have enough space for the price to definitely move up.

Bitcoin Potential UpsidesHey Traders, in today's trading session we are monitoring BTCUSDT for a buying opportunity around 100,000 zone, Bitcoin is trading in an uptrend and currently is in a correction phase in which it is approaching the trend at 100,000 support and resistance area.
Trade safe, Joe.

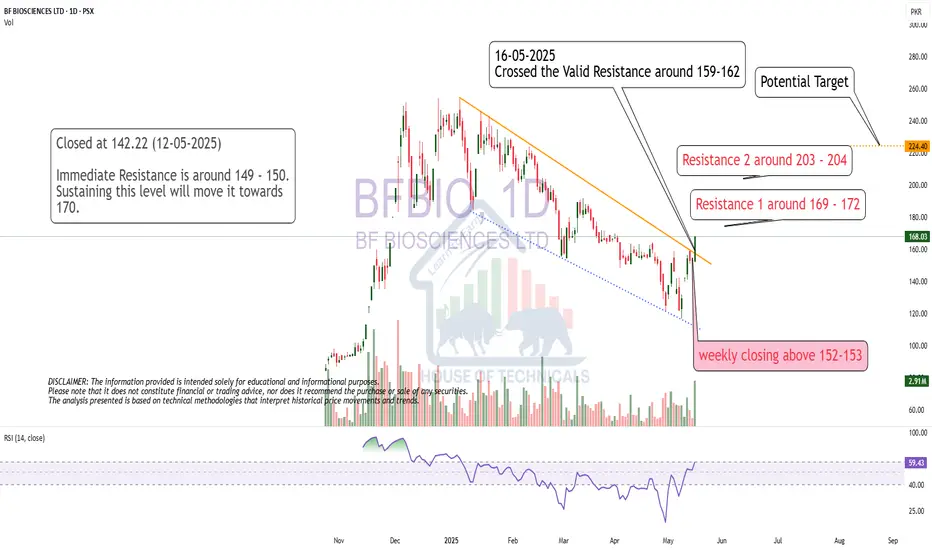
Breakout
Crossed the Valid Resistance around 159-162
Potential target is 220+
However mid resistances are there also.
Though Bullish but..
Though Bullish but Bearish Divergence has appeared
on bigger TF.
ABCD Pattern intac but only if 155 is Crossed & Sustained
with Good Volumes.
Upside Targets can be 200+
Good Support levels are 136 - 138 and then around 123 - 125

SOL-USD 12h Chart ReviewHello everyone, let's look at the 12h SOL to USD chart, in this situation we can see how the price came out sideways from the downtrend line, then formed a downtrend channel, the exit from which gave a strong rebound creating a new uptrend.
Let's start by defining the targets for the near future that the price must face:
T1 = 172 USD
T2 = 195 USD
Т3 = 218 USD
Т4 = 252 USD
Now let's move on to the stop-loss in case the market continues to fall:
SL1 = 151 USD
SL2 = 130 USD
SL3 = 115 USD
SL4 = 96 USD
It is worth paying attention to the Stoch RSI indicator, where you can see how the current correction has strongly reacted on the indicator, which may give room for another stronger uptrend.
