at an Important Support
25.40 - 26 is an Important Support level.
25 should be the SL.
Upside targets can be around 27 - 28 initially.
Fibonacci Retracement

Litecoin Breakout And Potential RetraceHey Traders, in today's trading session we are monitoring LTCUSDT for a selling opportunity around 85 zone, Litecoin was trading in an uptrend and successfully managed to break it out. Currently is in a correction phase in which it is approaching the retrace area at 85 support and resistance area.
Trade safe, Joe.

GOLD → An amazing recovery. Up to 3400?FX:XAUUSD continues to strengthen, testing resistance in the range, with buyers not giving up. The price breaks through the flat line and enters the buying zone; everything depends on the bulls...
Gold is rising for the second day in a row amid a weak dollar, increased demand for safe assets, and escalating conflicts in the Middle East and Eastern Europe.
Market nerves are being stoked by trade risks and instability in Asia, while investors await the Fed's decisions and Powell's speech.
GOLD is breaking out of its neutral range. Focus on 3369 and local resistance at 3381. The fundamental backdrop is favorable for gold. If buyers hold their ground above the indicated levels, the price may continue to rise.
Resistance levels: 3369, 3381, 3408
Support levels: 3352 (0.5f), 3330
I do not rule out the possibility of a retest of the local liquidity zone (long squeeze) at 3352 (0.5f) before continuing to rise. But at the moment, the focus is on 3369-3370, which are key levels (currently acting as support).
Best regards, R. Linda!

VIRTUALUSDT → Rebound from resistance. Trend break, U-turn?BINANCE:VIRTUALUSDT.P is pausing within an uptrend and forming a range within which signals of a possible reversal and decline are appearing.
Bitcoin is pausing its rally and moving into correction. This is a negative development for altcoins, which will not grow without the flagship.
VIRTUAL is consolidating, but pressure is building in the market (as can be seen from the cascade of resistance levels within the range). Another prerequisite for a breakdown of the market structure is a downward exit from the upward channel (a break of the trend support). Another retest of support at 1.581 could trigger a breakout and a fall. There is a fairly free zone below, and the nearest target is located in the 1.178 zone.
Resistance levels: 1.72, 1.829
Support levels: 1.581, 1.416, 1.178
Focus on the current range of 1.581 - 1.829. The chart shows that the price continues to storm and test support, which is an important signal against the backdrop of a broken uptrend. A break of support at 1.581 and consolidation below this level could trigger liquidation and a fall to the fvg zone or the liquidity zone at 1.178.
Best regards, R. Linda!

USDCAD → Storming the support level to break throughFX:USDCAD continues to storm support within the trading range amid a global downtrend
The currency pair is within the range, but the battle for support continues. The reaction to false breakouts is weakening and the price continues to attack the 1.378 level, which only increases the chances of a further decline
The dollar is rebounding from resistance and beginning to fall, which is having a corresponding effect on USDCAD. If the currency pair breaks 1.378 and consolidates below the level, this could trigger a continuation of the trend after consolidation...
Resistance levels: 1.381, 1.383
Support levels: 1.378, 1.374
Focus on the lower boundary of the trading range at 1.378. The role of the range is consolidation against the backdrop of a downtrend. Thus, a breakout of support will activate the distribution phase
Best regards, R. Linda!

XAUUSD (GOLD) | 4H | SWING TRADING Good morning, my friends,
Gold is currently at the 3355.0 level.
Even if gold makes a correction at this point, my target remains 3461.0.
This is a swing trading model, so there may be delays in reaching my target. However, I am confident that I will reach it eventually.
Once we hit that level, I will share an update for you all.
Dear friends, your likes are always my biggest motivation to keep sharing analyses. That’s why I kindly ask each of my followers to show their support—please don’t hold back on the likes.
I sincerely thank everyone who supports me with their likes. It truly means a lot

EURAUD | 4H | SWING TRADINGHey there;
Traders, your likes are always my biggest source of motivation for me to share analysis. For this reason, I would like to ask each and every one of my followers; please do not miss your likes.
I sincerely thank everyone who supports me with their likes.
SIGNAL ALERT
BUY LIMIT ORDER ( EURAUD ) 1,74560
🟢TP1:1,75388
🟢TP2:1,77709
🟢TP3:1,81747
🔴SL:1,71135
RR / 2,00

The Nasdaq 100’s rally may be coming to an endThe Nasdaq 100 has staged an impressive rally over the past two weeks, climbing more than 12% since Monday 21 April to close at roughly 19,970 on Monday 5 May. However, if there were a point at which the advance might pause, it could be near current levels. The index has risen to a key area of technical resistance in the 19,900 to 20,200 range, which could prove challenging to break through, especially given the uncertain outlook.
One driver behind the Nasdaq 100’s rise has been the fall in implied volatility, as indicated by the VXN. While the better-known Vix measures expected volatility in the S&P 500 over the next month of trading, the VXN measures volatility on the Nasdaq 100. It has recently dropped to a reading of 25.7, down from more than 50 in April, as shown on the chart below. This decline in implied volatility probably triggered significant unwinding of put positions in the options market, allowing market-maker hedging flows to provide a tailwind for stocks. But with the VXN now back at levels last seen on 2 April, this tailwind may no longer be available to support the market.
Additionally, the Nasdaq 100 has returned to the 61.8% retracement level, a significant Fibonacci level that frequently acts as strong resistance and could help determine whether the recent rebound is genuine or merely a short-term blip. Just above this 61.8% retracement lies the 200-day moving average, another level that typically provides strong resistance. Furthermore, the 19,950 region has consistently acted as both support and resistance, dating back to June 2024. With these three resistance areas converging, it may be challenging for the tech-heavy index to sustain its upward momentum. Should stocks begin to reverse lower, initial support may be around 19,300, followed by a gap at 18,240.
That said, if the Nasdaq 100 somehow manages to overcome all these hurdles, it could rise to 21,100 – though such a move appears unlikely at this stage.
Written by Michael J. Kramer, founder of Mott Capital Management
Disclaimer: CMC Markets is an execution-only service provider. The material (whether or not it states any opinions) is for general information purposes only and does not take into account your personal circumstances or objectives. Nothing in this material is (or should be considered to be) financial, investment or other advice on which reliance should be placed.
No opinion given in the material constitutes a recommendation by CMC Markets or the author that any particular investment, security, transaction, or investment strategy is suitable for any specific person. The material has not been prepared in accordance with legal requirements designed to promote the independence of investment research. Although we are not specifically prevented from dealing before providing this material, we do not seek to take advantage of the material prior to its dissemination.

Gold Breakout and Potential RetraceHey Traders, in today's trading session we are monitoring XAUUSD for a buying opportunity around 3300 zone, Gold was trading in a downtrend and successfully managed to break it out. Currently is in a correction phase in which it is approaching the retrace area at 3300 support and resistance area.
Trade safe, Joe.

Lower Locked at 58.40 today.
Lower Locked at 58.40 today.
58 is an Important Support but
if it is not respected we may witness
price around 48.
as mentioned earlier, it should stay above 36
otherwise extreme selling cab be seen.

CAD JPY Entry Setup 1 hour Timeframe CAD JPY Entry Setup 1 hour Timeframe
Entry Setup: Bullish break and retest
Additional confluence: 0.618 - 0.50 Fib Retracement Level.
Candlestick confirmation: No confirmation yet so we wait.

GOLD → Gold not ready to fall? What's going on?FX:XAUUSD is forming a local bottom and is not ready to continue falling. The price is breaking through the downward resistance amid a weakening dollar and a complicated fundamental backdrop.
At the beginning of the week, the price of gold stabilized above $3,250 as investors returned to defensive assets due to ongoing uncertainty surrounding US trade agreements with China and Japan, as well as growing geopolitical tensions in the Middle East and Ukraine.
The weakness of the dollar ahead of the Fed meeting and declining expectations of a rate cut are also supporting demand for gold. The focus remains on US trade news and the possible hawkish tone of the Fed this week.
Technically, the price is testing the bottom of the range as resistance. If there is no reaction to the false breakout and the price continues to storm 3268, then a breakout and consolidation above the level will allow it to strengthen to 3292-3314.
Resistance levels: 3269, 3294, 3314
Support levels: 3243, 3222, 3204
The price is forming a second retest of 3269 since the session opened. Buyers are testing resistance for a breakout. If the bulls break 3269 and consolidate above 3270, the chances for growth will be good. I do not rule out the possibility of a retest of the liquidity zone at 3243 before growth.
Best regards, R. Linda!

LTC/USDT 12H chart reviewHello everyone, let's look at the 12H LTC chart to USDT, in this situation we can see how the price came out of the downward trend and currently you can see the movement of the newly created upward trend line. Going further, let's check the places of potential target for the price:
T1 = $ 89
T2 = $ 97
Т3 = $ 109
Let's go to Stop-Loss now in case of further declines on the market:
SL1 = 85 $
SL2 = $ 77
SL3 = $ 67
SL4 = $ 63
Looking at the RSI indicator, we see
Return to the lower limit, which can potentially give energy to make the price re -perform upward movement.

USDJPY Potential UpsidesHey Traders, in today's trading session we are monitoring USDJPY for a buying opportunity around 143.500 zone, USDJPY is trading in an uptrend and currently is in a correction phase in which it is approaching the trend at 143.500 support and resistance area.
Trade safe, Joe.

BITCOIN → Correction to the risk zone. Rise or fall?BINANCE:BTCUSDT has updated its local maximum to 97,900, the market structure is quite positive, but still depends on the fundamental background and the behavior of the S&P 500.
The fundamental reasons that influenced the growth are the improvement in the tariff situation in the US and relations with China. Bitcoin's growth strengthened as the SP500 index rose, with which it has a fairly high correlation. In the second half of this week, the price broke out of the two-week consolidation, breaking through the resistance level of 95,500 and updating the local maximum. A correction is forming within the local upward channel.
95,000 is the liquidity and risk zone. That is, if the bulls hold their defense above 95K during the retest, Bitcoin will continue to grow in the short and medium term. Otherwise, a break of 95K could trigger a drop to 92K-88K.
Resistance levels: 97,425, 99,475
Support levels: 95,500, 92,000
All eyes are on the 95.5K support level, below which a huge liquidity pool has formed. Growth may be influenced by a retest (false breakout of support) and an imbalance of forces in the market. But we need to be careful, as the market will react to economic data. BUT! A return of prices to the selling zone (below 95000 - 95500) and the inability to continue growth could trigger a correction and liquidation.
Best regards, R. Linda!

BTCUSD/BITCOIN | M30 | SELL LIMIT ORDERHey There,
I'm currently waiting for the level I've targeted to enter a sell position on Bitcoin.
I've shared the exact entry level with you below.
Just a heads-up:
This trade carries high risk due to potential market manipulation.
Please trade cautiously and avoid taking on too much risk.
SIGNAL ALERT
SELL LIMIT ORDER (BTCUSD/BITCOIN) 97,000/97,500
🟢TP1:96,850
🟢TP2:96,654
🟢TP3:96,100
🔴SL: 98,390
Traders, your likes are always my biggest source of motivation for me to share analysis. For this reason, I would like to ask each and every one of my followers; please do not miss your likes.
I sincerely thank everyone who supports me with their likes.

Ethereum is Nearing The Daily TrendHey Traders, in today's trading session we are monitoring ETH/USDT for a selling opportunity around 2,000 zone, Ethereum is trading a downtrend and currently is in a correction phase in which it is approaching the trend at 2,000 support and resistance area.
Trade safe, Joe.

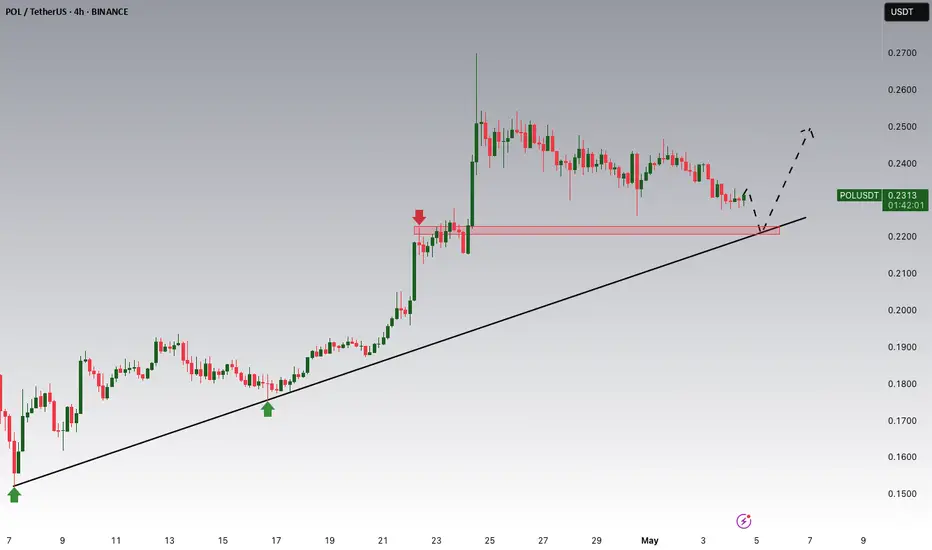
POLUSDT Potential UpsidesHey Traders, in today's trading session we are monitoring POLUSDT for a buying opportunity around 0.2220 zone, POLUSDT is trading in an uptrend and currently is in a correction phase in which it is approaching the trend at 0.2220 support and resistance area.
Trade safe, Joe.
Bitcoin Potential UpsidesHey Traders, in today's trading session we are monitoring Bitcoin for a buying opportunity around 95,000 zone, Bitcoin is trading in an uptrend and currently is in a correction phase in which it is approaching the trend at 95,000 support and resistance area.
Trade safe, Joe.

BNB/USDT 1D chart Hello everyone, let's look at the 1D BNB chart to USDT, in this situation we can see how the price moves in a triangle where there is still space to keep the currently ongoing side trend. Going further, let's check the places of potential target for the price:
T1 = $ 599
T2 = $ 617
Т3 = $ 644
Let's go to Stop-Loss now in case of further declines on the market:
SL1 = $ 580
SL2 = $ 559
SL3 = $ 542
SL4 = 521 $
Looking at the MacD indicator, you can see an attempt to return to the upward trend, but here we do not have clear confirmation, which is why it is worth being careful.

CAKEUSDT Potential DownsidesHey Traders, in today's trading session we are monitoring CAKEUSDT for a selling opportunity around 2.17 zone, CAKEUSDT is trading in a downtrend and currently is in a correction phase in which it is approaching the trend at 2.17 support and resistance area.
Trade safe, Joe.

MKR/USDT 4h chart ReviewHello everyone, let's look at the 4H MKR chart to USDT, in this situation we can see how the price moves on the created upward trend line. Going further, let's check the places of potential target for the price:
T1 = $ 1576
T2 = 1657 $
Т3 = 1714 $
Let's go to Stop-Loss now in case of further declines on the market:
SL1 = $ 1529
SL2 = $ 1499
SL3 = $ 1450
SL4 = 1372 $
Looking at the RSI indicator, we see
How slight relaxations give space for further increases by living in the upward trend of price.

Bullish on bigger time frames.
Bullish on bigger time frames.
Took support from a very important
level around 36-37.
HL printed.
40.30 - 40.85 is a Resistance level as
of now.
If it gets rejected from this level, we may
witness 37.50 - 38.50 again.
Upside targets can be around 45 - 46 & then
50s.
