GOLD → Bear pressure. Area of interest: 3340–3306FX:XAUUSD continues to decline under pressure from sell-offs. However, the situation is interesting overall, as there is conflicting data and unexpected price behavior is surprising the market...
On Tuesday, gold is trying to regain the $3,400 level after pulling back from highs, but it is still facing selling pressure and returning to $3,377. The market reaction to the $3,377 level is quite weak, and if the price starts to stick to support, this will lead to a further decline. The dollar is strengthening as a safe-haven currency, holding back gold's growth. The markets are focused on the outcome of the Fed and Bank of Japan meetings, as well as US retail sales data. Any dovish signals from the Fed could support gold and weaken the dollar.
Technically, on D1, gold is returning below the 3382 level (selling zone) and testing 3377. The reaction to the false breakout of support is weak, and the price is forming a pre-breakdown consolidation relative to 3377. There are clear areas of interest that could lure the price before the news. For example, 3343, 3306, 3245.
Resistance levels: 3382, 3403.
Support levels: 3377, 3339, 3320
The bearish structure will be broken if the price strengthens to 3403 and consolidates above that level. This will reinforce buyers' expectations, which could lead to growth. At the moment, I would expect two scenarios: price consolidation within 3377-3403. But technically, the chart shows that there is bearish pressure in the market. The price continues to storm the support level of 3377, which may not hold up against another retest. A break 3377 could lead to a fall to the areas of interest at 3339-3306.
Best regards, R. Linda!
Fibonacci Retracement

BTCUSD 1DI invite you to look at the current situation example, where you can see a lower high formation that has been formed, which could potentially lead to a larger price correction and the formation of a lower low in one of the 3 potentially designated locations.

GOLD → Hunting for liquidity before continued growthFX:XAUUSD has been correcting since the start of the session. The fundamental background is complicated due to the escalation of the conflict in the Middle East.
The price of gold briefly retreated from a two-month high above $3,450 amid a recovery in the dollar and investor caution. Escalating tensions between Israel and Iran are dampening risk appetite, while markets await decisions from the Fed and the Bank of Japan. Expectations of a dovish Fed continue to support interest in gold, but fresh impetus is needed for further gains.
Technically, the market is bullish. Gold is forming a correction to the key support and liquidity zone amid an uptrend. The price is within the range, and a retest of 3400 could trigger growth.
Support levels: 3408, 3400
Resistance levels: 3446, 3500
A retest of support and liquidity capture amid the current challenging situation (high interest in the metal) and a bullish trend could support the price, allowing gold to continue its growth.
Best regards, R. Linda!

BITCOIN → Buyback bar. Chance of growth to 108,000BINANCE:BTCUSDT is trading in a fairly wide range of 100,600 - 110,400. The market is stagnating due to fundamental uncertainty, but the risks of a decline are quite high...
After the escalation of the conflict in the Middle East, Bitcoin broke the bullish structure on the market and managed to test the local level of 102500, from where a fairly aggressive phase of buying out the fall began within one trading session. The market is defending the structure quite aggressively. The chart shows a local range forming with strong levels at 102500 and 106200. Accordingly, the price may remain in this range for a long time (in which case an intraday trading strategy can be considered). However, if Bitcoin starts to stick to one of the boundaries, then we can consider the price leaving the range, but based on the structure of the uptrend, correction, and the formation of a buyback bar, it would be logical to see an attempt to break through resistance with the aim of continuing growth.
Resistance levels: 106200, 108200, 110400
Support levels: 102500, 100600
On D1, there are no prerequisites for a strong decline. The market is buying up knives and trying to stay afloat (in consolidation). In the medium term, there may be an attempt to retest 102500 - 100600 due to the liquidity pool. But locally, the market may form an attempt to grow to 108200
Best regards, R. Linda!

NZDUSD → Correction and liquidity capture ahead of growthFX:NZDUSD , following a sharp decline during the Pacific-Asian session, is testing the support of the upward trend and the liquidity zone...
The dollar is correcting amid escalating tensions in the Middle East. This is a temporary move, and the market may return to its main trend. The currency pair is forming a false breakdown of support
Against the backdrop of an uptrend and a weak dollar, the currency pair is testing support at 0.6000. The reaction is weak at the moment, but there is a chance for growth if the price consolidates above 0.6020. I do not rule out a retest of the liquidity zone at 0.5989 before growth
Support levels: 0.6000, 0.5989
Resistance levels: 0.6068
The inability to continue falling and the formation of a local reversal structure relative to 0.6000 (price consolidation above 0.6020) may support the market. I do not rule out that the market may decline to the liquidity zone of 0.5989 before rising.
Best regards, R. Linda!

USDCHF → Retesting resistance will lead to a declineFX:USDCHF , having failed to reach its global target after breaking through support, is turning back to retest the zone of interest at 0.8157. A fall in the dollar could trigger a decline in prices...
After breaking through support and falling to 0.8055, a correction is forming towards the zone of interest and liquidity at 0.8157. After reaching the local target, the price may return to the global target (liquidity zone) at 0.8042.
The dollar returned to its downward phase at the opening of the session, to which the forex market reacted accordingly. Most likely, bearish pressure may also affect the USDCHF currency pair, which continues to follow the downward trend.
Resistance levels: 0.8157
Support levels: 0.8055, 0.8042
A retest of resistance amid high volatility could form a false breakout (liquidity capture) before the decline continues within the downtrend.
Best regards, R. Linda!

Beautiful ABCD pattern appearing on bigger tf.Beautiful ABCD pattern appearing on
bigger tf.
Crossing 101 - 102 with Good Volumes may
trigger new highs towards 120 atleast.
78 - 80 is an Immediate Resistance area.
On the flip side, a Very Strong Support is
around 68 - 70 & then around 62 - 63

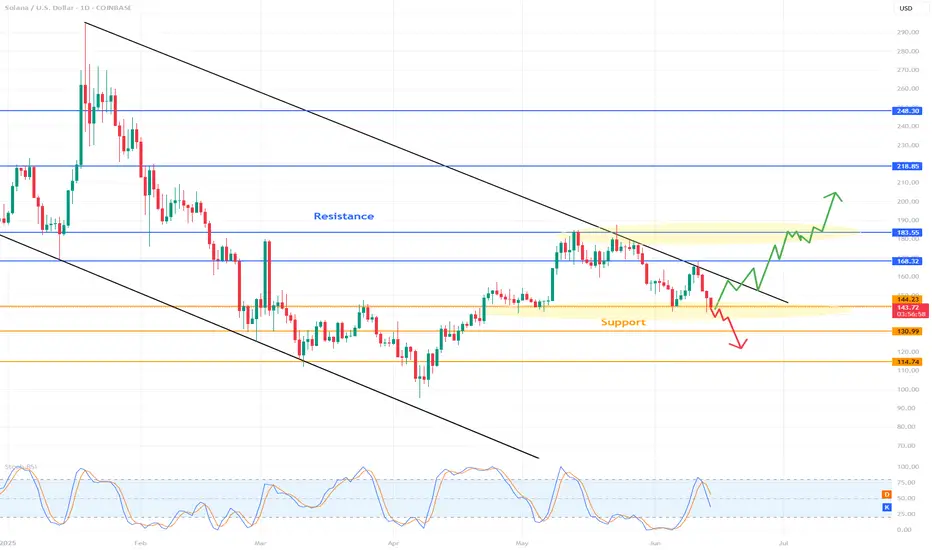
SOLUSD 1D Chart Review1. Main Trend
Downward Channel: Price moving in wide, downward channels (black trend lines), which means that the medium and long term remains bearish.
The upper trend line is a strong dynamic resistance, the lower one – support.
2. Key Horizontal
Resistance (Resistance):
$168.32: Strong resistance level, which it has responded to many times in the past.
$183.55: Another important resistance, confirmed by historical highs.
$218.85: Further resistance with an interval obligation.
$248.30: Very strong, long-term resistance (far from the current price for now).
Support (Support):
$144.23: actually occurs close to this support – very level.
$130.99: Another potential level where price could look for a rebound.
$114.74: Strong support, last bastion of bulls near March/April low.
3. Price action (Price action)
Last candles emitted pullback from downtrend line and down to support area of $144.23.
that any attempt to grow above trend line is limited by sellers.
$144.23 level currently existing short-term support - its loss may be available in case of $131 or possibly existing.
4. Indicator
Stochastic RSI (at the bottom of the chart):
Stochastic RSI indicator stated that airlines (blue and orange) were in power (overbought) in recent devices, but suddenly started to turn down.
Currently occurs in neutral zone, however application of protection (oversold). In case of threat occurrence now, it may suggest risk of attack, but it is not yet decided.
It is worth noting whether to go to the area of 20 and start turning back - in case of a necessary necessity.
5. Scenarios for the days
Bullish (growth):
Maintaining support at 144.23 USD and hitting the downtrend line (around 160-165 USD).
Breaking the trend line and resistance at 168.32 USD will give a signal to load in the area of 183-218 USD, but for the tenth time it seems to be less important, attention given the market structure.
Bearish (fall):
Breaking support at 144.23 USD and closing below on the daily candle - the next target to 131 USD, and then 114 USD.
The downtrend channel is still working against the bulls.
6. Summary
Main trend: downtrend.
Price: Close to support, but the risk of you leaving a big one.
Key horizontals: $144.23 (short-term support), $168.32 (main resistance).
Stochastic RSI: Heading towards oversold zone, but not yet giving a clear conclusion about a breakout.
Recommendation: Observe the application of price at $144.23 and the behavior of Stochastic RSI. In case of a breakout - it is possible that they will occur.
AUDJPY TREND TRADINGLooking to follow the lower time frame bullish trend next week to play into the higher timeframe down trend. Three trade ideas roughly looking to bank 16R. can squeeze more depending on if you market execute from price action signals or just set limit orders with conservative stop loss sizes.

SOL (Weekly timeframe): Trend structure Price is approaching a key macro support zone. However, as long as it remains below the $148 level, I cannot rule out the possibility of one more corrective leg toward the $76–$55 range before a medium-term bottom is established and a potential resumption of the broader uptrend begins.
A breakout and sustained close above the $148 level would serve as the first technical signal that either:
- a corrective wave B (preceding a deeper correction toward the macro support zone) is unfolding, or
- a new long-term bullish trend aiming for all-time highs is beginning.
Monthly outlook:
My previous idea from November 2024 has fully realized its structure:
Thanks for reading and wishing you successful trading and investing decision!

SUI — Trading with Geometry: Why Harmonics Work So WellSUI has been respecting technical levels with remarkable consistency. After bouncing from the $2.8467 low, it surged sharply — completing a clean Cypher Harmonic Pattern. This led to a high-probability short setup at the 0.786 Fibonacci retracement (Point D) around $3.5573.
🎯 Trade Setup Breakdown
Pattern: Cypher Harmonic
Entry (Point D): $3.5573 (0.786 retracement of XC)
Target: $3.1191 (0.618 retracement of CD)
Stop-Loss: Above Point X
The 0.618 fib retracement of the CD leg coincides with a significant key low from May 6, 2025, adding structural confluence. This is an ideal level to monitor for absorption, reaction, or potential reversal behaviour.
🧠 Educational Insight: How to Trade Harmonic Patterns Like a Pro
Harmonic patterns aren't just visually appealing — they represent high-probability setups based on market structure, Fibonacci geometry, and behavioural cycles. The most critical part of every harmonic pattern?
You enter at Point D.
Whether the pattern is bullish or bearish, Point D is your trigger:
In bearish patterns (like this Cypher), you short from Point D.
In bullish patterns, you long from Point D.
This works because Point D marks the exhaustion of the corrective leg, where trapped traders and liquidity often sit. The structure often aligns with supply or demand zones, order blocks, or FVGs (Fair Value Gaps).
💡 Important: Harmonic patterns are most effective on higher timeframes — 4H and above. On lower timeframes, noise increases and reliability drops significantly. For clean execution and meaningful structure, stay with mid to high timeframes.
Here’s how to trade it effectively:
✅ Wait for the full pattern to form — don’t front-run
✅ Use fib levels and structure confluence to validate Point D
✅ Use order flow tools (like Exocharts) to confirm absorption or volume shift
✅ Enter on Point D with your stop-loss just beyond X
✅ Take profits at common retracement levels like the 0.382 or 0.618 of the CD leg
Patience is key. Harmonic traders wait for the market to complete the cycle — then strike with a plan.
📌 Final Thoughts
SUI is delivering clean harmonic respect, and this setup is no exception. Whether you're already short or waiting for further confirmation, keep an eye on volume, liquidity zones, and reaction levels around $3.1191. If this zone holds, it may serve as a pivot for the next move.
Pattern. Precision. Patience. That's how you catch high-probability trades like this.
_________________________________
💬 If you found this helpful, drop a like and comment!
Want breakdowns of other charts? Leave your requests below.

GOLD → Geopolitical risks are driving gold prices up. To ATH?FX:XAUUSD is updating its interim highs as it retests resistance at 3435 amid escalating tensions in the Middle East. Economic risks are on the rise...
Gold rose 1.5% on Friday in Asian trading as investors sought refuge from escalating tensions between Israel and Iran. The price approached 7-week highs and could reach $3,500 if the conflict intensifies. The US and Israel have warned of serious consequences, while Iran has promised to respond. Geopolitics has overshadowed economic news, and markets are pricing in the possibility of a Fed rate cut in September.
Technically, the price is emerging from a local consolidation and testing a fairly important resistance level, forming a false breakout and correction. But this does not mean that the price will fall...
Resistance levels: 3425, 3435, 3461
Support levels: 3408, 3400, 3377
If gold consolidates above 3425 and continues to storm the resistance, growth may continue, and at the moment, there is a fairly high probability of a retest of the ATH. However, the ideal scenario would be a retest of the zone of interest 3408 - 3400 and the capture of liquidity before continuing growth.
Best regards, R. Linda!

USD/CHF 4H Analysis – Bearish Continuation Setting Up?USD/CHF is currently forming a textbook symmetrical triangle consolidation pattern just below key EMAs (20, 50, and 200), signaling potential exhaustion in bullish momentum. Price is compressing against the upper boundary of the triangle, failing to sustain above the 0.382 Fib retracement level (0.82302), which is aligned with the 50 EMA – a known area of dynamic resistance.
This consolidation follows a clear bearish leg from the swing high at 0.83472, which suggests this triangle is likely a continuation pattern. A clean break below the ascending trendline support would confirm bearish continuation, with a measured move target near the 0.81068 level, which aligns with the -0.27 Fib extension.
🔍 Key Technical Levels:
Resistance: 0.82302 (0.382 Fib), 0.82525 (0.5 Fib), 0.82753 (0.618 Fib)
Support: 0.82026 (0.236 Fib), 0.81579 (Swing Low), 0.81068 (Bearish Extension Target)
📌 Watch for:
A decisive break and close below triangle support
Volume spike or bearish engulfing candle for confirmation
RSI is neutral but leaning slightly bearish; room for downside
🎯 Bearish Bias
📍 Tag: #USDCHF #ForexAnalysis #WrightWayInvestments

XAU/USD 1H – Clean Impulsive Setup UnfoldingGold has completed a clean Wave (2) correction, bottoming at $3,292.30, respecting both structural demand and fib confluence. Price is now showing early signs of Wave (3) development to the upside.
📌 Key Structure:
Wave (1) High: $3,403.30
Wave (2) Low: $3,292.30 (confirmed higher low structure)
Market is now consolidating slightly above the 0.5 fib level ($3,324.45), with bullish structure still intact.
📈 Technical Confluence:
Price is holding the internal bullish trendline
RSI is neutral but building potential upside momentum
Price action is forming higher lows, indicating strength post-correction
🎯 Next Bullish Targets:
$3,366.08 (0.236 fib level of Wave (2) correction)
$3,403.30 (Wave (1) high retest)
Final Wave (3) extension zone: $3,445 – $3,500
📉 Invalidation Level:
A break and close below $3,292.30 would invalidate this Wave (2) bottom and open the door for a deeper correction.
✅ Bias:
Bullish, as long as price holds above the 0.618 – 0.705 fib zone. A strong push from this area could confirm the next leg of Wave (3).
@WrightWayInvestments
@wrightwayinvestments
@wrightwayinvestments

GOLD → Strengthening and return to range. Focus on 3340FX:XAUUSD is forming a fairly strong support zone (a cascade within an upward line). The price is returning to the range, with bulls storming 3330-3340.
Markets are awaiting US inflation data (CPI), which may affect expectations for a Fed rate cut in September (chances are about 52%). Optimism following progress in US-China trade talks is supporting sentiment, but uncertainty remains due to a court ruling allowing Trump to maintain tariffs. This is holding back the dollar and helping gold. CPI forecast: 0.2% growth, core inflation 0.3%. Lower inflation, on the other hand, will support expectations of lower rates and strengthen demand for gold as a safe-haven asset.
Technically, gold is stuck between the boundaries of a symmetrical triangle. Overall, this situation is reflected in all markets. Consolidation is forming and the price could break out in either direction...
Support levels: 3301, 3330, 3340
Resistance levels: 3349, 3361, 3375
Focus on the boundaries of the previous range - 3330 - 3340. If the bulls, after the assault, manage to hold their ground above this zone, the market may take the initiative due to support and continue its growth towards areas of interest.
Best regards, R. Linda!

AUDUSD → Correction after a false breakout before growthFX:XAUUSD continues to rise amid uncertainty surrounding the dollar, which continues to consolidate. The currency pair is preparing to test resistance at 0.6537
The dollar is stuck in place due to market uncertainty. At the same time, the Australian dollar is strengthening and is ready to test the liquidity zone
Within the current trend, the currency pair is heading towards resistance and the liquidity zone. We opened far away, and as we move towards the target, the potential for further growth may end. A false breakout of 0.6537 could trigger a correction
Resistance levels: 0.6537
Support levels: 0.6509, 0.6479
A sharp move towards resistance without the possibility of further growth could cause a false breakout of 0.6537. Price consolidation below this level could trigger a correction before growth.
Best regards, R. Linda!

ETHEREUM → Consolidation amid a bull marketBINANCE:ETHUSD is consolidating in the range of 2400-2750, and locally, the coin looks quite promising even against the backdrop of Bitcoin forming a correction...
ETH is forming a strong consolidation within which it confirms a bullish market structure. After a false breakout of resistance, there is no sharp decline and the price returns to retest resistance.
If the bulls hold their defense above 2530-2550, then in the short and medium term, ETH may demonstrate growth towards the intermediate target.
Resistance levels: 2738, 2855
Support levels: 2525, 2470, 2400
A retest of support at 2525 - 2470 is possible, and if the price holds above this support zone, ETH may try to surprise us. There are good chances for growth.
Best regards, R. Linda!

NASDAQ Potential UpsidesHey Traders, in today's trading session we are monitoring NAS100 for a buying opportunity around 21,700 zone, NASDAQ is trading in an uptrend and currently is in a correction phase in which it is approaching the trend at 21,700 support and resistance area.
Trade safe, Joe.

GBPUSD → Countertrend retest of support before growthFX:GBPUSD is forming a countertrend correction to the zone of interest and liquidity while the dollar is stagnating. The market is waiting for a fundamental driver.
Within the uptrend, a countertrend correction is forming towards the liquidity zone at 1.342. Against this backdrop, the dollar is correcting and contracting towards support. The currency pair's price continues to decline, but within the uptrend, breaking the local structure but not the market character. The focus is on the current trading range of 1.342 - 1.359. A retest of support could bring the price back to resistance.
Support levels: 1.3421, 1.339
Resistance levels: 1.3507, 1.3593
A quick retest of the liquidity zone at 1.3421, the inability of GBPUSD to continue falling, a false breakdown, and the price consolidating above 1.3421 would be a good indication that buyers are trying to hold the market. In this case, we could see the price strengthen.
Best regards, R. Linda!

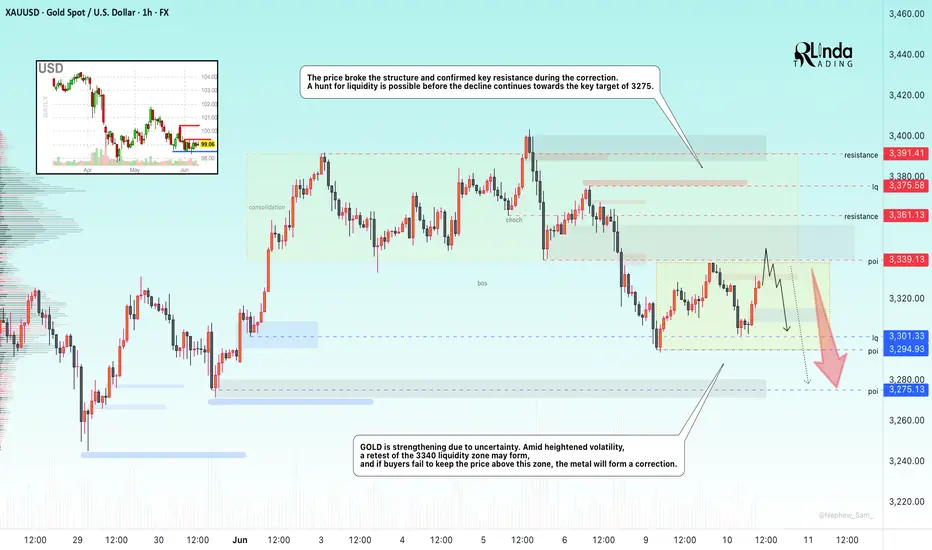
GOLD → Hunt for liquidity ahead of continued correctionFX:XAUUSD is strengthening due to uncertainty while the dollar consolidates. Amid heightened volatility, a retest of the 3340 liquidity zone may form, and if buyers fail to keep the price above this zone, gold may form a correction
Demand for the dollar is supported by the rise in USD/JPY after soft comments on interest rates by Bank of Japan Governor Ueda. Gold is responding with a correction. Traders remain cautious ahead of the outcome of the second day of trade talks between the US and China in London. Donald Trump confirmed that dialogue with Beijing is continuing, but key differences remain. Investors are also awaiting US inflation data (CPI), which could determine the further dynamics of the dollar and gold. Meanwhile, inflation expectations in the US fell from 3.6% to 3.2% in May.
Technically, gold broke the structure and confirmed key resistance during the correction. A hunt for liquidity is possible before the decline continues towards the key target of 3275.
Resistance levels: 3340, 3361
Support levels: 3301, 3275
The price is forming a new trading range of 3340 - 3301 (3294). Before declining, especially if the fundamental background changes to positive as negotiations progress, gold may test the liquidity zone of 3340 and form a false breakout, which will trigger a continuation of the correction to 3275.
Best regards, R. Linda!
GOLD → Correction before a decline or continuation of the trend?FX:XAUUSD is testing the liquidity zone during the Asian session and forming a false breakout. The metal is recovering, but the fundamental background remains unstable...
On Monday, gold is holding steady at around $3,300 amid a weaker dollar and caution among traders ahead of US-China talks and the release of US inflation data (CPI) on Wednesday. Strong NFP data for May strengthened the dollar and lowered expectations for a Fed rate cut. However, domestic problems in the US are putting pressure on the currency... Markets are adjusting positions ahead of CPI. Geopolitics and domestic unrest in the US are holding back gold's decline, despite possible optimism about a trade deal.
Technically, the trend is bullish, with the price previously breaking the structure but rising in the Asian session after a false breakdown of the order block and the 3300 liquidity zone. Further movement depends on 3330 - 3340
Resistance levels: 33301, 3339, 3375
Support levels: 3301, 3275
The price is heading towards 3330-3340 for a retest. If the dollar continues to decline and gold manages to consolidate above 3340, the bullish trend may continue. BUT! A false breakout of the 3330-3340 zone could trigger a further decline after the bullish structure breaks down.
Best regards, R. Linda!

$BTC Extremely Bullish Daily Close - Parabola Underway?Hawt diggity dayumm 🥵
CRYPTOCAP:BTC really going for it following my original idea behind the parabola formation 🤯
Reclaiming ATH high at $112k will confirm the move 🤞

$TOTAL Crypto Market Cap Relief Rally Could be MassiveHUGE relief rally today for Crypto CRYPTOCAP:TOTAL Market Cap 🚨
Need to reclaim local high at $3.5T to confirm this reversal.
If so, we could push to reclaim this cycle's high ~$3.75T
Nonetheless, glad I got some bids filled on this recent correction 😎
I still have some set in case we go lower tho.
