Fibonacci Arcs in Stock TradingFibonacci Arcs in Stock Trading
Fibonacci arcs, derived from the renowned Fibonacci sequence, offer a compelling blend of technical analysis and market psychology for traders. By mapping potential support and resistance areas through arcs drawn on stock charts, these tools provide insights into future price movements. This article delves into the practical applications of Fibonacci arcs in trading, their interplay with market psychology, and best practices for effective use.
Understanding Fibonacci Arcs
The Fibonacci arc indicator is a unique tool in technical analysis derived from the famed Fibonacci sequence. It’s crafted by drawing arcs at the key Fibonacci retracement levels - 38.2%, 50%, and 61.8% - from a high to a low point on a stock chart. Each curve represents potential support or resistance areas, offering insights into the stock’s future movements.
The art of arc reading, meaning interpreting these curves, is crucial for traders. When a stock approaches or intersects with an arc, it reflects a significant reaction level. For instance, if a stock price touches or nears an arc, it could face arc resistance, indicating a potential halt or reversal in its trend.
Applying Fibonacci Arcs in Trading
In the stock market, these arcs serve as a guide for traders seeking to anticipate future price movements. When applied correctly, they can provide critical insights into potential support and resistance levels. Here's a step-by-step look at how you may use them effectively:
- Identifying High and Low Points: Begin by selecting a significant high and low point on the stock's chart. In an uptrend, it’s the most recent swing high to a previous swing low, and vice versa. These are the anchor points.
- Drawing the Arcs: Once the points are selected, draw the arcs at the Fibonacci retracement levels of 38.2%, 50%, and 61.8%. They radiate from the chosen low point to the high point (or vice versa), cutting across the chart.
- Interpretation: Watch how the stock interacts with these lines. When the price approaches an arc, it might encounter resistance or support, signalling a potential change in trend or continuation.
- Timing Entries and Exits: Traders can use the arcs in the stock market as a tool to time their trading decisions. For instance, a bounce could be a signal to enter a trade, whereas the price breaking through might suggest it's time to exit.
Fibonacci Arcs and Market Psychology
The effectiveness of Fibonacci arcs in trading is deeply intertwined with market psychology. They tap into the collective mindset of traders, who often react predictably to certain price levels. The Fibonacci sequence, underlying this tool, is not just a mathematical concept but also a representation of natural patterns and human behaviour.
When a stock nears a curve, traders anticipate a reaction, often leading to a self-fulfilling prophecy. If many traders make an arc stock forecast, they might sell as the price approaches a certain point, causing the anticipated resistance to materialise. Similarly, seeing support at an arc can trigger buying, reinforcing the tool’s power.
This psychological aspect makes Fibonacci arcs more than just technical tools. They are reflections of the collective expectations and actions of market participants, turning abstract mathematical concepts into practical indicators of market sentiment and potential movements.
Best Practices
Incorporating Fibonacci arcs into trading strategies involves nuanced techniques for better accuracy and efficacy. Here are some best practices typically followed:
- Complementary Tools: Traders often pair this tool with other indicators like moving averages or RSI for a more robust analysis.
- Accurate Highs and Lows: It's best to carefully select the significant high and low points, as the effectiveness of the curves largely depends on these choices.
- Context Consideration: Understanding the broader market context is crucial. Traders usually use Fibonacci arcs in conjunction with fundamental factors to validate their analysis.
- Watch for Confluence: Identifying areas where Fibonacci levels converge with other technical signals can provide stronger trade setups.
- Practice Patience: Traders typically avoid making hasty decisions based solely on Fibonacci levels. It's usually better to wait to see additional confirmation from the price action.
Advantages and Limitations of Fibonacci Arcs
Fibonacci arcs are a popular tool in technical analysis, offering distinct advantages and some limitations in analysing stock movements. Understanding these can help traders leverage the tool more effectively.
Advantages
- Intuitive Nature: The Fibonacci sequence is a natural pattern, making the tool intuitive for traders to understand and apply.
- Dynamic Support and Resistance Levels: They provide dynamic levels of support and resistance, unlike static lines, adapting to changing market conditions.
- Versatility: Effective in various market conditions, the arcs can be used in both trending and sideways markets.
Limitations
- Subjectivity in Selection: The effectiveness largely depends on correctly identifying the significant high and low points, which can be subjective.
- Potential False Signals: Like all technical tools, they can generate false signals, especially in highly volatile markets.
- Requires Complementary Analysis: To maximise effectiveness, these curves are usually used alongside other technical indicators, as they are not infallible on their own.
The Bottom Line
Fibonacci arcs are invaluable tools in stock analysis, providing insights into market trends and potential price movements.
This article represents the opinion of the Companies operating under the FXOpen brand only. It is not to be construed as an offer, solicitation, or recommendation with respect to products and services provided by the Companies operating under the FXOpen brand, nor is it to be considered financial advice.
Fibonaccitrading
XAUUSD Bullish Reversal: Discount OB + Fib Stack = Buy SetupXAUUSD (30-Min) | Discount Reversal Zone + Fib Confluence = Smart Long Setup
This GOLD setup is built like a sniper’s dream — liquidity engineered, OB discounted, Fib alignment — all signs point to a bullish reaction off a Smart Money zone.
🔍 Smart Money Setup Breakdown:
🟣 Bullish Order Block (OB)
OB identified between 3,320.792 and 3,324.063
Price is retracing into this discount OB zone
This level also aligns with 70.5% – 79% Fib retracement — high-probability reaction zone
📐 Fibonacci Confluence
Fib drawn from swing low to recent high
61.8%, 70.5%, and 79% zones stacked directly over the OB
This confluence amplifies the chances of institutional buying
📉 Engineered Liquidity + Wick Zone
Price is likely to dip into this OB zone to hunt stop losses
Expect wick reaction, then reversal — typical Smart Money behavior
Anticipated pattern: Drop > Tap > Reverse bullish
📈 Anticipated Price Path
Price dips into OB zone
Strong bullish engulfing expected for confirmation
Targeting retracement to previous high & extension levels
🧠 Chart Ninja Entry Plan:
🔹 Entry Zone 3,320.792 – 3,324.063 (Discount OB)
🔺 SL Below 3,316.000 (below 100% Fib / low structure)
📈 TP 1 3,336.080 (Recent high)
📈 TP 2 3,342.000 – 3,348.000 (Fib extensions -27% to -50%)
⚖️ RRR 1:3 to 1:5 depending on execution and TP
🧠 Chart Ninja Wisdom:
"Gold always dips to discount before it runs —
but only the patient ninjas catch it while others panic." 🥷💰
🔁 Bonus Insight:
Price is currently compressing near equilibrium — meaning volatility is building. The next impulse could be fast. Wait for bullish confirmation candle on the OB tap for low-risk entry.
📊 Drop this zone into your chart and alert the OB area!
💬 Where are you placing your stop loss for this setup? Let’s chat!

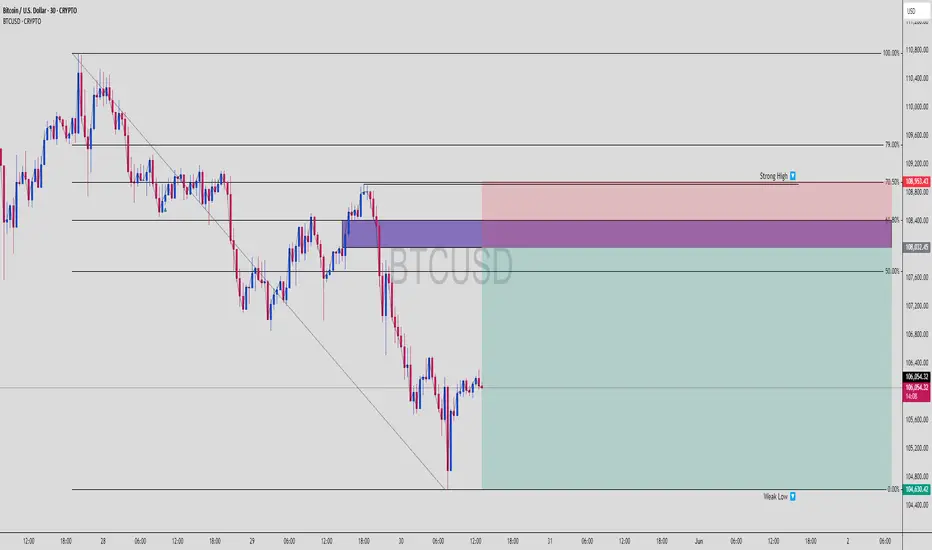
BTCUSD SMC Short | 70.5% Fib + OB Rejection Incoming?BTCUSD | High Risk-Reward Setup at Key Supply Zone 🔥
This Bitcoin setup is setting up for a potential clean short opportunity, right from a key Order Block zone confluenced with 61.8–70.5% Fib retracement and a Strong High liquidity magnet above.
🧠 1. Why This Trade Setup is 🔥
This BTCUSD chart shows Smart Money preparing a trap:
🔺 Impulse down ➝ forming market structure shift
📉 Retracement back to a refined OB (purple zone)
📍 Aligned perfectly with:
✅ 61.8–70.5% Fib retracement zone
✅ Strong High = liquidity trap
✅ Bearish engulfing rejection from supply zone
This is textbook SMC confluence. Price could sweep the high one more time, then tank hard.
📌 2. Zone Breakdown
OB Entry Zone (purple): ~108,000 to 108,400
SL Above Strong High: ~109,000
TP at Weak Low: ~104,600
✅ Entry around 108,000
✅ RRR: ~1:5 👑
📈 3. Market Structure
HTF Bias: Bearish
LTF Structure: Retracing to premium zone
Expecting BOS downward if rejection confirms
⚙️ 4. Trade Plan
Wait for price to tap 61.8–70.5% zone
Look for M5/M15 bearish structure break
Enter on pullback to M15 OB
SL = Above the High
TP = Weak Low (104,630)
🛑 5. Risk Management Tips
Never enter blindly at 61.8%
Always wait for confirmation on LTF (M5/M15)
If price blows past 70.5%, let it go — don’t chase 🧘
🧠 Save this trade plan
📈 Comment “BTC SMC ENTRY” if you caught this
👀 Follow for more Smart Money chart breakdowns
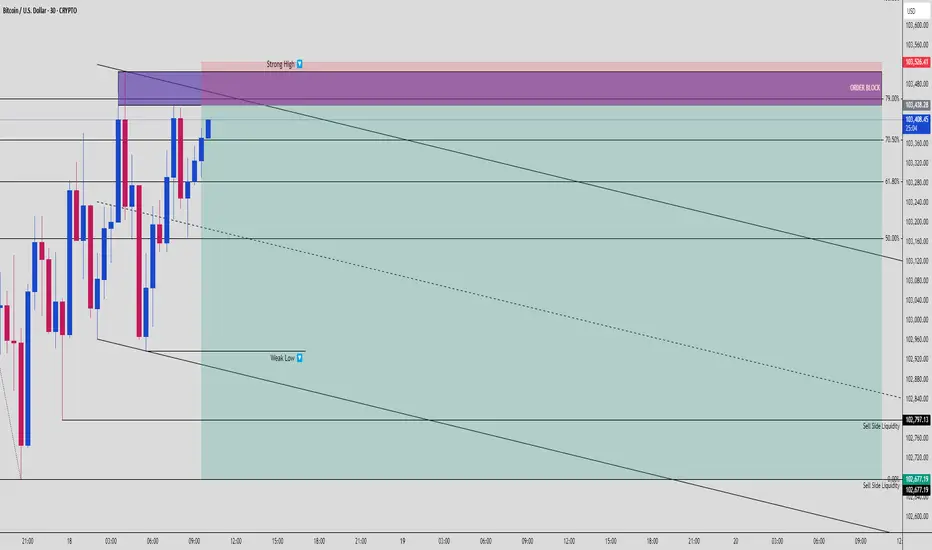
BTC Just Entered the Killzone — Order Block + Strong High Reject🔍 Bitcoin Smart Money Breakdown | May 18, 2025
We’re looking at a potential high RRR short opportunity forming on BTC/USD — chart structure screams SMC precision. Here’s what we’re seeing:
🧩 1. Key Setup Details
Price tapped into a premium Order Block between 103,438–103,526 🔴
Sitting just above a Strong High — liquidity is baiting shorts
Rejection occurred precisely at the 79% Fib retracement level, giving confluence
Bearish structure intact with lower highs & descending trendline
💣 2. Liquidity Map
Above: Strong High = buy-side liquidity trap
Below: Weak Low = prime sell-side magnet
Sell-side liquidity pools at:
102,797.13
102,677.19 (final TP zone)
This is exactly where institutions hunt for exits 🔪
🎯 3. Trade Idea
Entry Zone: 103,438 – 103,526 (OB zone)
Stop Loss: Above Strong High ~103,560
Target Zones:
TP1: 103,120 (50% Fib level)
TP2: 102,797.13 (SSL pool)
TP3: 102,677.19 (final flush zone)
Estimated Risk-to-Reward: 1:3.2 to 1:4.5 depending on SL/TP config 🧠📏
🧠 Bonus Insight:
If BTC wicks above the OB and returns with momentum = potential liquidity grab fakeout — a textbook SMC confirmation entry 👌
🎤 Caption Idea for Short-Form:
“BTC is playing right into the banks’ trap… are you on the right side of this rejection? 😮💨💰”
📲 Follow @ChartNinjas88 for elite SMC plays, sniper-level breakdowns, and real liquidity flow setups!
EURUSD Just Landed in the Killzone — Bounce or Breakdown?🔥 EURUSD 15-Min SMC Precision Play — May 14, 2025
Here’s a sweet Smart Money sniper entry on EURUSD, caught right as price tagged a powerful triple confluence zone:
📊 1. Structure & Momentum
Recent bullish momentum created a weak high around 1.12660
Retracement follows with strong bearish pressure
Price lands exactly at a previous OB, Fair Value Gap, and the 61.8% fib retracement
🧱 2. Confluence Breakdown
🔴 Fair Value Gap (FVG): Unfilled imbalance tapped
🟣 Order Block (OB): The last down candle before bullish rally
🟡 61.8% Fibonacci Level: Price kissed the golden pocket
This stacking creates a high-probability reversal zone
🎯 3. Trade Plan
Entry: Around 1.12160
SL: Below 1.12090 (under 70.5% fib)
TP: At 1.12660 targeting previous weak high
RRR ≈ 1:6 — optimal asymmetric reward play
🔄 4. Management & Outlook
Watch for reaction on the 50% level at 1.12300
Break of market structure above 1.12400 = confirmation
Scaling out advised at midline levels with stop-loss trailed manually
🧠 Smart Money knows this is where the liquidity pools live. You're not late — you're patiently positioned where the institutions hunt.
🎯 Drop a “📍” in the comments if you're watching EURUSD
🎥 Follow for more sniper setups like this one — @ChartNinjas88

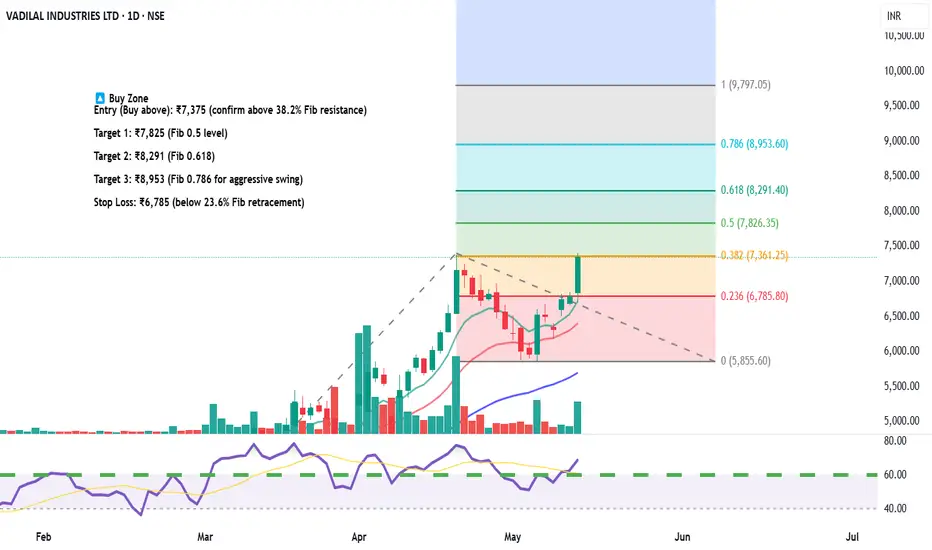
Vadilal Industries – Equity Trade Setup & Research View🟢 Long Trade Setup (Bullish Reversal Play)
Current Price: ₹7,346.50
Fibonacci Level Tested: 38.2% at ₹7,361 — a crucial breakout level
Trendline Breakout: Price has broken above falling trendline with volume confirmation
RSI: Near 60 – bullish momentum building
🔼 Buy Zone
Entry (Buy above): ₹7,375 (confirm above 38.2% Fib resistance)
Target 1: ₹7,825 (Fib 0.5 level)
Target 2: ₹8,291 (Fib 0.618)
Target 3: ₹8,953 (Fib 0.786 for aggressive swing)
Stop Loss: ₹6,785 (below 23.6% Fib retracement)
🔻 Short Trade Setup (if rejection happens)
Sell Below: ₹7,200
Target: ₹6,785
Stoploss: ₹7,375
📅 Timeframe: Daily (1D)
📊 Risk/Reward Ratio: 1:2.5+
🔁 Valid for: Next 2–4 weeks
For Education Purposes Only
USDCHF 30min | Fibonacci + Order Block Combo Reversal Setup💵 USDCHF 30-Min Smart Money Breakdown — May 14, 2025
This is a prime example of a multi-confluence reversal trade. Let’s walk through this sniper setup:
🔍 1. Market Structure & Context
Price has been flowing within a solid descending channel
We just witnessed a sharp impulse leg downward, now reacting from a key demand area
Channel bottom + OB + fib = confluence stacker heaven
🧱 2. Zone Confluence
Price taps into a high-probability Order Block (highlighted purple)
Lining up with the 61.8% fib retracement, one of the most powerful golden pockets
Immediate reaction seen with bullish wick rejection — evidence of smart money stepping in
📈 3. Entry Logic
Entry: Around 0.83350
SL: Below 0.83200 (protected under 70.5%)
TP: Near 0.84700
RRR ≈ 1:5+ — perfect for prop firm funded traders or swing-style scalpers
🔁 Management & Outlook
Key confirmation = break above midline channel
Scale out at 0.83700 (50% fib), then trail SL for runners
If price rolls back under 0.83200, it may seek the 79% or deeper liquidity zone
💡This type of setup is what separates reactive traders from anticipatory Smart Money traders. You’re not chasing—you're waiting in the kill zone.
💬 Comment “🔥” if you’d take this setup.
🔁 Repost if you love OB + Fib sniper logic.
📲 Follow @ChartNinjas88 for next-level breakdowns.

GOLD 30m Buy Setup | FVG + Fib Discount + Reversal Block🌟 GOLD (XAUUSD) Buy Opportunity | May 9, 2025 | 30m SMC Setup
This GOLD setup on the 30-minute timeframe presents a textbook Smart Money entry. We’ve got a deep retracement into the 61.8% Fibonacci level, clear Fair Value Gap (FVG) demand zone, and a sharp rejection wick + micro reversal block right at the zone.
🔍 KEY CONFLUENCES:
🔻 Deep Discount: 61.8% Fib zone
🟧 FVG block inside key institutional candle
🧱 Reversal block right before the reaction
💥 Aggressive price rejection at 3,297 zone
📈 Targeting premium levels ~3,369.6
🛡️ SL below 70.5% (~3,293.2) — safe under liquidity grab
📈 Setup Specs:
Timeframe: 30min
Direction: Long
Entry Zone: 3,302 – 3,303
TP: 3,369.6
SL: ~3,293.2
RR: Approx. 1:8+
💡 Trade Logic:
Smart Money engineered a sweep of local lows, then left an imbalance (FVG) as the market shifted. The 61.8% retracement + bullish wick combo confirms intent. The reaction is strong — we expect price to fill the inefficiency and target premium liquidity above.
🎯 Chart Ninja Tip:
“Where price pauses, Smart Money loads. Where it explodes, they’ve already finished.”

XAUUSD – 1h Fib Premium Rejection Setup + Liquidity Sweep📉 XAUUSD SHORT SETUP – May 8, 2025 | SMC Confluence Mastery
Gold is showing a high-probability short scenario off a premium Fib retracement zone with rejection from key structure and Smart Money reversal patterns.
Here’s why this 1h setup could be the next sniper entry for Chart Ninjas:
🧠 KEY CONFLUENCES IN THIS TRADE:
🔺 Entry in Premium Zone: Price retraced into 70.5%–100% zone and rejected cleanly
🧊 Liquidity Above: Engineered buy-side liquidity was swept before reversal
📉 Bearish Order Flow: Consecutive lower highs + break of structure (BOS)
🛠️ Entry at 78.6% zone (~$3,416.99), stop above swing high
🕳️ Targeting Deep Discount: TP at ~-62% Fib level, near $3,262.01
🚨 Risk-Reward: Approx. 1:4.5 RR — clean structure with low risk
⚙️ Trade Execution Strategy:
Look for rejection candles / breaker blocks in the 78–100% zone
Set SL just above the swing high (~$3,420)
Target full imbalance fill into deep discount zone
Manage with trailing stop after price hits 0% or -27%
📊 Setup Summary:
Timeframe: 1H
Bias: Bearish
Entry: Premium Fib Rejection
TP: -62% Fib Extension
SL: Above 100% level
RR: 1:4.5+
Confluences: Fib, Liquidity Sweep, BOS
💬 Chart Ninja Insight:
“Smart money never sells lows or buys highs. They sell where liquidity is hiding—just like this.”

BTCUSD – 30m Precision Entry from FVG & Fib Discount Zone🚀 BTCUSD BUY SETUP | May 8, 2025 | Smart Money Precision Execution
This 30-minute chart screams Smart Money accumulation with a golden entry aligned at the 70.5–78.6% Fib levels AND a bullish Fair Value Gap (FVG) just below.
Here’s the confluence breakdown you need to study:
🔍 KEY CONFLUENCES:
🟣 Fair Value Gap (FVG) between $97,800 and $98,550 – prime liquidity zone
📉 Deep Discount Entry at 70.5%–78.6% Fib retracement ($97,797 – $97,200)
🔁 Breaker Block + Internal BOS confirming upside intent
📈 Target: -27% Extension Zone around $100,920
✅ RR: 1:4+ with tight risk below swing low
🧠 Execution Strategy:
Enter near $97,797 – inside the FVG
SL: Below 100% Fib (~$96,800)
TP: -27% Fib (~$100,920) or scale partials at 0% / -10%
Break-even management once price closes above $99,500
📊 Setup Summary:
Timeframe: 30m
Bias: Bullish
Entry: FVG + Deep Discount
TP: -27% extension
SL: Below 100% Fib
RR: 1:4
Structure: Smart Money Reversal
💡 Chart Ninja Insight:
“Smart money enters where retail panic sells. The FVG is the highway—they’re just waiting to get on.”

GBPUSD – 30m Buy Setup | FVG Entry + ChoCh + -27% Fib Target💷 GBPUSD Long Setup | May 8, 2025 | 30m Smart Money Model
This 30-minute GBPUSD chart shows a perfect Smart Money shift backed by a clean Change of Character (ChoCh), a deep pullback into a Fair Value Gap (FVG), and confirmation via breaker block reentry.
Let’s break it down:
🔍 KEY CONFLUENCES:
🟪 FVG between 1.32909 – 1.33112
🔄 ChoCh confirms structural shift from bearish to bullish
📉 Entry inside 50–79% Fib retracement (Discount Zone)
🧱 Breaker Block confluence with internal BOS
🎯 Target: -27% Fib extension = 1.33737
🛡️ Stop below 100% Fib ~1.32400
📈 Setup Specs:
Timeframe: 30min
Bias: Long
Entry Zone: 1.33090 – 1.33110
TP: 1.33737 (Fib -27%)
SL: ~1.32400
RR: Approx. 1:3.5+
💡 Why It Matters:
Smart Money often accumulates positions in hidden imbalances like this FVG zone. Retail traders get shaken out on the pullback — meanwhile institutions reload just below previous liquidity sweeps. The ChoCh confirms the shift, and boom — the liquidity vacuum fuels a launch to premium levels.
🎯 Chart Ninja Tip:
“ChoCh isn’t just a signal… it’s a signature. It tells you Smart Money is changing sides.”

GBPAUD BuyI believe we are still in an uptrend to 2.16XXX.
On the lower timeframe, price had so much momentum to the upside, we did not have a fibonacci retracement of at least 38.2. Price stalled out at the 1.18 and 1.27 D extension and sold to the 61.8 level.
I believe the 4HR fib is still active and needs to complete.
I think our next stop is 2.063XX to finish out the current sequence.
4HR and Daily stochastic are in the buy zones.

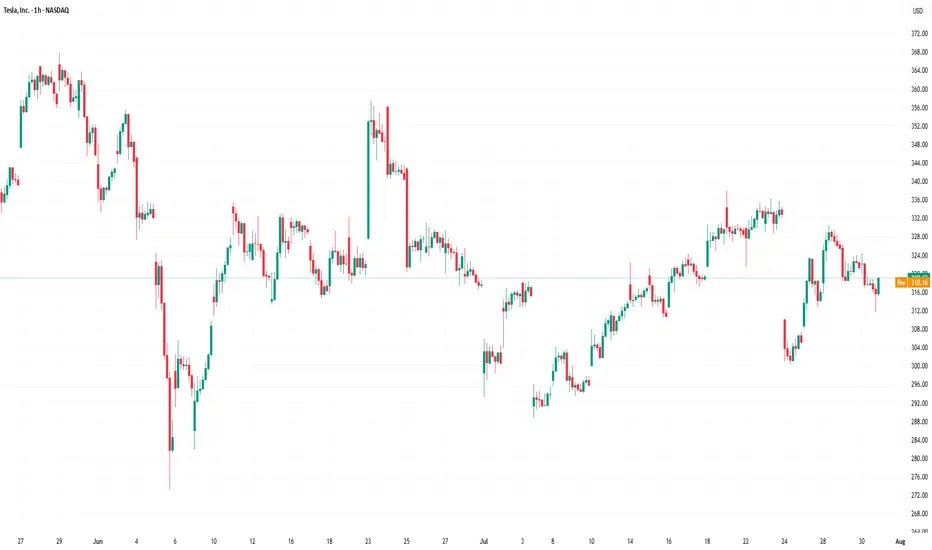
TESLA: 4 Hour DOWN TO THE 5 MINUTE MUST WATCH FOR WHATS NEXTMORNING TRADERS
currently this video is an extension of my last Tesla video I did we are are still trying to go to: will be break up and hit our 272 target or will need a bit more correcting to do before we can try our hands at the long trades.
I break this video down for you to give you the best insight into the best levels to look for if you trying to trade Tesla and why
Enjoy
MB Trader
Happy Trading

GBPUSD ANALYSISAfter seeing GU reject a daily trendline area of resistance for a retracement, we could see price continue to the upside after reaching into the Fibonacci 61.8%

CGC trade from bounce at fib level LONGCGC fell in a standard Fibonacci retracement of 3 week trend up from Mid-March. News of
an application to issue a new class of shares may as well be considered a dilution of current
shareholders. CGC is 5 days away from National MJ Day of the 20th. I expect a further
pullback into the 0.618 level given the fundamental news but CGC could rally on trader interest
regarding the notable day. My trade plan is to buy a pullback if and whne it finds support at
6.15 and then enter long seeking the target of 7.95 which would be a Fib 0.5 retracement of
the trend down. I will look at other MJ stocks as well.

PLTR LONG on a 0.5 Fib PullbackPLTR services DOD and military contractors which is a growth industry given current geopolitical
backdrops. I see this as an opportune time to buy the dip which is a healthy correction from
a recent trend up. The idea is illustrated on this 120 minute chart with targets and stop loss.

Taking the Guesswork Out of Take Profit: A Fibonacci Approach
In the world of trading, one of the most influential factors that can either make or break a trader is the mind. How often have we found ourselves saying, "I should have done this" or "I would have done that" after a trade has unfolded? Yet, when we were in the heat of the moment, those seemingly obvious solutions never crossed our minds. To overcome this common pitfall and make more calculated decisions when it comes to setting take profit levels, we can turn to the Fibonacci tool.
Utilizing Fibonacci retracement levels can help traders establish mechanical and consistent take profit points. This is especially crucial for mechanical traders who rely on predetermined parameters for their trading strategies. Let's delve into how you can use Fibonacci step by step to set your take profit levels, taking into consideration a buying scenario (though the process remains the same for selling, but in reverse).
**Step 1: Add -0.272 and -0.618 Levels to Your Fibonacci Tool**
Begin by adding the -0.272 and -0.618 Fibonacci retracement levels to your Fibonacci tool. These negative levels will be instrumental in creating mechanical take profit points.
**Step 2: Place Your Fibonacci Tool from Low to High**
Next, take your Fibonacci tool and place it from the low point to the high point of the relative price movement you're analyzing. This essentially helps you identify potential retracement levels within the price action.
**Step 3: Identify Negative Levels**
As you apply the Fibonacci tool, you'll notice the negative levels (-0.272 and -0.618) on your chart. These levels will suggest specific price points that you can consider for setting your take profit. Interestingly, you'll often find that prices tend to react near these negative Fibonacci levels because they represent strong psychological levels in the market.
By following these steps, you can establish a mechanical and objective approach to determine your take profit levels. This approach not only reduces the influence of emotions in your trading decisions but also provides you with a systematic way to lock in profits. Remember that while the example here focuses on buying, the process remains the same for selling, with the Fibonacci levels adjusted accordingly.
Incorporating Fibonacci retracement levels into your trading strategy can be a game-changer, helping you trade with greater discipline and consistency. The key is to trust the numbers and your predetermined plan, allowing you to make more informed trading decisions and ultimately enhance your overall trading performance.

Windham Hotels & Resorts - 10:1 Long, Speculative News ResponseMy analysis of Windham Hotels & Resorts follows news of NYC's recent ban of AirBNB, a development which inspired me to discover which publicly traded hotel chain might be best positioned to benefit. Hopefully you will challenge my conclusion and/or my measurements with your tough questions, since this venue is meant to arouse the reverse-engineers and to provoke the thinkers to do what they do best, right?
As always, I strive to render these ideas of mine so obviously that their explanation will require no words, but this 10:1 Long trade on the WH chart is highly contextual. Not even a Market Maker can move the price of ABNB as reliably as the State of New York.
Although my trading strategy is built on innate Pattern Recognition and a hard-won sympathy for the Market Maker’s Business Model, my tactics - including the beauty of Tradingview and how it makes me look good - are based on identifying the opportunities within VOLUME, VOLATILITY and TREND EXHAUSTION.
Generally speaking, what a Speculator does that an Investor or a Trader does not is specifically to take advantage of price inefficiencies caused by government interference (or corruption). A good example would be accumulating toilet paper and/or N95 Masks in 2020 and selling the stock in bulk at high markup before the window of opportunity finally closed.
Only a Speculator does that!
The details of the chart(s) speak for themselves, however behind the scenes ChatGPT and I determined that MAR, HLT, IHG, AC and WH were the hotel chains with the greatest number of rooms in NYC that might benefit from the AirBNB news. I was surprised to see that both MAR and HLT are at or near All-Time-Highs, but just as quickly ruled them out as candidates for major growth for exactly that reason.
In short, without ChatGPT concluded that WH is the best candidate to benefit from what might become a growing trend, but is already law in NYC and will therefore have an effect on prices and practices. If this case interests you, then I invite you to compare the listed tickers and let me know if you agree about WH.
Keen observers will see many details in this idea, but how many noticed the ABNB correlation coefficient histograph? If my trade thesis is correct, the polarity should invert, and the tickers will move in opposite directions more often, and for longer.
I am preparing a video on prospecting for opportunities during the current Sector Rotation, and Windam Hotels & Resorts might become part of it. First, though, I have a few more ideas to upload as I update other key charts for the final Quarter of 2023.
Until then, be liquid !!!

UNVEILING THE COMPREHENSIVE ARSENAL OF TRADING TOOLS
The trading landscape in the 21st century is characterized by a revolutionary fusion of cutting-edge technology and financial acumen. As the accessibility of trading increases, traders wield a versatile suite of tools that encompass chart patterns, Fibonacci retracements, Andrews' pitchfork, and the Zig Zag indicator. This in-depth exploration delves into the profound significance of these tools, unraveling their collective potential to empower proactive traders with precision, insight, and strategic advantage.
The Evolution of Modern Trading Tools:
The digital age has ushered in a new era of trading prowess, where rapid data flows and advanced software solutions redefine the boundaries of trading. Enabled by the synergy of computers, high-speed internet, and sophisticated charting software, traders enjoy real-time access to data analytics and market trends. Within this realm, a rich repository of tools is available, catering to traders' diverse needs with heightened precision and predictive power.
Chart Patterns : Deciphering Market Sentiment:
Chart patterns occupy a pivotal role as visual conduits of market psychology and price action trends. From classic formations like double bottoms to iconic patterns like head and shoulders, these visual representations encapsulate historical price movements and inform future price dynamics. Proactive traders leverage chart patterns to anticipate pivotal reversals and breakout points, weaving together historical trends and human behavioral insights into actionable trading strategies.
Fibonacci Retracements: Unveiling Harmonious Ratios:
At the nexus of mathematics and trading, Fibonacci retracements harmonize the natural ratios discovered by Leonardo of Pisa, known as Fibonacci. These ratios, including the Golden Ratio (0.618) and its derivatives, echo natural proportions that echo throughout nature and financial markets. Traders utilize these retracements to identify potential support and resistance levels, choreographing entry and exit points with a mathematical precision that complements market intuition.
Andrews' Pitchfork: Sculpting Market Trends:
From the annals of technical analysis emerges Andrews' pitchfork—a tool that imparts structure to market trends. Crafted by Dr. Alan Andrews, this method employs three pivotal price points to map out potential trend channels, identify support and resistance zones, and navigate the ebb and flow of market movements. Proactive traders harness this tool's prowess to create strategies that thrive within these discernible channels.
Zig Zag Indicator : Distilling Price Trends:
Navigating the labyrinthine price chart is simplified by the Zig Zag indicator—a tool designed to eliminate market noise and elucidate significant price movements. This indicator employs precise highs and lows to create lines that showcase trends with clarity, ensuring that traders are privy to substantial trends while disregarding minor fluctuations. In this manner, the Zig Zag indicator becomes a beacon amidst market complexity.
A Synergistic Trading Arsenal:
The amalgamation of chart patterns, Fibonacci retracements, Andrews' pitchfork, and the Zig Zag indicator engenders a holistic trading approach of unparalleled potency. While chart patterns unveil market psychology, Fibonacci retracements contribute mathematical precision, Andrews' pitchfork orchestrates trend analysis, and the Zig Zag indicator distills trends from noise, thus harmonizing a comprehensive trading strategy.
Conclusion:
In an era marked by unceasing innovation, success in trading is predicated upon the adept utilization of a multifaceted toolset. The amalgamated prowess of chart patterns, Fibonacci retracements, Andrews' pitchfork, and the Zig Zag indicator constitutes a comprehensive arsenal that empowers traders with foresight, precision, and strategic edge. As the 21st-century trading milieu continues its evolution, mastery over these tools remains pivotal, transforming the intricate dynamics of financial markets into a realm of opportunity and achievement.
TCPLTP

Learn Fiboonacci Retracement & Extension Tools 📚
Hey traders,
In this article we will discuss two very popular Fibonacci tools:
Fibonacci retracement and extension.
1️⃣Fib.Retracement tool is applied to identify a completion point of a retracement leg within an impulse.
As you know price action has a zig-zag form.
For example, in a bullish trend, the price tends to set a higher high then retrace and set a higher low before going to the next highs.
In a bearish trend, the price tends to set a lower low and retrace to a lower high.
With retracement levels, we are trying to spot the point from where the next impulse in a bullish or bearish trend will initiate based on the last impulse leg.
Fib.levels that we will apply are:
✔️0.382
✔️0.5
✔️0.618
✔️0.786
The retracement levels will be drawn based on XA impulse leg.
From its low to high if the impulse is bullish
and from its high to low if the impulse is bearish.
From one of the above-mentioned levels, a trend-following movement will be expected.
One should apply different techniques to confirm the strength of one of these levels.
Here is the example, how perfectly EURAUD respected 618 retracement of a bullish impulse leg after a pullback.
Please, note that Fib.Retracement tool was applied based on candle wicks, not bodies.
2️⃣Fib.Extension tool is applied to identify a completion point of the impulse.
In a bearish trend, the extension levels will indicate a potential level of the next lower low based on the length of the last bearish impulse.
Fib.levels that we will apply are:
✔️1.272
✔️1.414
✔️1.618
The extension levels will be drawn based on XA impulse leg.
From its low to high if the impulse is bullish
and from its high to low if the impulse is bearish.
From one of the above-mentioned levels, a retracement leg will initiate.
One should apply different techniques to confirm the strength of one of these levels.
Above again is EURAUD . Please, note how perfectly the pair completed a bearish impulse after the test of 1.414 extension of a previous bearish impulse.
Of course other ways of application Fib.Retracement and Extension levels exist. However, these two are the most common.
Let me know, traders, what do you want to learn in the next educational post?

📊 Fibonacci Trading: Extension LevelsThe Fibonacci retracement tool plots percentage retracement lines based upon the mathematical relationship within the Fibonacci sequence. These retracement levels provide support and resistance levels that can be used to target price objectives.
Fibonacci Retracements are displayed by first drawing a trend line between two extreme points. A series of six horizontal lines are drawn intersecting the trend line at the Fibonacci levels of 0.0%, 23.6%, 38.2%, 50%, 61.8%, and 100%.
📍 How this indicator works
The percentage retracements identify possible support or resistance areas, 23.6%, 38.2%, 50%, 61.8%, 100%. Applying these percentages to the difference between the high and low price for the period selected creates a set of price objectives.
Depending on the direction of the market, up or down, prices will often retrace a significant portion of the previous trend before resuming the move in the original direction.
These countertrend moves tend to fall into certain parameters, which are often the Fibonacci Retracement levels.
📍 Calculation
Fibonacci numbers are a sequence of numbers in which each successive number is the sum of the two previous numbers:
1, 1, 2, 3, 5, 8, 13, 21, 34, 55, 89, 144, 233, and so on.
📍 What Are Fibonacci Extensions?
Fibonacci extensions are a tool that traders can use to establish profit targets or estimate how far a price may travel after a pullback is finished. Extension levels are also possible areas where the price may reverse.
Drawn as connections to points on a chart, these levels are based on Fibonacci ratios (as percentages). Common Fibonacci extension levels are 61.8%, 100%, 161.8%, 200%, and 261.8%.
🔹 Because Fibonacci ratios are common in everyday life, some traders believe these common ratios may also have significance in the financial markets.
🔹 Fibonacci extensions don't have a formula. Rather, they are drawn at three points on a chart, marking price levels of possible importance.
🔹 The Fibonacci extensions show how far the next price wave could move following a pullback.
🔹 Based on Fibonacci ratios, common Fibonacci extension levels are 61.8%, 100%, 161.8%, 200%, and 261.8%.
🔹 Extension levels signal possible areas of importance, but should not be relied on exclusively.
👤 @AlgoBuddy
📅 Daily Ideas about market update, psychology & indicators
❤️ If you appreciate our work, please like, comment and follow ❤️

I Entered Long on Bitcoin TodayBitcoin broke a temporary downtrend with an impulse up. With the 1 marked on the fib tool, I drew down to where the impulse started from. Noticing that it retraced without a bar close below the 88 percent retracement effectively, I entered the trade. Luckily, it has not reached the 161.8 percent extension of its golden ratio sequence of the pattern that all assets follow.

Bitcoin Dead Cat Bounce???I suspect that there are similarities between the bitcoin fractal in the 2019 - 2020 range and its fractal in the 2021 range to today.
If examined more carefully, its fractals pattern forms a big descending triangle pattern, where the last upward rally in that pattern begins with a double bottom. However, there are high uncertainties regarding how accurate the shape of the triangle might be. Therefore, I feel if
we can map each support - resistance level at that last rally up, we can minimize the trading risks.
Note: I would like to declare that this is not a financial advice. Any presented informations should be regarded as sharing opinion of my trading strategy.
Best Regards
El Suneo
