LONG GBPUSDThis based on pure technicals. Now as we can see the price in cable is respecting the channel but based on Fibonacci series.. 61.8 fib - The golden ratio has always worked well..
Considering we may have formed the bottom today almost at the tip of the channel, this has high probability for a reversal till 1.3077.. Only catalyst for that would a be a decent beat in GDP numbers due on Friday along with some soft brexit stance coming from the UK.
Fibonnacci

Out of bullish energy- EURAUDAfter a bullish correction, pair has been on a weekly consolidation to see if the price could go further. After that, price broke down and now MA200 and MA50 has been broken. We can expect a bearish scenario for the pair on the upcoming weeks.

CADJPY LONG term (retest of the new support)-CADJPY LONG term (retest of the new support)
-Resistance become support
-Fibonnacci 50.00% rejection
-Bullish Engulfing

USOIL SHORT term opportunity (Bearish chanel)-USOIL SHORT term opportunity (Bearish chanel)
-Fibonnacci 61,80% rejection
-Bearish Hammer pattern H2

$GOLD | Take the advantage of small bullish wave!Hey Everyone,
In our Previous analysis of Gold we Sold it from $1342 till $1298 rendering us with positive 400PIPS of Profit,
and now it's time to buy this asset keeping the targets small
the reason is quit simple because the Trendline still holds it strong and it could potentially meet our target
also it's the bullish phase market seems to have a Bullish roar ATM!
So, here's our preferences,
BUY at CMP
STOP LOSS - 1210
TARGET - 1340
have any doubts? than, let us know in the comment section below
and make sure to give this analysis a Thumbs UP +_+

Ambrosus ascending AMB has formed an ascending triangle on the 4 hour timeframe. Generally, this is a bullish continuation pattern and due to multiple other indications on other time frames, it can be seen that AMB is attempting to move into an uptrend (at least across the smaller timeframes under 1D)
The stochastic RSI and the MACD both have a bull cross and they are indicating good momentum.
This is further confirmed by the kijun and tenkan resting as support.
The top of the triangle has previously been tested and the break has been rejected. Another failed break of the topside could mean the price rebounds back to the .618 fibonacci levels ~
However, a topside break here could set the price up for a fib extension to the 1.0 fib line at 5472~

Ichimoku and Fibonnaci Short ADA BOUNCE Ichimoku : Strong support with SSB and Kijun ==> combination of both == STRONG SUPPORT
Fibonnaci : The strong support is on the classic 50% rectracement of Fibonnaci ==> even a stronger support

EU Consolidation tradeBunch of previous structure dead on .618 retracement
Not looking for huge reversal just a pullback into targets at the .382 which is also into prev structure
Stops a little above 1.175 even handle
Targets into 1.16450's

EURGBP SHORT? 130 pipsEURGBP is still falling!
Here's a downward channel trade with potential 40 pips for the conservative, 110 pips for the brave if you take the 2 trades.
Follow @Bizlus

DOLLAR RE-TRACE/RE-TEST.GOOD DAY TRADERS
THIS IS MY ANALYSIS ABOUT DXY .
1. Price near strong resistance.
2. Price near fibonacci 0.382.
So this what i'm thinking.
I'm going SHORT in this pair.
Entry : Around 94.00
Stop loss : Around 95.30
Take Profit : Around 92.00
PLEASE TAKE PROFIT AS LONG AS YOU WANT.
TAKE CARE EQUITY, THERE IS NO REASON TO RISK CAPITAL.
U'r very welcome to give a comment.
DISCLAIMER ON !!!!

LONG Dollar IndexPros
Elliot wave completed, expecting an ABC correction.
Pullback of 38.2/50.
Support zone
Longterm bullish.
Cons
Downtrend.
The last peak, may cause a divergence.
Strategy
Wait for a 38.2/50% correction of the last wave to enter the market.
I think the position can be closed when (A) was reached, but can manage moving the stop behind the last trough to reach (C).

Bad Day for Cryptos-May 23rd!How does this fit in the long term?I'd say, bitcoin/other alts, are technically on extreme sale right now, which is about to end the beginning of June!
(That is if bitcoin sustains a level above 7000)
MACD on 4 hr has been winding on and on since the first time Bitcoin hit 6000. At any time it could become pressurized enough to make a move either way.
Why does it have to hold above 7000?
-Psychological support, possibly a 3rd failed rally to break 12000, might mean retesting and breaking 6000, also 7200/7400 is a fib. support zone of the previous 2 major uptrends. Breaking bellow 7000, would be the bearish scenario.
What I do see next is a potential formation to wave 1(Bounce). This won't happen immediately, it would most likely happen after a couple of days of stability in which buyers will potentially wake up and see the opportunity. My assumption is that Wave 1 could go all the way up to 9000 before wave 2. This would be the bullish scenario.
As always, like, share or comment any kind of suggestion or addition to the chart!

Closing of shorts from 7.8 to 7.7kIf you are short like me, the closing opportunity to catch the dip comes soon. Confluence of fibonaccis at 7750, and we are hitting historically key support areas.
We are starting to see bullish divergence on the lower time frames for a bounce short term.

Fibonacci Confluence - AAPL Fibonacci Retracement videoCheck out this instructional video on using the Fibonacci Retracement on TradingView.
youtu.be


CAPJPY Bearish Gartley
CADJPY W1 is currently making Lower lows and lower highs but recently has been in an uptrend
Here's a prediction at a possible reversal back into downtrend so we can short
We're finding point D in this Bearish Gartley entry around 82.805 and SL and TP levels as recommended by the pattern

NZDCAD Bullish 15M Gartley forming
D1
NZDCAD D1 is forming a head and shoulder with 200EMA acting as support.
Can we find some pips in the weak right shoulder?
Drop to 15M
Uptrend is still imminent and a Gartley is forming.
Follow/Like: @bizlus
Comment/Feedback
Gift:
BTC 1.78% 14Ee3cGJLBdBN7PWRBwu3d41S3NVbqERRq
ETH 0x8844032d9b0791fdfa6633e3768cfe1d6a767c88
LTC LQmkqNvv3JVfFpHQ32Wp6mdiBPpLLgmmmf

MCO/BTC next try to get out. Anyone DCA? Trend AnalysisHi Fellas,
this is my next Idea to be able to move some of my funds. I've made a trend channel but due to the actual situation I think this will go back to the small 50 retracement. Then there is again my buying area. I will wait for confirmation. If we cant hold it due to EMA resistance and missing volume I will keep an eye on it and look for another buy opportunity.
The red line is my "old" AVG price from a couple weeks ago (yes, weeks) and the green one will be the new AVG price. So I should be able to get out with apprx. 0.5-1% gain. If MCO pumps and the indicators gave me more confirmation I will hold.
Cheers,
bitcoin-089


BTCUSD dos opcionesUn posible escenario para el BTC podría ser este... una nuevo rebote en la resistencia de la linea de tendencia acelerada para ir en busca del soporte de los 6000 dando un pequeño impulso alcista antes de romper levemente el soporte para tomar fuerza y cambiar la tendencia. Otro escenario posible seria que rompa el soporte de los 6000 para ir a buscar definitivamente el punto de los 4900 donde tocaria el punto fibonacci del 78%.

Gold Fibonacci. ExpansionGold prices are pushing up . If Breaks above 50% (1362) Fib will lead to our 61.8% .(1376)
Alternatively , a reversal back below our 23% (1330) will lead to our floor support (1301)

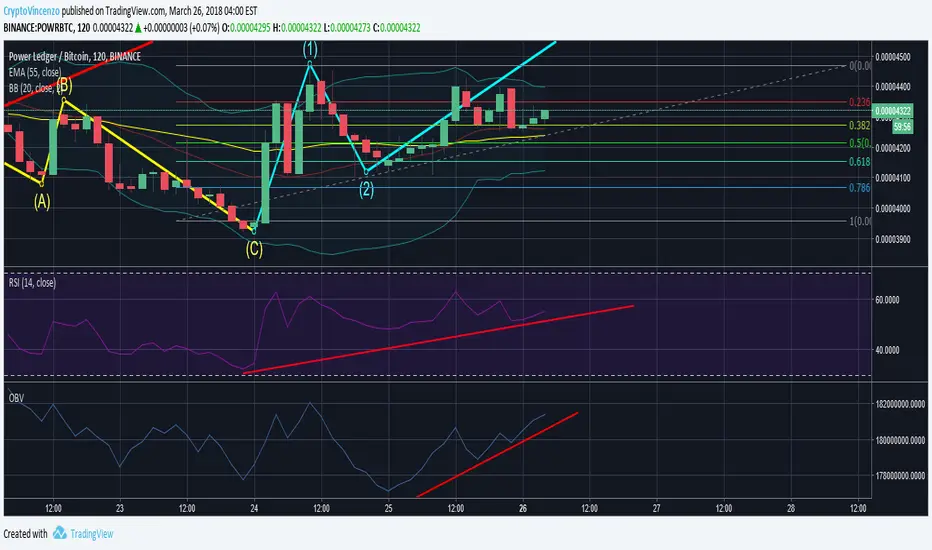
POWR May be Getting Ready to Go!POWR had a pretty big retracement after the first wave. RSI is making higher highs and the OBV is also turning bullish. Bollinger Bands are also squeezing down meaning we should break out soon. I entered around 4200 sats.
LTC Fibonnacci Trend Analysis Dear all, for context please note that you are looking at a chart which uses candlesticks in the 4-hour time frame whose whole scope is roughly 2 months. We can see from the most current bullish trend which started on Feb. 6 and continued until Feb. 20 that Fibonnacci support and resistance levels are highly effective in identifying price movement and potential buy/ sell levels in the short term as they have acted as support/ resistance nearly 5 times in 11 days. Another consistent trend we have seen is a failure for LTC to break above the 50 day simple moving average.
At the time of writing we are hovering around the .618 Fibonnacci level and I will be entering a tight sell stop here. Though volume has been moderately encouraging in the latest price increase it is not sufficient for me to be bullish thus I am neutral. A break above the 50 day SMA will be a catalyst for bullishness in my opinion. Without a break above 50 MA I envision a continous decline within the shaded price channel with the low 100s a possibility at which I will be an aggressive buyer.
