Fibretracement

Gbpjpy short + entry pointGbpjpy short + entry point
Supplyanddemand
Elliotwaveanalysics
Wychoff
All are involve
First TP is 2RR
Second TP is open.

Btcusd long entry pointBtcusd long entry point
Elliotwaveanalysics
Supplyanddemand
Fibretracement
Wychoff
All are involve
First tp is 2rr
Second tp is open .
Manage with your own risk.


NZDUSD - LONGHH HL formation and breakout at FIB 0 Level (0.69238) showing strong significance of bullish trend

GBPJPY BuyGBPJPY buy from around 155, 3rd bounce off the trend line, 38% fib level, 155 psychological level, previous high

BTC has a lot of energy in the 4H interval.Hello everyone,
The price is constantly moving under the downward trend line.
Please note that the price is currently close to the support at $ 37,955, if the support is broken, the next we have at $ 35,789 and $ 33031, then we already have a support zone from $ 31,272 to $ 28,798.
Now let's move on to the determination of the resistance line and as you can see the first resistance is at $ 40,418, the next one at $ 42,584 and $ 44,948 at the so-called FIB gold point of 0.618.
Looking at the CHOP indicator, we can see that in the 4-hour interval we have a lot of energy for the next move and on the MACD indicator we can see that the blue line is close to the red line crossing from below, which may result in an uptrend.

ADA gains energy in the 4H interval.Hello everyone.
Let's take a look at the ADA to USDT chart on the 4H time frame.
Note the blue line that marks the downtrend, as you can see the price is moving underneath it.
Now let's move on to determining the support line that the price should encounter in the event of a further correction and you can see that the first support is at the price of $ 0.85, if the support does not maintain the price, the next one is at the price of $ 0.80 and the next support at $ 0.75.
Looking the other way, it is worth drawing resistance lines that the price must overcome if the price starts to rise, the first resistance will appear at $ 0.945, and the next resistance at $ 1.006 and $ 1.065.
On the CHOP indicator you can see that in the 4H interval we gain more and more energy that can be used for the next move.

SOL goes above the downtrend lines.Hello everyone,
Let's look at the SOL / USDT chart on the 1D interval.
Let's start by determining the downtrend line that the price has currently overcome.
We see that the first support is at $ 99.84, and if we don't keep the price, the next support is at $ 94.60 and $ 90.81.
Looking the other way, it is worth determining the resistance that the price must overcome in order to rise and we see that the first of them is at the price of $ 104.44, when we break it, the next one is at $ 111.57 and $ 121.41.
It is worth paying attention to the CHOP indicator, which indicates that we have a lot of energy for the next moves, it is worth being careful, while the MACD indicator shows a blue line over the red one, which may confirm an uptrend.

The DOT price crossed the downward trend line.Hello everyone, let's take a look at the DOT to USDT chart on the 1D Interval.
Let's start by marking the downtrend line as you can see that the price has broken it.
Now let's move on to the support line, which is visible at $ 17.43 and $ 15.75, while another is already in the support area from $ 11.36 to $ 8.07.
Looking the other way around, it makes sense to plot the closest resistance points to price, the first of which is $ 18.66 and the next $ 19.70.
However, the large resistances that we have to overcome are at the prices of $ 23.8, $ 29.90, $ 34.63 and $ 39.47 = FIB 0.618 so-called. bad point.
It is worth paying attention to the CHOP indicator, which shows that the energy slowly begins to bounce back with an interval of 1 day.

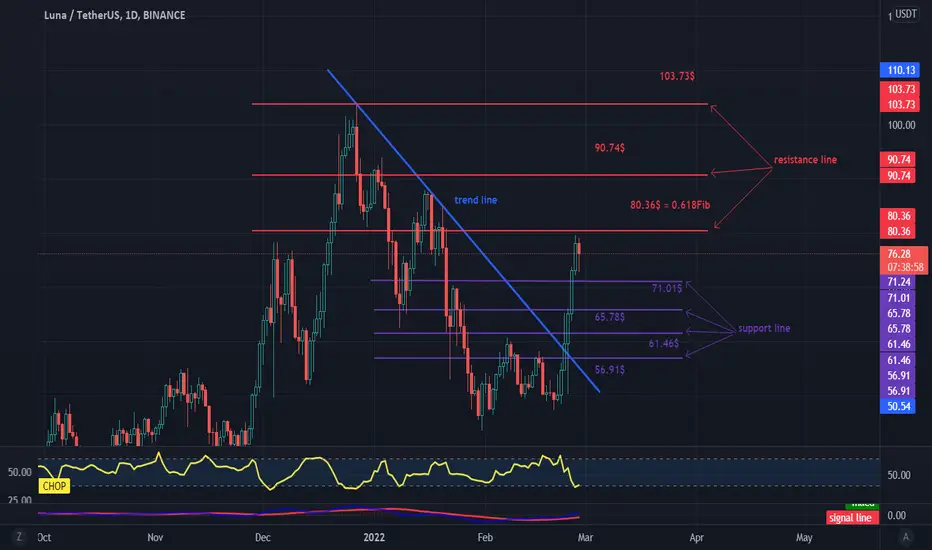
LUNA's price has risen after the recent corrections.Hello everyone
Let's take a look at the LUNA / USDT chart on the 1D interval.
Let's start with determining the downtrend line which, as you can see, managed to break and the valuation shot up.
It is worth appointing a new support that has formed at the price of $ 71.01 and another one at $ 65.78, $ 61.46, $ 56.91.
Now let's move on to determining the resistance that the price has to overcome, we see that the first resistance is at $ 80.36 = 0.618Fib, the so-called golden point from which the price has rebounded once, another moama resistance at $ 90.74 and $ 103.73.
We will look at the CHOP and MACD indicators. The first indicates that we are slowly regaining our energy and the second is a continuation of the upward trend.
ETH rebounded after the last correction.Hello everyone, let's take a look at the ETH to USDT 1 day chart.
Let's start by marking the downtrend line, because you can see that the price is moving below it and getting closer to it.
Now let's move on to the support line, as you can see, the first support is around $ 2,717, above which the price is currently hitting, the next support is $ 2,584 and $ 2,394.
We are between the support and the first resistance at $ 2,792, another resistance at $ 0.618Fib at $ 2907, and another resistance at $ 3,074.
It is worth paying attention to the CHOP indicator, which shows that the energy in the 1-day interval has not touched the bottom and is slowly starting to turn back.

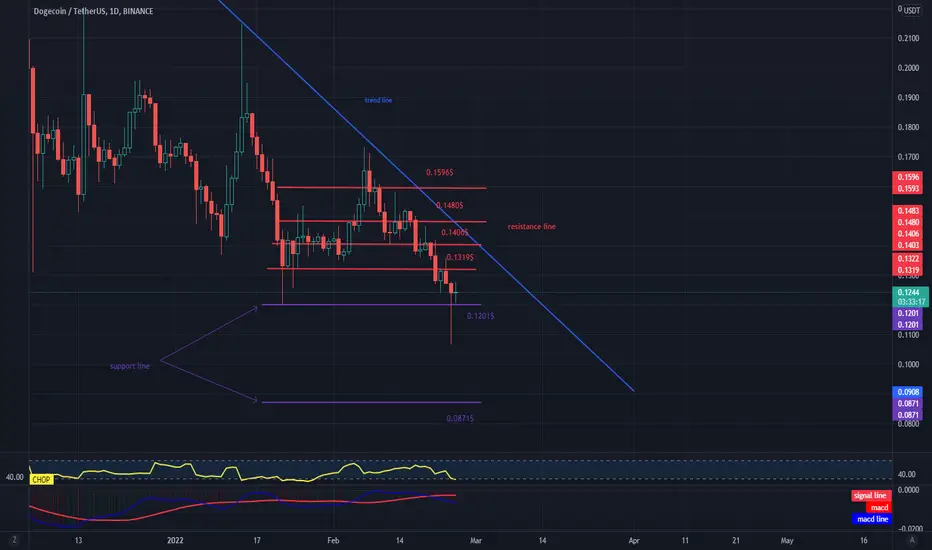
DOGE has lost energy in the 1D intervalGood morning
Let's take a look at the DOGE / USDT chart on the 1D interval.
Let's start with marking the downtrend line because you can see that the price is still moving under this line.
The price went below the first support at $ 0.1201 and came back over support very quickly. The next support is at $ 0.0871.
It is worth setting a few of the closest resistances that we have to overcome before larger increases, the first of them is at the price of $ 0.1319 and the next ones at $ 0.1406, $ 0.1480, $ 0.1596.
As can be seen in the CHOP indicator, the energy for bigger moves has been used and the MACD indicator confirms the downward trend.
Can TRX use energy for growth?Hello everyone, let's do the 1D TRX / USDT review.
As you can see, the price is below the downtrend line.
Let's set the two closest supports which are at the levels: $ 0.05564 and $ 0.05132.
while looking the other way, we can establish several resistance lines that the TRX will have to overcome on its way. The first resistance is at $ 0.07038 and the next resistance is at $ 0.08188 and $ 0.09087.
It is worth noting that on the CHOP indicator we regain energy again and there is quite a lot of it.

Will SOL defend support?Hi everyone,
Let's take a look at the SOL / USDT chart on the 1D interval.
Let's start by determining the downtrend line under which the price moves.
Let's move on to the designation of support for the coming days, you can see that the first support is at the price of $ 80.55 and the next ones around $ 54.99.
Looking the other way, it is worth determining the closest resistances that SOL will have to overcome with price increases. We have the first resistance at $ 98.48 and another resistance at $ 110.5, $ 118.83.
It is worth looking at the CHOP indicator which shows that in the 1D interval there is a shortage of energy for the next move, and on the MACD indicator we see the blue line over the red one, thanks to which we can count on keeping the price

BTC makes another correction.Hello everyone,
Let's take a look at the BTC to USDT 1 day chart.
Let's start by determining the downtrend line at which the price is currently moving.
Currently, the price is just above the support at $ 37,874 if we do not defend this level, the next support is at $ 35,634 and $ 32,810, the next support is the fundamental support zone between $ 31,272 and $ 28,798.
However, if the correction is complete, we can determine the first resistance at $ 40,210 and the next resistance at $ 42,547 and $ 44,884.
The CHOP indicator also shows a decrease in energy, but it has not been completely exhausted.

SHIBA / USDT below the downward trend line.Hello everyone,
Please take a look at the SHIB / USDT chart on the 1D interval.
We see that the price is just below the downtrend line and we are approaching the exit from the triangle.
It is worth paying attention to the CHOP indicator which shows an increase in energy for the upcoming moves. And the MACD indicator where the blue line is still above the red one, which may confirm the continuation of the local uptrend.
Let's move on to determining the support points for the price, as you can see the first support is at $ 0.00002623, and the next support at $ 0.00002409, $ 0.00002085.
Looking the other way, we have marked the points of resistance that the price will most likely meet on its way before the increases. The first resistance occurs at $ 0.00002901, the second at $ 0.00003031, and the third at $ 0.00003114.

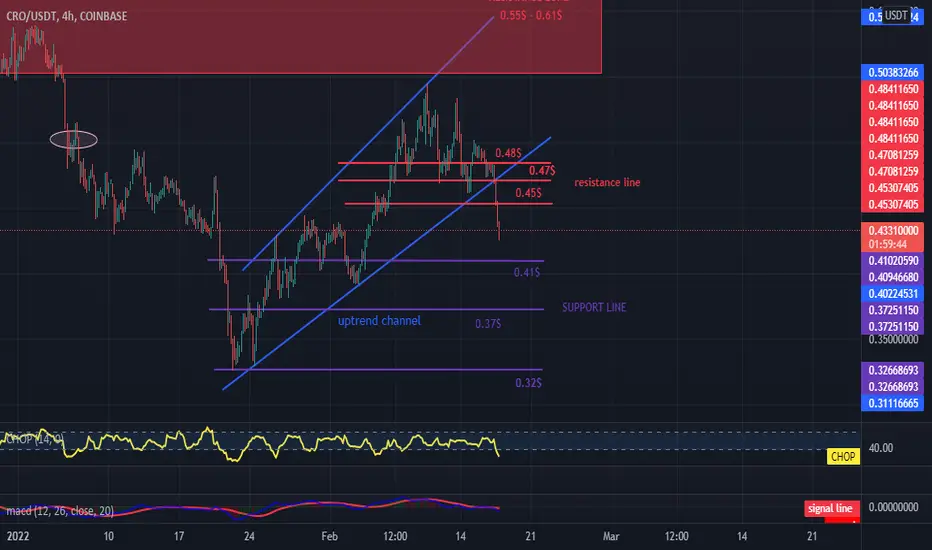
The CRO reacts similarly to the entire market with a small correHello everyone,
Let's take a look at the 4H CRO / USDT charts.
The local uptrend line is worth paying attention to as the price has dropped below this line. After today's declines, the support moved to around $ 0.41, and when we break it, we can mark the next support at $ 0.37 and $ 0.32.
On the other hand, it is worth looking at the resistance points that we may encounter in the near future if the price turns back. The first resistance will appear at $ 0.45 while the next we have at $ 0.47 and $ 0.48
The CHOP indicator also shows that the collected energy was used for today's decline and has now been exhausted in the 4H range.
DOGE rebounded from the downtrend lineHi,
Unfortunately, we got to the point where the price often reacted strongly and just above the downtrend where the price turned down.
Currently, the price remains above the support at the level of $ 0.1427, if it is broken, the next support is at the price of $ 0.1344.
On the other hand, looking in the other direction, we have 3 resistances in front of us at prices: $ 0.1492, $ 0.1536, $ 0.1574.

LUNA a lot of energy on the CHOP indicatorHi,
Please take a look at the LUNA / USDT chart in the 4H interval.
The LUNA price is still below the downtrend line.
The first support is at the price of $ 52, at which the price has already bounced up several times, while if we do not maintain the current support, the next one is at $ 50.18.
Note that the current resistance is at $ 53.95 and the next resistance is $ 57.08 and $ 60.41.
We can also notice on the CHOP indicator that we have a lot of energy for 4 hours that can be used in the near future and it is worth observing which side it will be used in.

1INCHUSDT - local uptrend channel.Looking at the 1INCH / USDT price chart, we can see that the price is moving in the local uptrend channel.
The current support is at $ 1.85, while the second support is at $ 1.77.
However, the first resistance should be encountered at $ 1.93 and the next resistance at $ 2.07

Will the collected energy lead to increases in XRP?Hi, let's take a look at the forgotten XRP to USDT. As you can see, the last retest resulted in increases and an exit from the local downtrend. However, we still have the downtrend lines in front of us.
We have the current support at $ 0.83 and another at $ 0.77.
Looking towards the resistance, we see that the price is moving between 0.618 and 0.786 Fib retracement. The resistance that awaits us now is at $ 0.92 and another $ 1.02.
We can also notice an increase in energy in the 4H interval on the CHOP indicator, this increase may result in more movement, but we should observe which direction we take.

DOGE ahead of an important resistance at 0.618 FibLooking at the DOGE / USDT chart, we can see that we have touched the downtrend line and the price has dropped slightly. Currently, the price is struggling in the place on which it was based several times.
The current support is at the price of $ 0.1610 kelejne: $ 0.1530, $ 0.1464, $ 0.1402.
On the other hand, the places where the price may encounter resistance are: important resistance at the so-called Fibo 0.618 gold point and the price of $ 0.1789, and the next one at the price of $ 0.1948
