Fibretracement
bottomed outwalmart seems pretty bottomed out here.
the feds suing walmart over the opioid crisis caused an overreacted sell off. still looking like a good time to add. i am in 160c 3/19/21.

still bullish... as ugly as the the intraday charts have looked the past 2 weeks, the weekly looks like it's bouncing off the cloud.
would like to see this above ATH for a move higher.


had a nice move today, hourly chart bull flag -- to move highersee fib levels.
*remember we are in the middle of filling a gap.
~the trend is your friend~

symmetrical triangle, clear skies above $87looking for a fib retracement back to all time highs then a push past $86.14 will confirm new ATH. hope towe can see a higher move.
other bullish indicators include macd buy signal and declining volume.
ultimately looking for $92.56.
this a fun one to trade.


ww above $170fib levels show me 169.80 --> 204.45
see bullish macd signal incoming
see volume profile above 170 is all clear

falling wedge, finding bottoma breakout from the falling wedge and i'm bullish for retrace back to 100%

triple bottom? oversold on daily.potential triple bottom forming. looks to be bottomed out with buyers back in this range.
a retrace to 100% fib level would be ideal. watching closely for a clearer picture.

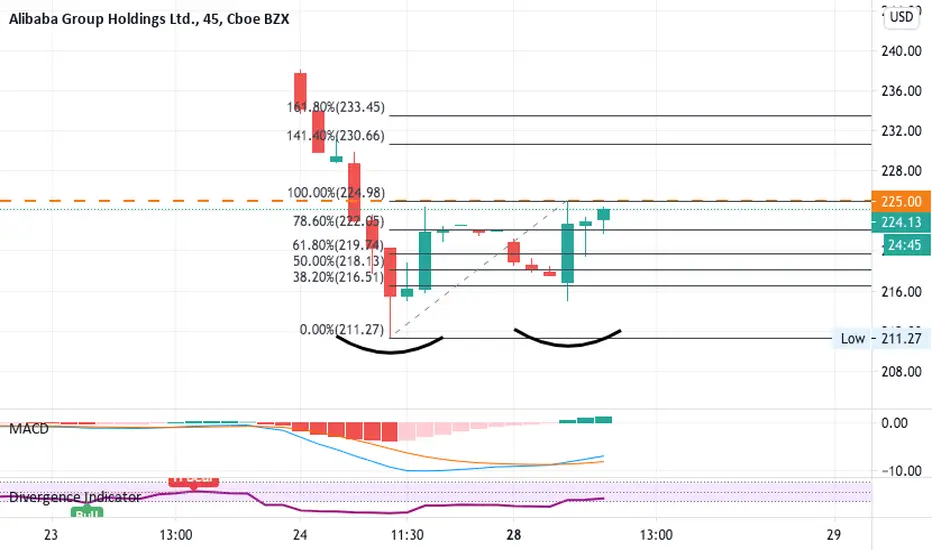
consolidating descending triangle, target 1 is $231.81+no entry for me. just an idea. with a nice bullish trend . i will be watching.


all clear after $254see visible range with little volume dying down.
a retrace off the 78.6% fib back to 100%. after pushing past 100%, it's ~party time~

waiting on 161.8% fib levels ($156.52), rising wedge forming??watching for rejecting at 161.8% fib rejection when we get there.
see declining volume as a bullish signal as well.

XRP/USDT 3h (Binance Fut) Symmetrical triangle breakout & retestRipple looks bullish again, 100EMA seems to be supporting the uptrend, let's give it another try.
Current Price= 0.6177
Buy Entry= 0.6048 - 0.5568
Take Profit= 0.6978 | 0.7837 | 0.9083
Stop Loss= 0.4970
Risk/Reward= 1:1.4 | 1:2.46 | 1:3.91
Expected Profit= +20.14% | +34.93% | +856.39%
Possible Loss= -14.43%
Fib. Retracement= 0.786 | 1 | 1.272
Margin Leverage= 1x
Estimated Gain-time= 240h

$MATIC/USDT 6h (Binance Fut.) Symmetrical triangle near breakout#MaticNetwork could revisit one last time the 100EMA and triangle support then resuming the uptrend.
Current Price= 0.01921
Buy Entry= 0.01902 - 0.01842
Take Profit= 0.02052 | 0.02229 | 0.02394
Stop Loss= 0.01692
Risk/Reward= 1:1 | 1:1.98 | 1:2.9
Expected Profit= +9.62% | +19.07% | +27.88%
Possible Loss= -9.62%
Fib. Retracement= 0.786 | 1.414 | 2
Margin Leverage= 1x
Estimated Gain-time= 360h

$MKR/USDT 8h (Binance Futures) Ascending triangle on support#Maker DAO is looking ready for a big move up like his little brother Compound already did.
On lower Time Frame we can see an ascending channel forming as well, this could lead the way up if doesn't pull-back more.
Current Price= 544.91
Buy Entry= 544.80 - 534.00
Take Profit= 561.69 | 586.21 | 617.15
Stop Loss= 517.11
Risk/Reward= 1:1 | 1:2.68 | 1:4.21
Expected Profit= +8.26% | +17.36% | +28.82%
Possible Loss= -8.26%
Fib. Retracement= 0.382 | 0.786 | 1.272
Margin Leverage= 2x
Estimated Gain-time= 720h

XRP TURNING BEARISH! BEWAREBITFINEX:XRPUSD
XRP has seen a great bullish run as of recently. We are now beginning to enter a pullback before the next bull cycle.
We see this with the 3 indicators on the graph.
EMA50 has crossed over EMA20 which we now know (from my previous ideas) is a bearish indicator.
Also, the auto fib retracement is at the 0.618 level. As XRP is trending downwards we can expect this to push below the 1.0 line (and maybe further).
Anticipate a short bearish period but be ready to re-enter. I will update this idea as XRP turns bullish.
This is not financial advice! Please trade at your own risk.

YFI/USDT 2h (Binance Fut.) Descending channel breakout & retestYearn.Finance seems to be preparing for bullish continuation, next big move should be soon!
Parallel channel broke out and is being retesting, also 200MA is acting as support.
Current Price= 23214.3
Buy Entry= 23351.2 - 21851.2
Take Profit= 26924.9 | 34272.0 | 40698.1
Stop Loss= 18983.5
Risk/Reward= 1:1.2 | 1:3.23 | 1:5
Expected Profit= +19.13% | +51.64% | +80.07%
Possible Loss= -16.01%
Fib. Retracement= 0.786 | 1.272 | 1.618
Margin Leverage= 1x
Estimated Gain-time= 240h

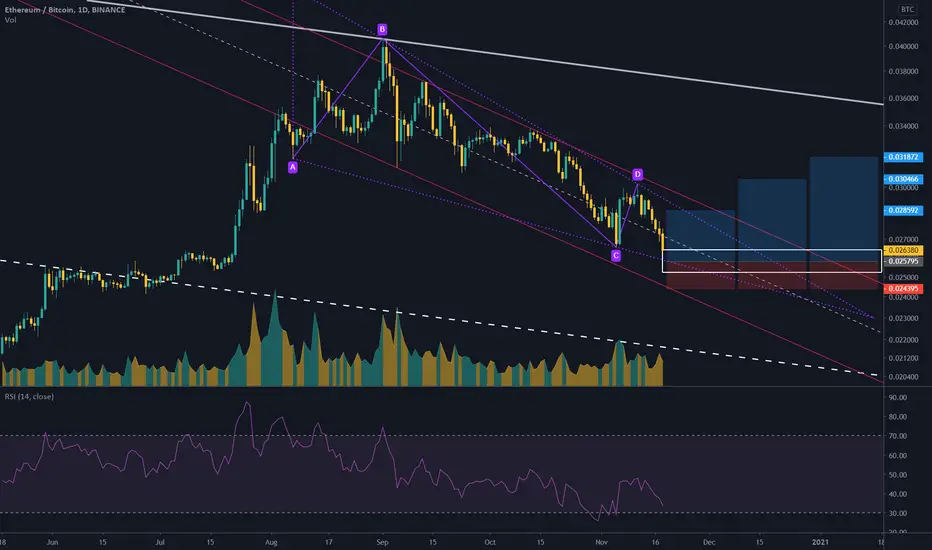
ETH/BTC 1D (Binance Spot) Falling wedge on supportWe are all waiting on Ethereum to make a move starting the AltSeason, so let's give it a try on that demand zone.
Current Price= 0.026380
Buy Entry= 0.026405 - 0.025185
Take Profit= 0.028592 | 0.030466 | 0.031872
Stop Loss= 0.024395
Risk/Reward= 1:2 | 1:3.34 | 1:4.34
Expected Profit= +10.84% | +18.11% | +23.56%
Possible Loss= -5.43%
Fib. Retracement= 0.382 | 0.618 | 0.786
Margin Leverage= 1x
Estimated Gain-time= 1440h
GBPUSD short term buy incomingSlightly different set up to my usual way of trading but this looks to be a nice short-term buy to get into. I normally prefer a higher timeframe trade on the 4hr and daily chart as it shows a much bigger picture of how price is doing.
However, on the 1hr we can clearly see this is currently a bullish run up. We have broken a nice level of rejection and now price has pulled back allowing us to add in a fib. You can see the 50% fib lines up almost perfectly with this rejection level giving us a good indication that price should react off this level and continue it's run.
If you have any questions, drop me a message.

ADA/USDT 2h (Binance Futures) Descending triangle near breakoutCardano is getting ready for the next big move, I expect it will be upwards as long as 200MA is holding the trend!
The chart is showing Spot pair, but we will trade it with low leverage in Futures market.
Current Price= 0.10302
Buy Entry= 0.10310 - 0.10106
Take Profit= 0.10756 | 0.11299 | 0.11842
Stop Loss= 0.09664
Risk/Reward= 1:1 | 1:2 | 1:3
Expected Profit= +10.66% | +21.28% | +31.92%
Possible Loss= -10.66%
Fib. Retracement= 0.618 | 1 | 1.272
Margin Leverage= 2x
Estimated Gain-time= 240h

BTCUSD 30 min support resistanceThese are support resistance from both current and legacy data.
The fib retracement is based on the all time high, and the bottom at around 3000
