TWTR fibretracement entryTWTR
Fibretracement for 27.50 or 22.50 entry.
Watch for longbuylongsell and 1w chart here, change to 1d/4h for best entry with CCI and MACD (volume)
Fibretracement
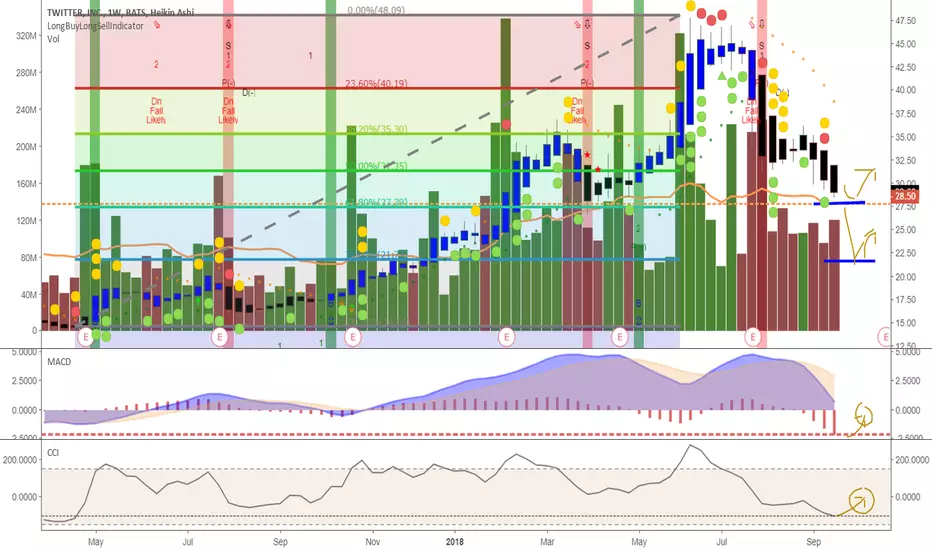
Resistance and volume drop expectedALOT is showing a resistance in supply/demand in buyers with more selling on 4h chart.
Fibretracement 0.786 would drop to $20.75-20.80 or more likely $19.20-19.35 resistance zone areas as better
buy.
Watch the black change to blue on 4h or 1d chart for entrance, which is currently black. @MarxBabu for longbuylongsell chart adding MACD, volume, volume average and running average and here RSI Stoichastics. Optionally replace RSI Stoich with CCI for entry timing once blue, or RSI, or fast RSI.
View 1w, 1d and 4h for blue entry signal.

CCJ - NYSE CCO - TSX Powering the grid Cameco Corp. Mining Uranium stock likely recovers in breakout of FIB retracements 0.5 (recent down) and 0.382 (recent up) and near 9.81 or drop below 9.50 to 8.95-9.25 resistance.
Point of interest:
* Uranium prices beaten down since 2011 Fukashima Reactor melt-down and back-up generator cooling failures from psunami hitting Japan.
* Japan shuts down all of the 32 Nuclear Reactors to assure public safety and clean-up causing global Uranium (Ur) prices to tumble to where it now is.
* Nuclear energy is still a paid for and quite reliable energy source with proper safety measures, which Japan now has and plans to restart.
* No. Amer. power also relies on nuclear power, which Pres. Trump will not import from other countries supporting demand.
* This is one of several plays, which is safe haven mid to large-cap mining stock and away from volatility (VIX) moneyballers like, as VIX up near 5% each of last 2 days.
Viewers come to own conclusions. Like, share, comment.


Short Position Confirmation Signal on 1H XBTUSD, BitMEXThe Market is testing for third time a major resistance level and gives us a sell signal for my previous idea on the same pair, daily chart. We have Major Structure Level on a HTF and TTF as well, RSI Divergence, Triple Top and we are on Overall bearish trend based on 1D,4h HTF. I think I'll jump in , wish me luck ! :D

BTC/USD LONGI see descending broadening wedge on BTC and it might be forming the partial decline which would trigger a long position
We have to wait for reversal candle in the buy zone
TP as mentioned in the graph

VET Bull FlagVET has just come off the rebranding of VEN on it's own blockchain. Binance announce news of a 100 million VTHO airdrop for VET holders on August first. As a result, a bull flag has formed. The pole is roughly 70 sats in length so on a break out, 400-410 sats is possible. I would set my buys at the 50% retracement of the run and a stop loss a little past the 61.8% retracement if the pattern fails.

BCH/USDBCH is currently forming a rising wedge
Our short will be triggered once the support trend breaks and the rising wedge is in play

Buy EURJPYJust waiting that the price test the level 61.8% of the Fib Retracement, in order to go long limit and achieve level 78.6%.

Setup Leg Fading Short Setup USOIL extended its setup leg 128% and is now seemingly ready for a reaction leg towards the 38.2% retracement point of the setup leg. Today is an event day, volatility is expected to pick up, however selling 128% extension with stops above the high of the setup leg and looking for a 38.2% reaction seems reasonable.

Where are we in the correction? BTC 28 JUN UPDATETL;DR
I am expecting a slight pump (motive) wave inside the correction that we are in right now.
(see 'c' to 'd' purple line).
This MAJOR correction started when BTC fell from 10k and it *COULD* end at $4.7-5k over the next coming weeks. But we shall talk about this point when we reach it.
Right now, we are in a 3rd subwave of correction which should be followed by a 4th motive wave of rising prices.
But first, I'd like it to hit $5.5-5.8k so it would finish the current "mini" wave of correction.
At $5.6k it would also hit the 0.236 Fibonacci Retracement which means it should've expanded it's downwards energy.
At the moment RSI & MACD don't tell me too much - they look neutral at the moment, even on short candles like 2h. I'd rather wait and see what happens next.
StochRSI says "oversold" - but this is just one indicator out of many, and the rest are not so positive.
BTC price struggles to breach MA(100) on 2h candles in the last few days - i will not that put that on the chart because it will look even more heavy.
I'll be waiting at that $5500-5800 level for an entry
OR
Having a buy-stop at 6200 ish and expecting to sell it fast or with a trailing stop loss.
Also, I'm watching that resistance at 50 RSI for any signs of breaking towards bull territory.
If you like this chart & analysis, please make sure to upvote - It really helps.

ETH Correction Wave C and Fib LevelsHere we have a possible Elliott Wave count on the 4h chart where ETH is currently in the C wave of an ongoing ABC correction. ETH going above the swing high from wave 5 (830 level) or the even 725 level might confirm the end of the correction and the start of a new impulse wave.
Fib extension levels of wave A are shown by the dark orange levels. Fib retracement levels of the green impulse wave are shown on the right.
Both the fib arcs and fib spiral are taken from the low to the high of the impulse wave. The scale has been locked at a ratio of 2.
Please note that the positions of the uncompleted waves are arbitrary and should not be taken as price targets.

Gold Pullback Trend Continuation ShortGold is moving towards 1295, the 0.618 retracement of recent gap and .236 fib extension resistance of previous bear leg. The established trend remains bearish and lower lows and lower highs are evident on 240 graph. Higher TFs show that there is a potential for support as continuation of bigger bullish move on weekly might attract demand so staying alert for a serious bull move is recommended. For now, limit sell orders around 1295 with $7.5 stops (ATR*1.8) and 2R-3R target stop buy around 1275 seems to be the reasonable course.


MTL Metal Long Idea - Ready to take off OR...delayed a bitBuyers beware !!!!
5000-5400 satoshi range seems like a decent enough entry. As close to 5000 as you can get - the better.
But those volume spikes keep me guarded against this one. It seems very risky. I would recommend watching this trade throughout its journey or with a good stop/loss in place.
Read on for more details:
MTL -1.79% looks like it is ready to show some muscles.
The zigzag lines are drawn based on fib retracement levels & fib circle "encapsulation".
* GREEN - very positive outcome
** YELLOW & ORANGE - uncertain, but more likely outcomes.
**** RED - very "negative" outcome. -> as in we might be delaying this takeoff for a while longer.
*****
BLUE - Possible *LONG* EW Count.
*****
RSI looks like it is steadily heading into bull territory.
if StochRSI bounces off 25 levels again, it is a very good sign.
Volume has been steadily increasing in the last days/weeks....BUT
BUT!
Look at those random spikes in volume!
If someone is not trying to keep the price afloat, then I'll eat my hat.
If you like this analysis, a "like" is always appreciated & helpful.
For more charts, feel free to follow me on tradingview.
Kudos to tradingview user @Knguyen5 for spotting this one early !

USD/CHF projected price pathThis just seems how all the fibs are measuring out wave wise. Watch that 99000 level.

GBPJPY LONG POSITION AFTER 23% LEVEL TESTGBPJPY Long structure setup coming off of a Elliot Wave. A brief dive to 141.100 level before a retracement to 38% then 50% level on the 1 week chart. Nothing out of the ordinary. Buy on GBPJPY.

GBPCHF ELLIOT WAVE AND LONG RETRACEMENT TOWARD DAILY 61% LEVELGBPCHF is coming off of an Elliot Wave and consolidating with slow upward trend toward the 61% level just passing the 50% level. Long term 23% levels will be attained on the monthly chart within the next year or two. Buy market execution on the GBPCHF.

GBPUAUD CLASSIC SETUP FOR LONG TOWARDS 50% DAILLY FIB LEVELThe GBPAUD chart is in a classic long structure with tested levels and currently consolidating at the 38% daily level. 50% level should be reached in the upcoming months when the RSI has reached oversold levels. Buy towards the 50% daily level shown.

EURAUD TESTED A PREVIOUS RESISTANCE AND FAILED TOWARD SHORT 61% EUDAUD has broken its upward trend which is a complete 100% retrace from the 2015 plunge. After the previous test on the 50% weekly fib retracement level and fail it is now headed back toward a downward trend a "long" short toward the daily 61% level and beyond. A sell is seen here.

CADJPY LONG POSITION TOWARD 50% THEN 61% FIB LEVELSThe CADJPY is another pair that is telling on the monthly, weekly and daily charts. The emphasis here is on the daily chart just passing the 38% fib level and now towards the 50% then onto the 61% levels as stated above. Buy all the way.

AUDNZD LONG POSITION w/ CONSOLIDATION @ MAJOR FIB LEVELS (below)The Kiwi has always been a volatile currency but loyal at the same time. Several fib retracment charts were plotted to see the exact position and movement. On the month chart the AUDNZD is coming off a 3 yr downward trend to consolidate over the last 3 yrs at the 38% level. On the weekly chart the consolidation is clearly seen. But it is at the daily chart where it has tested a previous key level enough times for a reversal toward the 23%, 38%, 50%, ad ultimately toward the 61% level. Long position is recommended.

EURCHF LONG MOVE TOWARD 38.2% FIB LEVELThe EuroFranc is in a similar structure as a few of Franc pairs. A sharp dive around 2015 has created a correction upward trend toward it's previous fib levels. This pair in particular is no different, and being such a viable pair it will continue to meet those expected levels. A buy toward these areas is recommended.
