USDJPY - Is This Just A Healthy Pullback?Analysis:
Recently price has just been heading higher and higher on this pair, and we've been looking to catch this move for a while now but we needed to stay patient and wait for a pullback and that's exactly what we might have now. Price has pulled back to a key level of prior resistance and as we know, resistance often becomes support, so this is starting to look like a potential place to enter long. We're also still in an upwards trend as the most recent higher low hasn't been broken so this move to the downside is just a healthy pullback rather then a break of structure. At our area of previous resistance now turned support we also have the 61.8% fib retracement level which is often classed as the strongest fib retracement level so we'd expect that buyers would be sat at this area wanting to hold price and push it higher. On top of that we also have an upwards trendline touch, which acts as dynamic support, so we'd expect buyers to also be sat at this area wanting to hold price and push it higher. All of these technical confluences line up together and signal that this area could hold and provide bullish momentum so we like the look of this. We don't just have the technicals on our side but we also have the fundamentals too. Fundamentally the USD is the strongest major currency compared to the JPY which is the weakest major currency, so this massively goes in our favour. As of the most recent report for institutional positioning we saw the USD stay pretty bullish whereas for the JPY we saw an increase in long positions but we also saw an almost 2.5 times bigger increase in short positions compared to long positions opened. This signals that there is still more possible bearishness to come for the JPY, making it favourable to short rather then going long. With all of the technicals and fundamentals lined up together we have a very strong bias to the long side of USDJPY.
Please feel free to leave any comments you have and like this idea if you agree with us. Any feedback or comments will be read and responded to. We any comments at all so thank you!
Stay Safe - The JPI Team
Disclaimer:
This does not constitute as financial advise. We are not responsible for any monetary loss that you endure. Trading is hard to be profitable with and we take losses just like everyone else does too. Our ideas won't always be correct which is why we urge you to always do your own analysis first before entering into the market but please feel free to use our analysis to assist you with yours.
Fibretracement

#NEXO/BTC 2D (#Binance) Broadening wedge breakout and retestNexo is pulling back to previous support where we expect it to bounce towards 100EMA resistance.
⚡️⚡️ #NEXO/BTC ⚡️⚡️
Exchanges: Binance
Signal Type: Regular (Long)
Amount: 8.4%
Current Price:
0.00002340
Entry Targets:
1) 0.00002262
Take-Profit Targets:
1) 0.00002798
Stop Targets:
1) 0.00001994
Published By: @Zblaba
$NEXO #NEXOBTC #Nexo #CEx #Payment
Risk/Reward= 1:2
Expected Profit= +23.7%
Possible Loss= -11.8%
Estimated Gaintime= 2 months
nexo.com

LTCUSDTLTCUSDT is respecting well the inclining trendline and currently trading at 60% fib retracement level. Will the price bounce from this demand zone.

#BTC/USDT 4h (ByBit) Head and Shoulders near breakdownBitcoin could retrace down to 100EMA support after a last liquidity grab towards right shoulder.
⚡️⚡️ #BTC/USDT ⚡️⚡️
Exchanges: ByBit USDT
Signal Type: Regular (Short)
Leverage: Isolated (13.2X)
Amount: 5.0%
Current Price:
30223.7
Entry Targets:
1) 30553.4
Take-Profit Targets:
1) 28712.5
Stop Targets:
1) 31476.1
Published By: @Zblaba
CRYPTOCAP:BTC #BTCUSDT #Bitcoin #XBT #PoW
Risk/Reward= 1:2
Expected Profit= +79.5%
Possible Loss= -39.9%
Estimated Gaintime= 5-10 days
bitcoin.org

#AGLD/USDT 4h (Bybit) Broadening channel on resistanceAdventure Gold (a.k.a. Loot) printed a shooting star and seems likely to retrace down to 100EMA support.
⚡️⚡️ #AGLD/USDT ⚡️⚡️
Exchanges: ByBit USDT
Signal Type: Regular (Short)
Leverage: Isolated (5.2X)
Amount: 5.0%
Current Price:
0.5250
Entry Targets:
1) 0.5483
Take-Profit Targets:
1) 0.4645
Stop Targets:
1) 0.5903
Published By: @Zblaba
TSXV:AGLD #AGLDUSDT #AdventureGold #Loot #NFT
Risk/Reward= 1:2
Expected Profit= +79.5%
Possible Loss= -39.8%
Estimated Gaintime= 1-2 weeks
www.lootproject.com

EURCHFEURCHF is in new uptrend, as previously it was in down trend now the trend has shifted. Currently the pair is retracing at fib golden ratio which is also the previous support. Will the pair continue its upward trajectory ?

A reverse Adam-Eve idea PLTR has risen with the earnings and AI mania. It is time for a correction for further upside. The price action has started to develop a reverse Adam-Eve pattern. RSI and OBV show some bearish divergence as well. We may see a correction to 0.236 or 0.382 fib retracement levels.
Disclaimer – WhaleGambit. Please be reminded – you alone are responsible for your trading – both gains and losses. There is a very high degree of risk involved in trading. The technical analysis , like all indicators, strategies, columns, articles and other features accessible on/though this site is for informational purposes only and should not be construed as investment advice by you. Your use of the technical analysis , as would also your use of all mentioned indicators, strategies, columns, articles and all other features, is entirely at your own risk and it is your sole responsibility to evaluate the accuracy, completeness and usefulness (including suitability) of the information. You should assess the risk of any trade with your financial adviser and make your own independent decision(s) regarding any tradable products which may be the subject matter of the technical analysis or any of the said indicators, strategies, columns, articles and all other features.

CHZUSDTCHZUSDT is trading in bearish channel and respecting the falling trendline with Fib confluence. Currently the pair is consolidating and meanwhile preparing for 3rd pivot to falling trendline. Will it respect the falling trendline and continue its trajectory to even more downside?

CHFJPYBearish move is expected near the resistance. After the drop down pair completes its 61% fib retracement.

GOLD (XAUUSD) - Weekly forecast and analysis 🎯Welcome back! Let me know your thoughts in the comments!
** XAUUSD Analysis - Listen to video!
We recommend that you keep this pair on your watchlist and enter when the entry criteria of your strategy is met.
Please support this idea with a LIKE and COMMENT if you find it useful and Click "Follow" on our profile if you'd like these trade ideas delivered straight to your email in the future.
Thanks for your continued support!

IRISUSDTIRISUSDT is in bullish momentum and currently trading at strong area of value which is also the 50% fib level. Will it continue its trajectory from this level?

EURJPYEURJPY is in strong bullish trend and seems like it is going to form AB=CD pattern.
As BC leg retraced to 50% fib level and reacted well also because of strong area of value.
Will it complete CD leg ?

AUDUSDAUDUSD recently broke through strong support zone and currently retesting the broken support with mild bearish flag.
Will it continue to sell side?

VGXUSDTVGXUSDT broke through range with strong bullish momentum and retraced back to very important Fib level.
Will it continue its bullish behavior from current level?

RAREUSDTRAREUSDT broke through range with strong bullish momentum and retraced back to very important Fib level.
Will it continue its bullish behavior from current level?

Daily ETH 1DChart - resistance and supportHello everyone, I invite you to review the chart of ETH in pair to USDT, we will focus on the one-day timeframe.
We will start by marking the second trend line, from which, as you can see, the price went up, then it is worth defining the main trend, which has not been touched so far, currently, for ETH to beat the main trend, the price would have to exceed around $ 2700.
At this point, we will also check what the EMA Cross 50 and 200 indicate, as you can see after a long-lasting downward trend, we have a visible confirmation of the return to the uptrend and despite the current correction, nothing changes.
Next, we will define with the blue lines, the uptrend channel in which the price is moving from the last low.
Now let's move on to checking where the price should meet support in the event of a continuation of the current correction. And here we can first mark the strong support zone from $ 1848 to $ 1673, but if the price falls below the next support we have at $ 1520 levels, third at $ 1366 and then fourth at $ 1154.
Now, in the same way, using the Fib Retracement tool, we will check the places of resistance for the price if the situation reversed and the price started to rise. In the same way, in the first place, we can mark a very strong resistance zone from $ 1916 to $ 2224, which, as of now, the price has not had the strength to overcome, but when it succeeds, we will be able to observe an attack on the resistance at $ 2543, and then a third resistance at the price of $ 2991, and the fourth resistance at $ 3573.
Please note the CHOP Index, which indicates that the energy is starting to gain strength after it has been used to correct the price, the MACD indicates the transition to a downtrend. On the other hand, on the RSI, despite the fact that we see a rebound, there is still room for the price to go lower, which may deepen the correction towards the previously mentioned support zone. It is worth watching whether the designated zone will keep the price.

BTC | AIM 32K! So, imagine you're a sniper, carefully eyeing your target through your scope. Suddenly, you notice something strange - the movements of your target seem to be following a pattern! You take a closer look and realize it's the Fibonacci sequence!
As any savvy sniper knows, Fibonacci retracements can be a handy tool in trading. So you whip out your Fibonacci tool (which, for the record, looks a lot like a ruler with some fancy numbers on it), and start drawing your lines.
You carefully calculate your entry and exit points, making sure to account for all the Fibonacci levels. And then, just as you're about to pull the trigger (on your trade, of course), your target moves - just like the sequence predicted!
You adjust your aim slightly, recalculating your Fibonacci levels on the fly. And then, with a steady hand and a calm mind, you take the shot.
The market reacts with a satisfying ka-ching, and you walk away with a tidy profit. As you pack up your gear and head off into the sunset, you can't help but think: "Sniping is all about precision and timing - just like trading with Fibonacci retracements!

US30 : Butterfly Harmonic PatternCURRENCYCOM:US30
As you can see , beautiful , Butterfly harmonic pattern is done
It's a bearish pattern , Market now after completion of D leg , now intent to do a 38.2 % retracement
it's a pattern with 70 % accuracy , market now in overbought position
you can take your short trades and target for 33205 area
Trade properly with risk management , don't try to overtrade or do revenge trade
Patience is key in this field , you should have steel nerves
risk reward ratio 1;2 or 1;3 is ideal in intraday trading

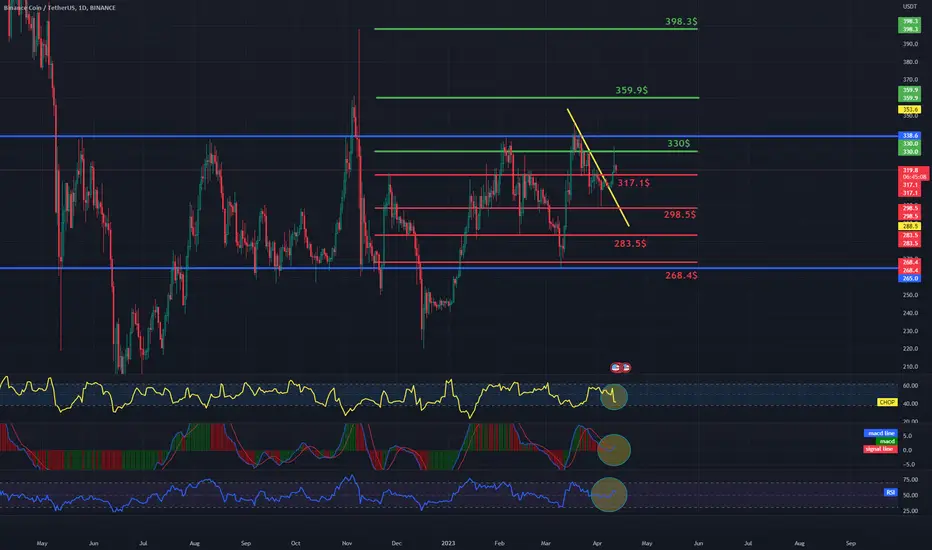
BNB/USDT 1DInterval Resistance and SupportHello everyone, I invite you to review the BNB chart in pair to USDT, also on a one-day timeframe. First of all, using the blue lines, we can mark the sideways trend channel in which we are approaching the upper limit, while locally we managed to beat the downtrend lines.
Now let's move on to marking the places of support. We will use the Fib Retracement tool to mark the supports, and as you can see we have the first support at $317.1, the second support at $298.5, the third support at $283.5 and then the fourth support at the lower border of the sideways channel at $268.4.
Looking the other way, we can also mark the places where the price should encounter resistance on the way to increases. And here we have the first very strong resistance at HKEX:330 , which is the so-called golden point of 0.618 Fib, the next resistance is at $359.9, and then the third resistance at $398.3.
The CHOP index indicates that most of the energy has been used. The MACD indicator is back in an uptrend. On the other hand, on the RSI we are moving in the upper part of the range with a small rebound visible.
$OP/USDT 12h (#Bybit) Small falling wedge breakoutOptimism looks locally bullish and could bounce back on 100EMA support, towards previously broken levels.
⚡️⚡️ #OP/USDT ⚡️⚡️
Exchanges: Binance Futures, ByBit USDT
Signal Type: Regular (Long)
Leverage: Isolated (3.0X)
Amount: 4.5%
Current Price:
2.4351
Entry Zone:
2.4351 - 2.2651
Take-Profit Targets:
1) 2.7689
2) 3.0840
3) 3.3993
Stop Targets:
1) 1.9998
Published By: @Zblaba
$OP #OPUSDT #Optimism #L2

Daily BTC 4HChart - resistance and supportHello everyone, I invite you to review the current situation on the BTC pair to USDT, taking into account the four-hour interval. First, we will use the blue lines to mark the downtrend channel from which the price went up.
Now we can move on to marking support areas in case of deepening correction. And here we have the first support at $25656, then it is worth marking the support zone from $24819 to $24164, but when we fall below this zone, we can see a drop around $23490 and even $22525.
Looking the other way, in a similar way, using the trend based fib extension tool, we can determine the places of resistance. First, we will mark resistance at $26,512, which the price failed to test positively, when we manage to break it, we have resistance at $27,349, then at $28,114 and $29,297.
At this point, it is worth looking at the EMA Cross 10 and 30, this indicator nicely shows the place that was a confirmation of entering an uptrend.
Please pay attention to the CHOP index which indicates that the energy has been used, the MACD indicator indicates the entry into a local uptrend, while on the RSI we went above the upper limit, which quickly turned the price back.

ADA/USDT 4HInterval Resistance and SupportI invite you to review the chart of ADA in pair to USDT, on a four-hour interval. First, we will use the blue lines to mark the downtrend channel from which the price has gone up.
Moving on, we can move on to highlighting the support spots, we currently see a price correction where the ADA is based on the first support at $0.32, the second support at $0.30, the third support at $0.29, and the fourth support at $0.27.
Looking the other way, we see first resistance at $0.33, then we can mark a strong resistance zone from $3.34 to $0.36, and then resistance at $0.37.
Please look at the CHOP index, which indicates that the collected energy is used for correction, but we still have a continuation of the move, MACD indicates a return to the downtrend, while the RSI has a strong rebound, which creates room for new increases.

Daily ETH 1DChart - resistance and supportHello everyone, I invite you to view the chart of ETH in pair to USDT, also on a one-day interval. First of all, using the yellow line, we can mark the downtrend line that the price has overcome upwards. At this point, it is also worth looking at the EMA Cross 10 and 30, which at this point indicate a return to an uptrend, but be careful if it turns out to be a false breakout.
Now let's move on to marking the places of support. We will use the Fib Retracement tool to mark the supports, and as you can see, we have the first support at $ 1623 which the price is currently approaching, the second support at $ 1576, the third at $ 1526 and then the fourth support at $ 1457.
Looking the other way, we can also determine resistances for the price, but here you can see that the price must break the strong resistance zone from $ 1664 to $ 1743, only when the price breaks out of this zone and then tests it positively, we will be able to observe further increases.
As we can see, the first day showed a nice increase, which indicates a growing sales volume.
The CHOP index indicates that the energy has been used. The MACD indicator indicates a return to an uptrend. On the other hand, the RSI shows a rebound after the last increase, which may give a positive breath for further increases.
