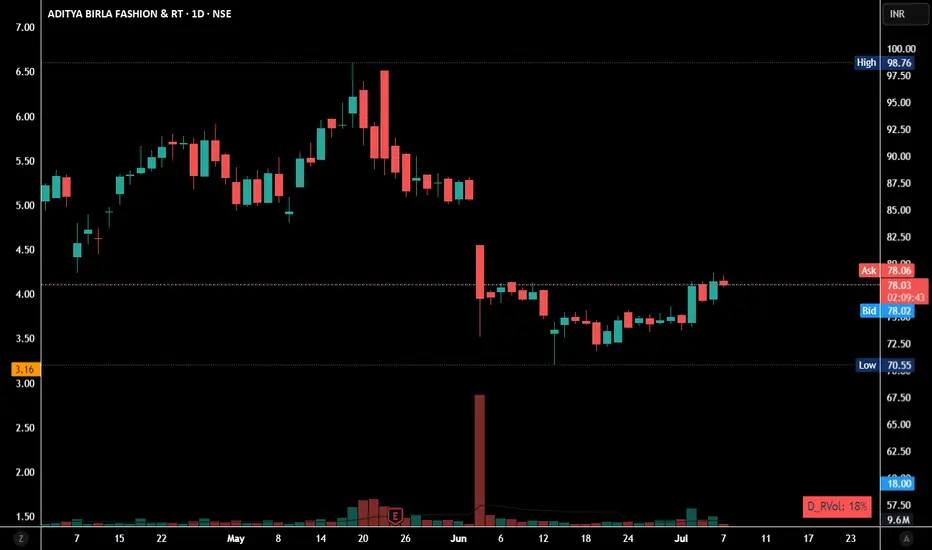
Rising Institutional Buying
Rising Institutional buying has been seen in this stock. This quarter is full of their accumulation it seems. It'll be interesting to see whether it holds 80-90 level.
Chart is for educational purpose, not a Buy/Sell Reco.
Fiiactivity
IND HOTELS SHORT!!!IND HOTELS ... FII keeps on increasing their stake at lower levels.
They have been bought this stock from August 2023- December 2023. Aggressively.
At that time stock is not outperforming, only consolidation was happening.
After the completion of their accumulation, the stock skyrocketed.
Now almost 96% return from their bought levels.
It's a trap for retail people like you and me to buy this, they happily sell by manipulating another 5-10% from here.

DIXON FOR LONG TERM INVESTMENT IDEAFalling Trend Line Breakout
Stock shows the Bullish moment on (WEEKLY)
Double bottom chart pattern on the (WEEK) that indicates a Bullish moment will continue till the 5000 level if the stock sustains above 4500 it can go further more.
Technicals
—RSI 74 (WEEKLY)
—ABOVE 20 MONTH EMA
—VOLUME ABOVE 20 MA
educational purpose only!✨
Do your research before making any investment🥂

#small cap stock ready for upward move?#smallcap stock Dharmraj crop Incorporated in 2015, manufactures and deals in pesticides including concessionaires of public health products for pest control, insecticides, herbicides, fertilizers and allied products related to research and technical formulations. its 1120 cr company with decent PE VS ROCE ratio, FII increase their stake from 5.5% in Mar'24 to 6.97% in June'24.
This week it has taken resistance from the important fib level of 349 and if next week it manages to sustain above this level then it can move up to touch 386,410,424,443(imp level). Once it will sustain above 443 I will try to trail to another important fib level of 537. Below this week's low of 290 it will become weak for the time being.
Since I am not SEBI registered please do your research before taking trade in this stock.
Please let me know your thoughts on this stock or if you want me to analyze any stock for you then please mention in the comments thanks for reading.

Decoding the Mystery Behind Dec 20 Fall - Part 88. Nifty IT -1.71%
3 Months - Upward Parallel Channel - already rejected from top few months ago and 2nd attempt to break ATH going on
Weekly - Beautiful Inv. H&S Pattern - BO is also done - Facing Rejection from 3months Resistance line around 36220 levels and coming back to Retest BO zone
Is anything wrong here ?

Decoding the Mystery Behind Dec 20 Fall - Part 77. Nifty Auto -2.28%
3 Months - Rounding Bottom BO done. Target 19752 - nothing wrong in 3 Months / Monthly scale - its going up and wick is getting formed once in a while
Weekly - as you can see at every step - there is a Horizontal Consolidation (BOX Pattern) for some weeks then BO, again BOX BO and repeat.....
When the stock / sector has a crossed ATH and goes up - there is no more resistance it push it down. But it writes its own fate by creating new Support & Resistances once again because of People's Greed & Fear. When majority thinks it has grown too much - they sell off causing a temp dip.
As you can see - there are bigger Red candles in Weekly history. Absolutely nothing wrong - and Still in the Bullish pattern - no negation of pattern anywhere. Trendline Support is also an additional support

Decoding the Mystery Behind Dec 20 Fall - Part 66. Nifty Realty -2.43%
3 Months / Monthly - Beautiful Rounding Bottom structure - BO also done already @ 3M scale
Weekly - Upward Parallel Channel Structure with a Confluence of 3 Months Resistance @ 755 acting together. Double Resistance - Double Strong Analysis and a big fall today
Its not your FII friends / Covid Virus / Christmas Santa pushing these sectors down. On a normal day when any stock / sector faces a Resistance - it is bound to Fall - that's like an Open Secret. This is exactly what happened today. So Why so much Hangama ??

Decoding the Mystery Behind the Dec 20 Fall - Part 55. Nifty Energy -2.68% fall
3Months / Monthly - After a steep rise initially - the sector has reduced the angle of growth - forming an upward parallel Channel with an Embedded Flag Pattern - BO is also done 6 months back
Weekly - Precise Rejection from the Long Term Trendline Resistance. See how beautifully it touches the top of the Green candle and cuts thru this week's Red.
Remember one thing - when each sector faces their Resistance separately the fall is smaller. But when ALL Sectors face their resistances together on same day - the Fall usually is significant. Because this is how big players Orchestrate the fall and due to this "Repeated Human Behavior" the Chart pattern becomes "Predictable and Repeatable"

Decoding the Mystery Behind Dec 20 Fall - Part 44. Nifty Mid Cap 100 -3.27%
Monthly - Upward Channel with Fib Golden Ratio 0.618 retracement - 1.618 extension Target given was 41,346. Target Met & Exceeded
Weekly - Look at 1.618 level crossing and a minor correction caused by it. See how precise Technical Analysis work. Once a target is reached usually we find a retracement after testing that level
Similar to small cap - after the BO of upward Parallel channel / wedge - the customary Retest process is initiated. Same as small cap - as of today - it's an Bearish engulfing candle - but have to wait for weekly close to see.
Irrespective of the size of candle - once a retest begins - it just happens - whether its faster or slower does not matter. next support at 41302

Decoding the Mystery Behind Dec 20 Fall - Part 33. Nifty Small Cap 100 - 3rd highest fall today - 3.63%
Monthly - Upward Parallel Channel BO + Cup & Handle BO confirmed at Monthly as of Nov
Weekly - The Customary BO Retest process in progress. Today's fall has formed a Bearish Engulfing Candle, but only by weekly close we can confirm if it is still an Engulfing Candle or a smaller one with a wick at bottom.
Folks in IT / Agile process would use the term "Definition of Done.....which says "Anything is not Done until its fully complete" - So wait for the weekly close to derive the real story

Decoding the Mystery behind Dec 20 Fall - Part 22. Nifty Metal - 2nd highest fall among Nifty Peers - 3.82%
Monthly Chart - After a 10+ years BOX pattern BO in 2021, it went higher and formed an Bullish Ascending Triangle and BO was also done
Weekly Chart - After BO the usual retest is happening. Once again - compare the previous weekly RED candles - nothing alarming today and Bullish Pattern perfectly intact
Support around 7170 to 7270 levels

Decoding the Mystery behind Dec 20 Fall - Part 11. Nifty Media - the Biggest Fall among its Peers (-5.11%) - Comparison between Monthly & Weekly Chart
Month - Beautiful Cup & Handle Pattern - BO attempted today but didn't sustain (no change in pattern)
Week - Inside the Handle - there is an Inv. H&S pattern - Look at the rejection today from BO + Resistance zone of 2500
Neither is this the Biggest Weekly fall (as per weekly chart) nor does it negate the current Bullish Pattern.
After 2-3 months when you see the weekly chart - does it really matter whether it fell 5% in 1 day or 5% in total across the entire week ? no one cares. So why so much noise ?

#APOLLOHOSP LOOKING AT GIVEN LEVEL#APOLLOHOSP... ✅▶️
Intraday as well as swing trade
All levels given in charts ...
IF good potential seen then we work in options also
if activate then possible a huge movement Keep eye on this ...
We take trade only when it activates...
Possible to give good target
TRADING FACTS

IIFL FINANCE - Long ViewIIFL FINANCE looks bullish on the weekly charts after taking multiple support and rejections on the channel.. Looks good for long at CMP
Sl below 385


NIFTY SMALL CAP, FIBONNACI with MA 100 SUPPORTnifty 50 has made a good recovery after 20th June, same followed by the nifty small cap.
check the fibonnaci levels, and there's a good support of MA 100, after 20th june.
many nifty small and mid caps have to get there bull run, so this became a point of breakout.
speaking about breakouts, it happens in the triangle pattern. so you could check the blue colour pattern drawn, its greatly forming the pattern.
so there could be a possible of breakouts.
many investors could step in, as nifty 50 will reach its good levels, then big FII-DII, could come take positions in nifty mid cap and small caps.
LASTLY, do even check the rsi, breaking the lower highs, and lower lows pattern.

Reliance_Long1. FII's - Bullish about Market
2.Reliance is on their radar
3.Price action - Also Bullish

ICICI BANK 15MINafter retrenchment ICICI bank Performs a uptrend move
We can initiate the BUY position for TARGET 720 725 740
with small Stop Loss 712

FII MARKET ANALYSEthis market will go up
RESULT :
- it's a good time to buy
- it will ARRIVE 135.72
- if it BREAK it WE can KEEP or DOUBLE our position

GPPL Add GPPL 103/93
we seen 114/124/146+
view invalid below 85wcb
Note: all views are education purpose only.

NIFTY Vs Dollar IndexNIFTY upmove has been powered with FII Inflows.
This in turn has been hit with with the collapsing dollar Index.
Dollar Index has for the first time show some base formation in Day time frame charts.
Will be interesting to watch out from these levels for a potential top in NIFTY if DXY pulls from here.
