#FIL/USDT#FIL
The price has been moving in a downward channel since last April
The downtrend for that channel was broken at $3
It is the same strong support area
The price has gained nearly 200% so far
Supported by oversold on MACD
It is supported by the moving average 100 break of 1 D Frame
Current price 5.5 $
First goal 7.06 $
Second goal 9.11 $
The market's upward momentum will lead us to the expected targets
But be aware that there are some corrections
FIL


FIL/USD Poised for Upward Movement Post-OB Rejection? 👀 🚀💎 Paradisers, focus on #FILUSDT as it displays a promising trading pattern. After experiencing rejection from a bearish Order Block (OB), it is now regaining upward momentum, indicating a strong likelihood of an upward movement following a successful breakthrough above the OB level.
💎Delving into #FILECOIN past market behavior, it has shown a consistent pattern of navigating a descending channel, breaking above, and then initiating an upward trend. Recently, after encountering resistance at the Bearish OB level of $5.755,#FIL retraced to a support level where it previously exhibited a Market Structure Shift (MSS). It’s now showing signs of regaining upward momentum to challenge the substantial supply level above at $9.168.
💎 However, in the ever-changing landscape of cryptocurrency trading, it’s essential to prepare for various possibilities. If #FIL struggles to sustain its current upward trajectory, attention should shift to potential bullish continuity from the support level of $4.228. A descent below this pivotal level might suggest a more significant downward trend. 🌴💰

FIL(based on NEo wave)my last analysis of this coin has failed but I didnt change up my mind.
so this is bow tie pattern and its ready to blow up soon!
my first target is 27$ and the others are clear.

Unleashing the Dragon: A Triple Trade Strategy for NEO, XTZ, FIL
🔥 Dive into the world of Chinese crypto powerhouses with our latest trade idea! 🇨🇳💹 In this video, we break down an exciting strategy for trading NEO, XTZ (Tezos), and Filecoin. These three coins are making waves in the crypto space, and we've uncovered a unique approach to capitalize on their potential.
🚀 NEO - often referred to as the "Ethereum of China," NEO has been gaining momentum with its smart contract capabilities. Find out how we're navigating the NEO landscape for maximum gains!
💰 XTZ (Tezos) - the self-amending blockchain that's all about governance and scalability. We've got a game plan to ride the Tezos wave and make the most of its innovative features.
📁 Filecoin - the decentralized storage solution changing the game. Discover our insights on Filecoin's market dynamics and how to position yourself strategically.
📈 Whether you're a seasoned trader or just getting started, this video is packed with valuable information to help you make informed decisions in the crypto market. Don't miss out on this triple threat trade opportunity – watch now and take your crypto portfolio to new heights! 💎💼
#CryptoTrading #NEO #Tezos #Filecoin #ChineseCrypto #TradingStrategy #CryptoInvesting #Blockchain 🌐🔐

SasanSeifi 💁♂ FIL/USDT DAILY ⏩ $4.30 / $4.50
In the daily time frame, as you can see, the price has experienced growth, moving from the demand zone and breaking through the $3.50 resistance, reaching the price range of $4. Currently, it seems like the price is in the process of completing a pullback.
What we can expect is that, after gathering liquidity and with a confirmed confirmation, the price may grow from the liquidity void area back to the $4 price range, as indicated in the image above. The significant support levels in the daily time frame are $3.50 and $3.
🔵Remember, always conduct your own analysis and consider other factors before
making any trading decisions. Good luck!"✌️
❎ (DYOR)...⚠️⚜️
Sure, if you have any more questions or need further clarification, feel free to ask. I'm here to help!
if you found my analysis helpful, I would appreciate it if you could show your support by liking and commenting. Thank you!🙌✌

FilecoinFIL / USDT
Filecoin is likely to move as i show you in my chart
The first strong resistance here is 5$ which is very important for monitoring when we resch there

FIL/USDT potential move? 👀 🚀 FIL Today Analysis💎 Paradisers, gear up for a promising prospect with FILUSDT as it firmly anchors to a crucial support, signaling a potential bullish shift.
💎 In our past assessments, FILUSDT displayed a pattern of descending channel movement. However, post its breakout, it embarked on an upward trajectory, only to face rejection from the overhead supply.
💎 Currently, it's revisiting the descending channel, which intriguingly now serves as a support. Our analysis suggests a strong likelihood of the price challenging the supply zone once again in the upcoming sessions.
💎 On the flip side, should FILUSDT fail to sustain its momentum above the support and breach it, brace for a notable downward movement.
💎 Remember to employ prudent trading strategies and use proper stop-loss measures! Stay alert to market movements and look forward to more insights

FILUSD working on a potential inverse head & shoulders breakout.First candle above the neckline is rarely the candle that confirms the breakout, but if we can get the current candle to close above the neckline as well as 1-4 more candles the probability of a breakout increases quite a bit with each additional candle close. For now w are still working on even getting our first candle close above the neckline but it does look promising. *not financial advice*

Get up, FILThis currency is in a falling trend, but it is near its support range, so the possibility of growth for this currency will not be far from expected.
In this analysis, we mentioned the important support and resistance ranges for this currency

Will the Filecoin exchange rate start soon? FIL/USDFor me, I really like this setup on the FIL chart. I think we should see a price action within a few days, just like the OG I shared earlier.
We can see divergences on both the FIL/USD and FIL/BTC charts.
With a huge space up. And FIL has been very oversold for quite some time now.
In addition, new partners appeared, to which the exchange rate has not yet reacted.
This trading is not investment advice. Weigh your options. Do your research on this.
I think it's a good setup. And this is an unmissable opportunity.
Which can spoil things if bitcoin suddenly goes down. (But now, in the short term, I think that the price movement of bitcoin will allow the price action to go up.)
I see the exchange rate as a time bomb that is about to explode.
We'll see.
Be careful

FILUSD where to buyHi Traders
We were bullish on Filecoin but now as the sentiment has changed, we see a potential drop looming in the shadow.
If it happens, we expect Filecoin to retest the bottom one more time.
We will be buyin Filecoin between 2,40$ and 2,80$.
If previous all time low is taken, then we would expect Filecoin to drop even lower, however now we don't expect it (not yet).
Buying at the green zone may be a great entry for a swing trade.
Exit would be around 9,40$
Make a note that it's a mid-term or even long-term idea and reaching 9$ may take even a year if we get a prolonged accumulation period.
Good luck

FILUSDTBINANCE:FILUSDT LONG
⚠️Note:
In this type of signals, only the entry point and trade direction are specified, and stop loss and target are not determined.
If you are interested in entering these signals, please provide a stop loss and a logical market-based target.
⛔"Daily crypto market analyses I provide are personal opinions & not financial advice. Trading carries risks, so do your own research & seek advisor's help.#DYOR"
Don't forget to like and comment

FIL: Ascending Triangle BreakoutFilecoin (FIL) technical analysis:
Trade setup : Bearish breakout from Ascending Triangle, in the direction of existing downtrend, signals further downside risk. Price has now also broke below $4.00 support and the next major support is around $3.00 where it bottomed in June.
Trend : Downtrend across all time horizons (Short- Medium- and Long-Term).
Momentum is Bearish (MACD Line is below MACD Signal Line, and RSI is below 45).
Support and Resistance : Nearest Support Zone is $4.00, which it broke, then $2.75. The nearest Resistance Zone is $5.00, then $6.50.

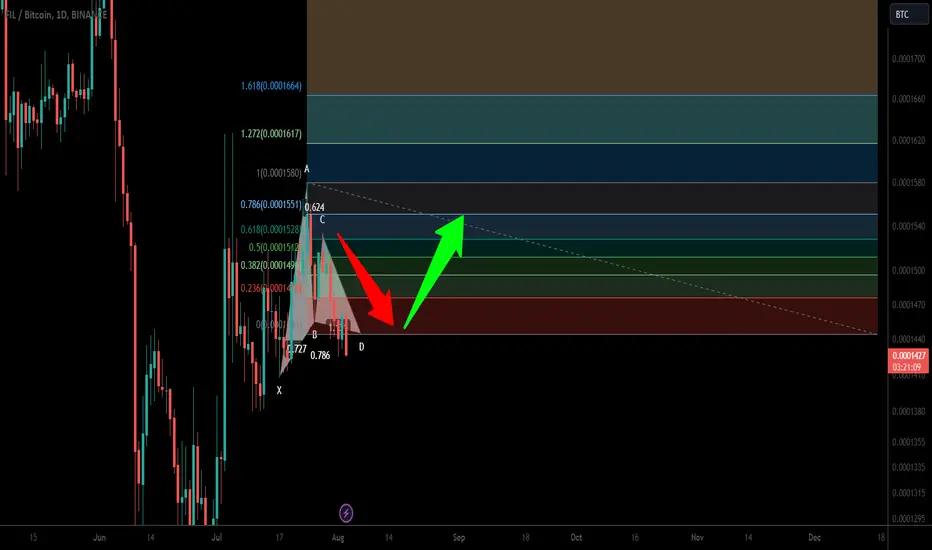
Filecoin (FIL) formed bullish Gartley for another price reversalHi dear friends, hope you are well and welcome to the new trade setup of Filecoin (FIL) coin with Bitcoin pair.
Recently we caught more than 28% pump as below:
Now on a daily time frame, FIL has formed a bullish Gartley move for the next price reversal.
Note: Above idea is for educational purpose only. It is advised to diversify and strictly follow the stop loss, and don't get stuck with trade.
FIL in the purchase zone !!!Global and Local purchase zones almost coincided green 4.315-1.187
Purchase level 2.341 (was)
The price of the orange volume is 4.381
Who is not on the train, before the last car departs.
Draw a Yellow figure!
Beauty. Already got high.
Just like in a hamster book :)))

FIL Bullish Opportunity !?On the day chart has a potental head and shoulder pattern
And we need to find a good time to set up our position
On 4 hour chart there is a apotential double bottom
If it break out (4.742) and stand firm
SL at 4.172
We can get more 5% profit than waiting for H&S pattern complete
and we can set TP 1(5.00)
Back to day chart
If 1(5.00) be breakout and TP as below
TP1:5.626
TP2:5.879
TP3:6.421
TP4:7.300

Watch $3.52 Support and Positive MACD SignalIn the short term, if the overall selling pressure in the market intensifies, and Bitcoin's price decreases towards lower support levels, it's crucial to keep an eye on FIL's significant support level at $3.52. This support level is expected to trigger a more pronounced reaction from investors, potentially leading to a shift in FIL's price trend.
Additionally, the MACD indicator at the daily timeframe currently stands at 0.079, indicating a relatively positive outlook for FIL.

⚫ LTC usdt - Weekly ⚫🔵 #LTC usdt
⏰ 1W
⚪ As you can see, the price has broken dynamic resistance and static resistance.
If fixed above $100, $130 is available.
🔴 Support and resistance are shown in the chart.
----------------------------------
📛 Follow the market trend and decide to buy or sell.
⚠️ (This isn't a signal for buy or sell) ⚠️
..........................................
👸 Analyzed by : Parisa_Alipoor
..........................................

Filecoin FIl price does not respond to crypto market fluctuationToday, let's take a look at the global chart of FILUSDT
This is the daily time frame, and it shows that the price of FIL has been on a downtrend since April 2021.
Today, the price of the Filecoin token has caught our attention because:
1. the price has approached a strong mirror level around $4.80 and at the same time is close to the trend line.
2. At the time of writing, the FILUSDT price has hardly reacted to the current rise and fall of the BTCUSDT price.
It is difficult to say how much longer the FILUSD price will remain in consolidation yet.
However, we can assume that after the FIL price breaks through the trend line and consolidates above $4.80, the growth to $7.30 can happen very quickly.
Now, the main thing is to watch for when FILUSDT breaks through the trend line and finally breaks out of the downtrend.
_____________________
Did you like our analysis? Leave a comment, like, and follow to get more

FILECOIN CRYPTO; Unlocking FIL's Potential📈 FREE MT filecoin TRADE SIGNAL AT THE END OF ANALYSIS 📈
📊Chart Analysis: FIL buyers have formed a double bottom pattern on the daily chart, indicating a potential bounce as accumulation continues at this support. According to MT's Pandoras Box 4hrs, the ongoing breakout is supported by a strong bullish candle. However, before the move continues, there will likely be a mini retest around the $4.58 range. It's important to consider that a larger rejection is expected around the $5 to $5.4 range, which could cause a bigger pullback and a retest of the $4.2 range. This presents a better entry opportunity with lower risk. Furthermore, it's worth noting that FIL is currently range-bound on higher timeframes like weekly and monthly, suggesting that a move towards $7 could lead to another retest of the low of the double bottom range, approximately around $3.5. In such a scenario, it is advisable to take some profit off the table if the price reaches that level and starts behaving unpredictably. Breaking the resistance could result in a move toward the $10 range, but there might be some price fluctuations along the way. Although there is a possibility of reaching $11, the probability is estimated at 65%. To manage the downside risk, it is recommended to set a stop loss at the $2.4 range, as a break below that level could lead to further downside. Therefore, while we expect bullish momentum, particularly at the current support level, it is important to remain cautious.
🚨Notice: This post will be regularly updated as the price progresses toward the target or in the event of potential failures due to rejections. We encourage readers to like, comment, and follow this page to stay updated with the latest developments and adjustments. Your engagement and support are greatly appreciated.
To enter, wait for a pullback to take the trade.
📈 FREE MT filecoin TRADE SIGNAL 📈
(Highly Bull Opportunities )
👉 ASSET: TSX:FIL (FIL/USDT)
👉 ACTION: LONG
👉 1st ENTRY PRICE: $3.91, 2nd Entry ; $4.199, 3rd Entry $4.6(wort entry)
(Buy Incrementally)
👉 STOP LOSS: $2.46(Risky Stop $3.24)
👉 1st TAKE PROFIT: $6.5
2nd TP: $7.4 3rd TP: $9.1(Extended $11.4)
Disclaimer: This signal is for informational purposes only and does not constitute financial advice. Cryptocurrency trading carries risk, and past performance is not a guarantee of future results. The user assumes full responsibility for any profits or losses incurred, and the signal provider is not liable for any investment decisions made based on this signal.

FIL Filecoin Double Bottom Chart PatternFIL (Filecoin) has shown an encouraging chart pattern with the formation of a double bottom, indicating the possibility of a bullish reversal. This pattern suggests that selling pressure may have reached a bottom, potentially leading to a shift in momentum.
With the double bottom pattern in play, FIL has the potential to experience an upward price movement, and your first price target of $5.60 seems within reach. As market sentiment improves and buying interest strengthens, FIL could witness significant price appreciation.
Looking forward to read your opinion about it!

Finally Fil Breaking out Formed Descending Channel & building Up For Massive Breakout Incase Of Breakout Expecting 240 to 260% bullish Rally In Midterm
